Indicators: DailyPivotPoints_Full
hi, could you please explain the extra levels of S/R?
are they fibonacci-based?
or are these merely extra S/R levels based on the same daily pivot?
I assume that the pivot point is in purple, correct?
Forum on trading, automated trading systems and testing trading strategies
Indicators: Pivot Lines TimeZone
newdigital, 2014.01.30 11:06
How to Use Forex Yearly Pivot Points to Forecast Euro Targets (based on dailyfx article)
- Pivot points is a popular and easy way that traders can identify potential support and resistance
- Pivot points are based on a mathematical calculation that uses the previous high, low and close of a specified period; weekly, daily, monthly, yearly
- Yearly pivots can forecast maximum and minimum price extremes for the coming year as well as areas where price can change direction.
While most traders are familiar with daily, weekly, and even monthly pivots which fit their type of trading, yearly pivots can also be used to forecast future potential support and resistance areas. Buying at or near a significant area of support and selling at a key area of resistance is the main focus of any trader no matter what the market or the duration traded. Yearly pivots can be monitored for those key trading opportunities.
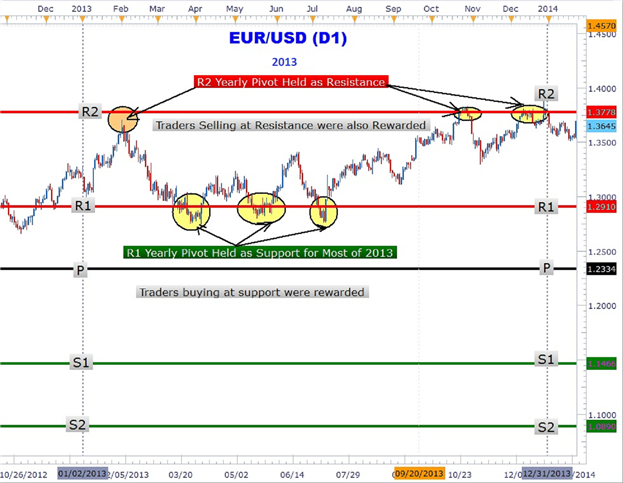
As you can clearly see in the Euro chart above, forex yearly pivots have been plotted. Notice how the Euro rallied up to the R2 pivot and turned around sharply falling over 600 pips in February. Another significant area that can be easily seen showing the power of yearly pivots is the triple touch of the R1 yearly pivot at 1.2910. The third and final touch led to over a 600-pip rally back to the R2 yearly pivot to close out 2013 up over 4%.
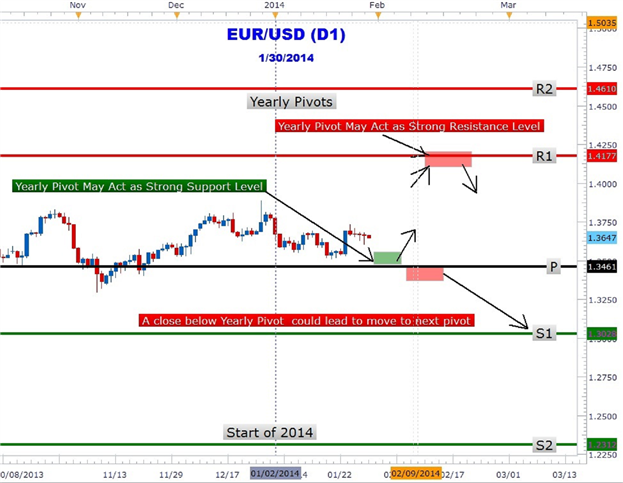
Could forex yearly pivots show traders the next move in the Euro? In the chart above the 2014 yearly pivots are plotted on the EURUSD chart. The year is just getting started and the great thing about yearly pivots is only having to draw them once a year! EURUSD is trapped between the central pivot at 1.3461 and R1 at 1.4177. As at the time of this writing, the Euro has not tested either pivot. However, forex traders may be waiting for a move down to the central pivot (1.3461) for a move back toward the R1 (1.4177) yearly pivot resistance.
Alternative scenario is for the Euro to make an immediate run for it up to the R1 level. At R1 pivot resistance, traders may look to take profit on their longs and/or short the Euro at this level. However, a close above R1 could lead to a move higher to the R2 pivot (1.4610). Traders should also consider the possibility of a close below the central pivot that could lead to a prolonged down push to the S1 (1.3028) level.
Forex traders who scalpers, position or swing traders can make use of yearly pivots to locate key areas of support and resistance. Look for future articles on other currency pairs that lay out the yearly pivot ‘landscape’ to help you navigate the forex market.
Forum on trading, automated trading systems and testing trading strategies
Indicators: Pivot Lines TimeZone
newdigital, 2013.10.30 12:57
Pivot Points Technical Indicator
Pivot points indicator consists of a central pivot which is surrounded by 3 resistance levels below and 3 support levels above.
Pivot points initially were used by floor traders to analyze and trade the equities and futures exchange markets. This indicator is considered to be a leading indicator rather than a lagging indicator.
Pivots provide a quick way for currency traders to analyze the general trend of how the market is going to be moving during the course of the day. This indicator uses only a few simple calculations to plot the resistance and support levels.
To calculate the pivot points for the coming trading day is the previous day's
- high,
- low, and
- close prices are used
The Forex trading day closes at 5:00PM EST this daily closing time is when the pivots are updated.
The 24-hour cycle pivots for this indicator are calculated using a complex formula, which the indicator will calculate automatically for you. The central pivot is then used to calculate the support and resistance levels as follows:
- Resistance 3
- Resistance 2
- Resistance 1
- Pivot Point
- Support 1
- Support 2
- Support 3
Pivots can be used in different ways to generate Forex trading signals. The following methods are the most common technical analysis for Pivot points.
Trend Identification Signals
The central pivot is used by traders to determine the general market trend direction. The trades taken will only be in the direction of the market trend.
- Buy signal- price is above the central pivot
- Sell signal- price is below the central pivot
Price Breakout Signals
Price breakout signals are generated as follows
- Buy signal- is generated when the price breaks upwards through the central point.
- Sell signal- is generated when the price breaks downwards through the central point.
Price Reversal Signal
Price reversals are generated as follows
- Buy signal- when price moves down towards one of the support level, then touches the support or moves slightly through it then quickly reverses and moves upwards.
- Sell signal- when price moves up towards one of the resistance level, then touches the resistance or moves slightly through it then quickly reverses and moves downwards.
Setting Stop loss and Limit Profit Values using Support & Resistance Levels
The central pivotand the other support and resistance levels are used by traders to determine suitable stop loss and limit profit levels.
If a buy is placed above the central pivot point the Resistance 1 or Resistance 2 can be used to set the take profit level, and the Support 1 can be set as the Stop Loss Level for the trade.
Forum on trading, automated trading systems and testing trading strategies
Indicators: Pivot Lines TimeZone
newdigital, 2014.01.30 11:06
How to Use Forex Yearly Pivot Points to Forecast Euro Targets (based on dailyfx article)
- Pivot points is a popular and easy way that traders can identify potential support and resistance
- Pivot points are based on a mathematical calculation that uses the previous high, low and close of a specified period; weekly, daily, monthly, yearly
- Yearly pivots can forecast maximum and minimum price extremes for the coming year as well as areas where price can change direction.
While most traders are familiar with daily, weekly, and even monthly pivots which fit their type of trading, yearly pivots can also be used to forecast future potential support and resistance areas. Buying at or near a significant area of support and selling at a key area of resistance is the main focus of any trader no matter what the market or the duration traded. Yearly pivots can be monitored for those key trading opportunities.
As you can clearly see in the Euro chart above, forex yearly pivots have been plotted. Notice how the Euro rallied up to the R2 pivot and turned around sharply falling over 600 pips in February. Another significant area that can be easily seen showing the power of yearly pivots is the triple touch of the R1 yearly pivot at 1.2910. The third and final touch led to over a 600-pip rally back to the R2 yearly pivot to close out 2013 up over 4%.
Could forex yearly pivots show traders the next move in the Euro? In the chart above the 2014 yearly pivots are plotted on the EURUSD chart. The year is just getting started and the great thing about yearly pivots is only having to draw them once a year! EURUSD is trapped between the central pivot at 1.3461 and R1 at 1.4177. As at the time of this writing, the Euro has not tested either pivot. However, forex traders may be waiting for a move down to the central pivot (1.3461) for a move back toward the R1 (1.4177) yearly pivot resistance.
Alternative scenario is for the Euro to make an immediate run for it up to the R1 level. At R1 pivot resistance, traders may look to take profit on their longs and/or short the Euro at this level. However, a close above R1 could lead to a move higher to the R2 pivot (1.4610). Traders should also consider the possibility of a close below the central pivot that could lead to a prolonged down push to the S1 (1.3028) level.
Forex traders who scalpers, position or swing traders can make use of yearly pivots to locate key areas of support and resistance. Look for future articles on other currency pairs that lay out the yearly pivot ‘landscape’ to help you navigate the forex market.
Forum on trading, automated trading systems and testing trading strategies
Discussion of article "MQL5 for Newbies: Guide to Using Technical Indicators in Expert Advisors"
newdigital, 2014.02.27 16:46
Introduction to Technical Indicators (based on dailyfx aticle)
Trend Following
Trend following indicators were created to help traders trade currency pairs that are trending up or trending down. We have all heard the phrase “the trend is your friend.” These indicators can help point out the direction of the trend and can tell us if a trend actually exists.
Moving Averages
A Moving Average (MA for short) is a technical tool that averages a currency pair’s price over a period of time. The smoothing effect this has on the chart helps give a clearer indication on what direction the pair is moving… either up, down, or sideways. There are a variety of moving averages to choose from. Simple Moving Averages and Exponential Moving Averages are by far the most popular.
Ichimoku
Ichimoku is a complicated looking trend assistant that turns out to be much simpler than it initially appears. This Japanese indicator was created to be a standalone indicator that shows current trends, displays support/resistance levels, and indicates when a trend has likely reversed. Ichimoku roughly translates to “one glance” since it is meant to be a quick way to see how price is behaving on a chart.
ADX
The Average Direction Index takes a different method when it comes to analyzing trends. It won’t tell you whether price is trending up or down, but it will tell you if price is trending or is ranging. This makes it the perfect filter for either a range or trend strategy by making sure you are trading based on current market conditions.
Oscillators
Oscillators give traders an idea of how momentum is developing on a specific currency pair. When price treks higher, oscillators will move higher. When price drops lower, oscillators will move lower. Whenever oscillators reach an extreme level, it might be time to look for price to turn back around to the mean. However, just because an oscillator reaches “Overbought” or “Oversold” levels doesn’t mean we should try to call a top or a bottom. Oscillators can stay at extreme levels for a long time, so we need to wait for a valid sign before trading.
RSI
The Relative Strength Index is arguably the most popular oscillator out there. A big component of its formula is the ratio between the average gain and average loss over the last 14 periods. The RSI is bound between 0 – 100 and is considered overbought above 70 and oversold when below 30. Traders generally look to sell when 70 is crossed from above and look to buy when 30 is crossed from below.
Stochastics
Stochastics offer traders a different approach to calculate price oscillations by tracking how far the current price is from the lowest low of the last X number of periods. This distance is then divided by the difference between the high and low price during the same number of periods. The line created, %K, is then used to create a moving average, %D, that is placed directly on top of the %K. The result is two lines moving between 0-100 with overbought and oversold levels at 80 and 20. Traders can wait for the two lines to crosses while in overbought or oversold territories or they can look for divergence between the stochastic and the actual price before placing a trade.
CCI
The Commodity Channel Index is different than many oscillators in that there is no limit to how high or how low it can go. It uses 0 as a centerline with overbought and oversold levels starting at +100 and -100. Traders look to sell breaks below +100 and buy breaks above -100. To see some real examples of the CCI in action,
MACD
The Moving Average Convergence/Divergence tracks the difference between two EMA lines, the 12 EMA and 26 EMA. The difference between the two EMAs is then drawn on a sub-chart (called the MACD line) with a 9 EMA drawn directly on top of it (called the Signal line). Traders then look to buy when the MACD line crosses above the signal line and look to sell when the MACD line crosses below the signal line. There are also opportunities to trade divergence between the MACD and price.
Volatility
Volatility measures how large the upswings and downswings are for a particular currency pair. When a currency’s price fluctuates wildly up and down it is said to have high volatility. Whereas a currency pair that does not fluctuate as much is said to have low volatility. It’s important to note how volatile a currency pair is before opening a trade, so we can take that into consideration with picking our trade size and stop and limit levels.
Bollinger Bands®
Bollinger Bands print 3 lines directly on top of the price chart. The middle ‘band’ is a 20-period simple moving average with an upper and low ‘band’ that are drawn 2 standard deviations above and below the 20 MA. This means the more volatile the pair is, the wider the outer bands will become, giving the Bollinger Bands the ability to be used universally across currency pairs no matter how they behave. The wider the bands, the more volatile the pair. Most common uses for Bollinger Bands are trying to trade double tops/bottoms that hit an upper or lower band or looking to trade bounces off an outer band in the direction of the overall trend.
Bollinger Bands® is a registered trademark of John Bollinger.
ATR
The Average True Range tells us the average distance between the high and low price over the last X number of bars (typically 14). This indicator is presented in pips where the higher the ATR gets, the more volatile the pair, and vice versa. This makes it a perfect tool to measure volatility and also can be a huge help when selecting where we should set our stop losses.
Support/Resistance
Pivot Points
Being one of the older technical indicators, Pivot Points are one of the most widely used in all markets including equities, commodities, and Forex. They are created using a formula composed of high, low and close prices for the previous period. There is a central pivot line and subsequent support lines and resistance lines surrounding it. Traders use these lines as potential support and resistance levels, levels that price might have a difficult time breaking through.
Donchian Channels
Price channels or Donchian Channels are lines above and below recent price action that show the high and low prices over an extended period of time These lines can then act as support or resistance if price comes into contact with them again. A common use for Donchian channels is trading a break of a line in the direction of the overall trend. This strategy was made famous by Richard Dennis’ Turtle Traders where Dennis took everyday people and was able to successfully teach them how to trade futures based on price channels.
- Free trading apps
- Over 8,000 signals for copying
- Economic news for exploring financial markets
You agree to website policy and terms of use
DailyPivotPoints_Full:
The DailyPivot Points indicator helps to compose a picture of market future movements, in distinct from the other tools that hang behind the market. The information that became availble in the course of the previous day is used to calculate the check points of the minor trend of the current day.
This variant of the DailyPivot Points indicator can be built for any bar of a chart and a complete picture of the market behaviour relative to the indicator levels at each bar can be seen. Probably the best way to use the indicator is to analyze a strategy, while working offline.
Author: Nikolay Kositsin