Join our fan page
- Views:
- 17265
- Rating:
- Published:
- Updated:
-
Need a robot or indicator based on this code? Order it on Freelance Go to Freelance
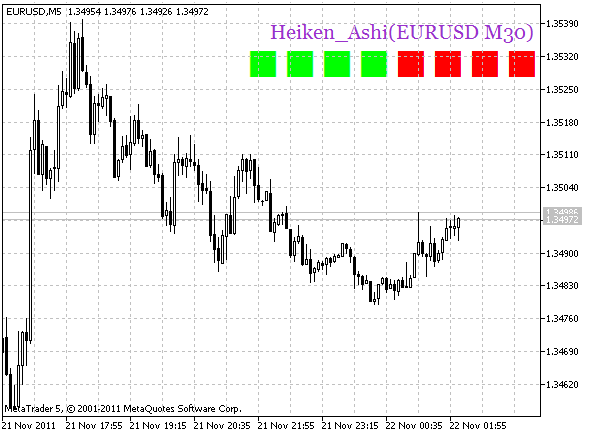
Heiken_Ashi_Smoothed_HTF_Signal displays trend directions from the last bars of the Heiken_Ashi_Smoothed as a sequence of graphical objects colored according to a trend direction. The number of bars to be used is set in the input parameters. Red color shows a descending trend, while lime color signals about an ascending one.
Indicator input parameters:
A timeframe and a name of a financial asset used for the indicator calculation can be changed by the indicator appropriate input parameters. If Symbol_ (financial asset) input parameter is empty, the current chart symbol shall be used as a financial asset.
All input parameters can be divided into two large groups:
- Heiken_Ashi_Smoothed indicator input parameters:
//+-----------------------------------+
//|  Indicator input parameters       |
//+-----------------------------------+
input string Symbol_="";                   // Financial asset
input ENUM_TIMEFRAMES Timeframe=PERIOD_H6; // Timeframe for the indicator calculation
input Smooth_Method hMA_Method=MODE_JJMA;  // Smoothing method
input int hLength=30;                      // Smoothing depth
input int hPhase=100;                      // Smoothing parameter
- Heiken_Ashi_Smoothed_HTF_Signal indicator input parameters that are necessary for the indicator visualization:
//---- indicator display settings
input string Symbols_Sirname="Heiken_Ashi_Label_"; // Indicator labels names
input uint  BarTotal=4;                            // Number of displayed bars
input color UpSymbol_Color=Lime;                   // Growth symbol color
input color DnSymbol_Color=Red;                    // Downfall symbol color
input color IndName_Color=DarkOrchid;              // Indicator name color
input uint Symbols_Size=34;                        // Signal symbols size
input uint Font_Size=15;                           // Indicator name font size
input int Xn=5;                                    // Horizontal shift of the name
input int Yn=-20;                                  // Vertical shift of the name
input bool ShowIndName=true;                       // Indicator name display
input ENUM_BASE_CORNER  WhatCorner=CORNER_RIGHT_UPPER; // Location corner
input uint X_=0;                                   // Horizontal shift
input uint Y_=30;                                  // Vertical shift
In case several Heiken_Ashi_Smoothed_HTF_Signal indicators are to be used on one chart, each of them should have its own Symbols_Sirname (indicators labels names) string variable value.
Place the Heiken_Ashi_Smoothed indicator compiled file to the terminal_data_folder\MQL5\Indicators.
The indicators use SmoothAlgorithms.mqh library classes (must be copied to the terminal_data_folder\MQL5\Include). The use of the classes was thoroughly described in the article "Averaging Price Series for Intermediate Calculations Without Using Additional Buffers".

Translated from Russian by MetaQuotes Ltd.
Original code: https://www.mql5.com/ru/code/701
 IncFramaOnArray
The CFramaOnArray class is intended for calulcation of Fractal Adaptive Moving Average (FRAMA) on indicator buffers.
 IncOBVOnArray
The COBVOnArray class is intended for calculation of OBV (On Balance Volume) on indicator buffers.
 Break_Lag_ATR
The indicator showing volatility breakout as a histogram and serving as a signal for market entry/exit/position reversal or position volume increasing.
 VQ bars
Trend indicator that sets color dots on a price chart according to a trend direction.