Join our fan page
- Views:
- 118947
- Rating:
- Published:
- Updated:
-
Need a robot or indicator based on this code? Order it on Freelance Go to Freelance
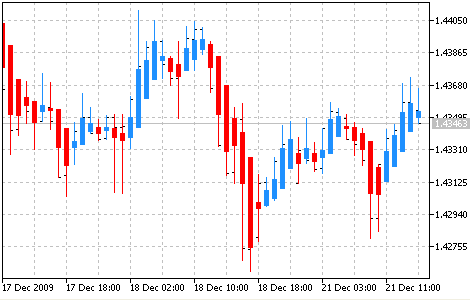
The Heiken-Ashi indicator looks like the candlestick chart, but it has some difference. Instead of the use of the standard OHLC values for candles, it uses another formulas:
Close = (Open+High+Low+Close)/4
Open = [Open (previous bar) + Close (previous bar)]/2
High = Max (High,Open,Close)
Low = Min (Low,Open, Close)
in other words, the indicator shows the "synthetic" candlesticks, which are different from the standard.
Image:

Heiken Ashi Indicator
The color of the Heiken-Ashi candlesticks depends on shadows.
The advantage of the Heiken-Ashi charts is a simple trend determination, the upward trend candles are blue,the downward trend candles are red.
For profitable trading it is necessary to use it with the standard candlesticks (and analysis) and with the other indicators.
Translated from Russian by MetaQuotes Ltd.
Original code: https://www.mql5.com/ru/code/33
 Gator Oscillator
The Gator Oscillator is based on the Alligator and shows the degree of convergence/divergence of the Balance Lines (Smoothed Moving Average).
 Fractals
The Fractal is one of 5 indicators of Bill Williams’ trading system, which allows to detect the bottom or the top.
 Ichimoku Kinko Hyo
The Indicator Ichimoku Kinko Hyo is predefined to characterize the market Trend, Support and Resistance Levels, and to generate signals of buying and selling.
 MACD
MACD
The Moving Average Convergence/Divergence (MACD) is the next trend-following dynamic indicator. It indicates the correlation between two Moving Averages of a price.