MQL5での取引戦略の自動化(第31回):プライスアクションに基づくスリードライブハーモニックパターンシステムの作成

はじめに
前回の記事(第30回)では、MetaQuotes Language 5 (MQL5)でフィボナッチ比率を用いて弱気と強気のAB=CDパターンを検出し、算出されたエントリー、ストップロス(SL)、テイクプロフィット(TP)レベルで取引を自動化し、三角形やトレンドラインなどのチャートオブジェクトによってパターンを可視化するAB=CDパターンシステムを開発しました。第31回では、ピボットポイントと特定のフィボナッチリトレースメントおよびエクステンションを用いて、強気と弱気のスリードライブハーモニックパターンを識別するスリードライブパターンシステムを作成します。このシステムは、カスタマイズ可能なTPとSLのオプションを使用して取引を実行し、視覚的な三角形、トレンドライン、ラベルによってパターンを明確に表現します。本記事では以下のトピックを扱います。
この記事を読み終える頃には、スリードライブハーモニックパターン取引のためのロバストなMQL5戦略を手に入れ、自由にカスタマイズできるようになります。それでは、さっそく始めましょう。
スリードライブハーモニックパターンフレームワークを理解する
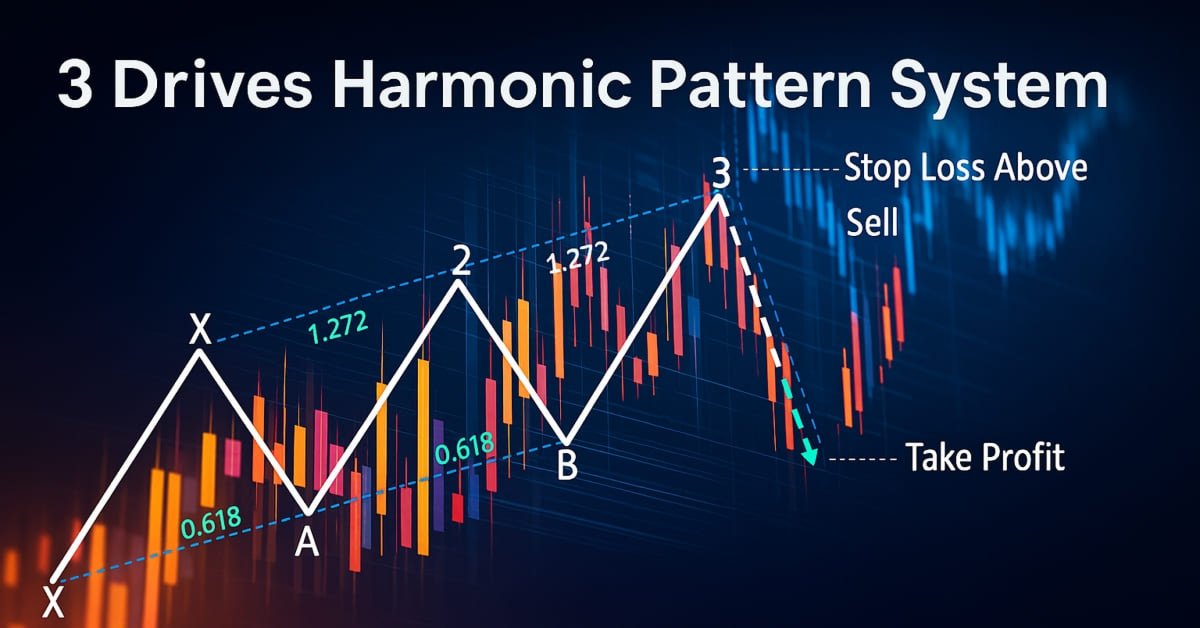
スリードライブパターンは、A、B、C、D、E、Fの6つの主要なスイングポイントから構成されるハーモニック取引のフォーメーションで、強気と弱気の両方の形があります。特定のフィボナッチリトレースメントとフィボナッチエクステンションを伴う3つの連続した価格ドライブを通して、反転ゾーンを特定するように設計されています。強気のスリードライブパターンでは、構造は高値-安値-高値-安値-高値-安値というシーケンスを形成します。Aはスイングハイ、Bはスイングロー(ドライブ1)、Cはスイングハイ、Dはスイングロー(ドライブ2)、Eはスイングハイ、Fはスイングロー(ドライブ3で、DとBを下回る位置)です。各リトレースメント(BC、DE)は直前のドライブの約0.618または0.786であり、各ドライブ(CD、EF)は直前のリトレースメントの1.13〜1.618に拡張します。弱気パターンではこのシーケンスが反転し、FはDとBを上回る位置になります。以下にパターンの可視化を示します。
弱気のスリードライブハーモニックパターン

強気のスリードライブハーモニックパターン

私たちのアプローチには、指定されたバーの範囲内でこれらのスイングピボットを検出し、フィボナッチ基準に照らしてパターンのレッグを確認し、三角形やトレンドラインなどのチャートオブジェクトを使用してABCDEF構造を視覚化し、カスタマイズ可能なSL(フィボナッチベースまたは固定)とTPレベル(0.382、0.618、またはEピボット)を使用してFポイントで取引を実行し、予想される反転を活用します。それでは、MQL5での実装に進みましょう。
MQL5での実装
MQL5でプログラムを作成するには、まずMetaEditorを開き、ナビゲータに移動して、Indicatorsフォルダを見つけ、[新規作成]タブをクリックして、表示される手順に従ってファイルを作成します。ファイルが作成されたら、コーディング環境で、まずプログラム全体で使用するグローバル変数をいくつか宣言する必要があります。
//+------------------------------------------------------------------+
//|                                          3 Drives Pattern EA.mq5 |
//|                        Copyright 2025, Forex Algo-Trader, Allan. |
//|                                 "https://t.me/Forex_Algo_Trader" |
//+------------------------------------------------------------------+
#property copyright "Forex Algo-Trader, Allan"
#property link "https://t.me/Forex_Algo_Trader"
#property version "1.00"
#property description "This EA trades based on 3 Drives Strategy"
#property strict

//--- Include the trading library for order functions
#include <Trade\Trade.mqh>   //--- Include Trade library
CTrade obj_Trade;            //--- Instantiate a obj_Trade object
//--- Enumeration for TP levels
enum ENUM_TAKE_PROFIT_LEVEL {
   TP1 = 1, // 0.382 Fibonacci Retracement
   TP2 = 2, // 0.618 Fibonacci Retracement
   TP3 = 3  // Pivot E Price
};
//--- Enumeration for SL types
enum ENUM_STOP_LOSS_TYPE {
   SL_FIBO = 1, // Fibonacci Extension
   SL_FIXED = 2 // Fixed Points
};
//--- Input parameters for user configuration
input int PivotLeft = 5;                              // Number of bars to the left for pivot check
input int PivotRight = 5;                             // Number of bars to the right for pivot check
input double Tolerance = 0.10;                        // Allowed deviation (10% of move)
input double LotSize = 0.01;                          // Lot size for new orders
input bool AllowTrading = true;                       // Enable or disable trading
input ENUM_TAKE_PROFIT_LEVEL TakeProfitLevel = TP2;   // Take Profit Level
input ENUM_STOP_LOSS_TYPE StopLossType = SL_FIBO;     // Stop Loss Type
input double SL_FiboExtension = 1.618;                // Fibonacci Extension for SL
input double SL_FixedPoints = 50;                     // Fixed Points for SL (in points)
//---------------------------------------------------------------------------
//--- 3 Drives pattern definition:
//
//--- Bullish 3 Drives:
//--- Pivots (A-B-C-D-E-F): A swing high, B swing low (drive 1), C swing high, D swing low (drive 2), E swing high, F swing low (drive 3).
//--- Retracements at 0.618, drives at 1.272 extensions.
//
//--- Bearish 3 Drives:
//--- Pivots (A-B-C-D-E-F): A swing low, B swing high (drive 1), C swing low, D swing high (drive 2), E swing low, F swing high (drive 3).
//--- Retracements at 0.618, drives at 1.272 extensions.
//---------------------------------------------------------------------------
//--- Structure for a pivot point
struct Pivot {
   datetime time; //--- Bar time of the pivot
   double price;  //--- Pivot price (High for swing high, low for swing low)
   bool isHigh;   //--- True if swing high; false if swing low
};
//--- Global dynamic array for storing pivots in chronological order
Pivot pivots[]; //--- Declare a dynamic array to hold identified pivot points
//--- Global variables to lock in a pattern (avoid trading on repaint)
int g_patternFormationBar = -1; //--- Bar index where the pattern was formed (-1 means none)
datetime g_lockedPatternA = 0;  //--- The key A pivot time for the locked pattern
//--- Global array to track traded patterns (using A.time as identifier)
datetime tradedPatterns[];
スリードライブパターンの基盤を構築するために、まず<Trade\Trade.mqh>ライブラリをインクルードし、売買注文の実行などの取引操作を処理するためにobj_TradeをCTradeオブジェクトとしてインスタンス化します。次に、柔軟な取引設定のために列挙体「ENUM_TAKE_PROFIT_LEVEL」(TP1は0.382、TP2は0.618、TP3はピボットE価格)と「ENUM_STOP_LOSS_TYPE」(フィボナッチエクステンションの場合はSL_FIBO、固定点の場合はSL_FIXED)を定義し、入力パラメータを設定します。PivotLeftとPivotRightはピボット検出のために5本に設定し、Toleranceはフィボナッチ乖離用に0.10、LotSizeは0.01、AllowTradingはtrue、TakeProfitLevelはTP2、StopLossTypeはSL_FIBO、SL_FiboExtensionは1.618、SL_FixedPointsは50に設定します。
次に、スイングポイントを格納するためにtime、price、isHighを持つPivot構造体を定義し、pivotsを動的配列として宣言します。また、グローバル変数g_patternFormationBarを-1に、パターンロック用のg_lockedPatternAを0に初期化し、Aのtimeを使って取引済みパターンを追跡するtradedPatternsを配列として初期化します。この設定は、スリードライブパターンを検出して取引するための基本的なフレームワークを提供します。 可視化のために、ライン、ラベル、三角形を描画する関数を用意します。
//+------------------------------------------------------------------+
//| Helper: Draw a filled triangle                                   |
//+------------------------------------------------------------------+
void DrawTriangle(string name, datetime t1, double p1, datetime t2, double p2, datetime t3, double p3, color cl, int width, bool fill, bool back) {
   //--- Attempt to create a triangle object with three coordinate points
   if(ObjectCreate(0, name, OBJ_TRIANGLE, 0, t1, p1, t2, p2, t3, p3)) {
      //--- Set the triangle's color
      ObjectSetInteger(0, name, OBJPROP_COLOR, cl);
      //--- Set the triangle's line style to solid
      ObjectSetInteger(0, name, OBJPROP_STYLE, STYLE_SOLID);
      //--- Set the line width of the triangle
      ObjectSetInteger(0, name, OBJPROP_WIDTH, width);
      //--- Determine if the triangle should be filled
      ObjectSetInteger(0, name, OBJPROP_FILL, fill);
      //--- Set whether the object is drawn in the background
      ObjectSetInteger(0, name, OBJPROP_BACK, back);
   }
}
//+------------------------------------------------------------------+
//| Helper: Draw a trend line                                        |
//+------------------------------------------------------------------+
void DrawTrendLine(string name, datetime t1, double p1, datetime t2, double p2, color cl, int width, int style) {
   //--- Create a trend line object connecting two points
   if(ObjectCreate(0, name, OBJ_TREND, 0, t1, p1, t2, p2)) {
      //--- Set the trend line's color
      ObjectSetInteger(0, name, OBJPROP_COLOR, cl);
      //--- Set the trend line's style (solid, dotted, etc.)
      ObjectSetInteger(0, name, OBJPROP_STYLE, style);
      //--- Set the width of the trend line
      ObjectSetInteger(0, name, OBJPROP_WIDTH, width);
   }
}
//+------------------------------------------------------------------+
//| Helper: Draw a dotted trend line                                 |
//+------------------------------------------------------------------+
void DrawDottedLine(string name, datetime t1, double p, datetime t2, color lineColor) {
   //--- Create a horizontal trend line at a fixed price level with dotted style
   if(ObjectCreate(0, name, OBJ_TREND, 0, t1, p, t2, p)) {
      //--- Set the dotted line's color
      ObjectSetInteger(0, name, OBJPROP_COLOR, lineColor);
      //--- Set the line style to dotted
      ObjectSetInteger(0, name, OBJPROP_STYLE, STYLE_DOT);
      //--- Set the line width to 1
      ObjectSetInteger(0, name, OBJPROP_WIDTH, 1);
   }
}
//+------------------------------------------------------------------+
//| Helper: Draw anchored text label (for pivots)                    |
//| If isHigh is true, anchor at the bottom (label appears above);   |
//| if false, anchor at the top (label appears below).               |
//+------------------------------------------------------------------+
void DrawTextEx(string name, string text, datetime t, double p, color cl, int fontsize, bool isHigh) {
   //--- Create a text label object at the specified time and price
   if(ObjectCreate(0, name, OBJ_TEXT, 0, t, p)) {
      //--- Set the text of the label
      ObjectSetString(0, name, OBJPROP_TEXT, text);
      //--- Set the color of the text
      ObjectSetInteger(0, name, OBJPROP_COLOR, cl);
      //--- Set the font size for the text
      ObjectSetInteger(0, name, OBJPROP_FONTSIZE, fontsize);
      //--- Set the font type and style
      ObjectSetString(0, name, OBJPROP_FONT, "Arial Bold");
      //--- Anchor the text depending on whether it's a swing high or low
      if(isHigh)
         ObjectSetInteger(0, name, OBJPROP_ANCHOR, ANCHOR_BOTTOM);
      else
         ObjectSetInteger(0, name, OBJPROP_ANCHOR, ANCHOR_TOP);
      //--- Center-align the text
      ObjectSetInteger(0, name, OBJPROP_ALIGN, ALIGN_CENTER);
   }
}
スリードライブハーモニックパターンとその取引レベルの明確なチャート表現を作成するために、可視化関数を実装していきます。まずDrawTriangle関数を作成します。この関数ではObjectCreateを使用してOBJ_TRIANGLEを作成し、3つの時刻(t1、t2、t3)と価格(p1、p2、p3)で塗りつぶされた三角形を描画します。その後、ObjectSetIntegerを使用してOBJPROP_COLORに指定の色を設定し、OBJPROP_STYLEをSTYLE_SOLIDに設定、OBJPROP_WIDTHで線幅を指定、OBJPROP_FILLで塗りつぶしの有効・無効を設定し、ObjectSetInteger 関数を用いてOBJPROP_BACKで背景か前景かを指定します。次に、2点間にトレンドライン(OBJ_TREND)を描画するDrawTrendLine関数の作成に進みます。
次にDrawDottedLine関数を実装します。この関数では、指定した価格で水平の点線(OBJ_TREND)を描画します。最後に、ObjectCreateを用いて座標(t、p)にテキストラベル(OBJ_TEXT)を作成し、ObjectSetStringとObjectSetIntegerを使用してOBJPROP_TEXTを指定テキストに設定し、OBJPROP_COLOR、OBJPROP_FONTSIZE、OBJPROP_FONTをArial Boldに設定し、OBJPROP_ANCHORを使用してisHighに基づきスイングハイの場合は下に、スイングローの場合は上にアンカーし、OBJPROP_ALIGNを用いて中央に配置するDrawTextEx関数を開発します。 これでOnTickイベントハンドラへ進み、後のパターン認識で使用するピボットポイントの特定をおこなう準備が整いました。そのためのロジックを以下に実装します。
//+------------------------------------------------------------------+
//| Expert tick function                                             |
//+------------------------------------------------------------------+
void OnTick() {
   //--- Declare a static variable to store the time of the last processed bar
   static datetime lastBarTime = 0;
   //--- Get the time of the current confirmed bar
   datetime currentBarTime = iTime(_Symbol, _Period, 1);
   //--- If the current bar time is the same as the last processed, exit
   if(currentBarTime == lastBarTime)
      return;
   //--- Update the last processed bar time
   lastBarTime = currentBarTime;

   //--- Clear the pivot array for fresh analysis
   ArrayResize(pivots, 0);
   //--- Get the total number of bars available on the chart
   int barsCount = Bars(_Symbol, _Period);
   //--- Define the starting index for pivot detection (ensuring enough left bars)
   int start = PivotLeft;
   //--- Define the ending index for pivot detection (ensuring enough right bars)
   int end = barsCount - PivotRight;

   //--- Loop through bars from 'end-1' down to 'start' to find pivot points
   for(int i = end - 1; i >= start; i--) {
      //--- Assume current bar is both a potential swing high and swing low
      bool isPivotHigh = true;
      bool isPivotLow = true;
      //--- Get the high and low of the current bar
      double currentHigh = iHigh(_Symbol, _Period, i);
      double currentLow = iLow(_Symbol, _Period, i);
      //--- Loop through the window of bars around the current bar
      for(int j = i - PivotLeft; j <= i + PivotRight; j++) {
         //--- Skip if the index is out of bounds
         if(j < 0 || j >= barsCount)
            continue;
         //--- Skip comparing the bar with itself
         if(j == i)
            continue;
         //--- If any bar in the window has a higher high, it's not a swing high
         if(iHigh(_Symbol, _Period, j) > currentHigh)
            isPivotHigh = false;
         //--- If any bar in the window has a lower low, it's not a swing low
         if(iLow(_Symbol, _Period, j) < currentLow)
            isPivotLow = false;
      }
      //--- If the current bar qualifies as either a swing high or swing low
      if(isPivotHigh || isPivotLow) {
         //--- Create a new pivot structure
         Pivot p;
         //--- Set the pivot's time
         p.time = iTime(_Symbol, _Period, i);
         //--- Set the pivot's price depending on whether it is a high or low
         p.price = isPivotHigh ? currentHigh : currentLow;
         //--- Set the pivot type (true for swing high, false for swing low)
         p.isHigh = isPivotHigh;
         //--- Get the current size of the pivots array
         int size = ArraySize(pivots);
         //--- Increase the size of the pivots array by one
         ArrayResize(pivots, size + 1);
         //--- Add the new pivot to the array
         pivots[size] = p;
      }
   }
}
ここでは、OnTick関数の初期ロジックを実装します。まず、最後に処理したバーを追跡するために0で初期化した静的変数lastBarTimeを宣言し、現在のシンボルと時間枠におけるシフト1のiTimeから取得したcurrentBarTimeと比較し、変化がない場合は冗長な処理を避けるため終了し、新しいバーが検出された時点でlastBarTimeを更新します。次に、ArrayResizeを使用してpivots配列をクリアし、新しい解析を始めます。
その後、Barsでバーの総数を取得し、ピボット検出の範囲としてstartをPivotLeft、endを総バー数からPivotRightを引いた値に設定し、「end − 1」からstartまでのバーを順に処理します。各バーについて、スイングハイ(isPivotHighがtrue)およびスイングロー(isPivotLowがtrue)であると仮定し、iHighとiLowを使ってそのバーの高値と安値を取得し、PivotLeftおよびPivotRightの範囲内にある周囲のバーをiHighとiLowでチェックし、隣接するバーにより高い高値またはより低い安値が存在する場合は、そのピボットを無効とします。最後に、バーがピボットとして有効であればPivot構造体を生成し、timeをiTimeで設定し、priceをisPivotHighに応じて高値または安値に設定し、isHighフラグを割り当てて、ArrayResizeを用いてpivots配列に追加します。ピボット構造体を印刷すると、次のデータ配列が取得されます。

このデータを使ってピボットポイントを抽出でき、十分な数のピボットがあればパターンの解析と検出をおこなうことができます。これを実現するために、以下のロジックを実装しています。
//--- Determine the total number of pivots found
int pivotCount = ArraySize(pivots);
//--- If fewer than six pivots are found, the pattern cannot be formed
if(pivotCount < 6) {
   //--- Reset pattern lock variables
   g_patternFormationBar = -1;
   g_lockedPatternA = 0;
   //--- Exit the OnTick function
   return;
}

//--- Extract the last six pivots as A, B, C, D, E, F
Pivot A = pivots[pivotCount - 6];
Pivot B = pivots[pivotCount - 5];
Pivot C = pivots[pivotCount - 4];
Pivot D = pivots[pivotCount - 3];
Pivot E = pivots[pivotCount - 2];
Pivot F = pivots[pivotCount - 1];

//--- Initialize a flag to indicate if a valid 3 Drives pattern is found
bool patternFound = false;
//--- Initialize pattern type
string patternType = "";
double used_ext = 0.0;
//--- Define fib ratios
double retr_levels[] = {0.618, 0.786};
double ext_levels[] = {1.13, 1.272, 1.618};
//--- Check for the high-low-high-low-high-low (Bullish reversal) structure
if(A.isHigh && (!B.isHigh) && C.isHigh && (!D.isHigh) && E.isHigh && (!F.isHigh)) {
   //--- Calculate drive 1
   double drive1 = A.price - B.price;
   if(drive1 > 0) {
      //--- Retrace A
      double retraceA = C.price - B.price;
      bool valid_retrA = false;
      double used_retrA = 0.0;
      for(int k=0; k<ArraySize(retr_levels); k++) {
         double ideal_retraceA = retr_levels[k] * drive1;
         if(MathAbs(retraceA - ideal_retraceA) <= Tolerance * drive1) {
            valid_retrA = true;
            used_retrA = retr_levels[k];
            break;
         }
      }
      if(valid_retrA) {
         //--- Drive 2
         double drive2 = C.price - D.price;
         bool valid_drive2 = false;
         double used_ext2 = 0.0;
         for(int k=0; k<ArraySize(ext_levels); k++) {
            double ideal_drive2 = ext_levels[k] * retraceA;
            if(MathAbs(drive2 - ideal_drive2) <= Tolerance * retraceA) {
               valid_drive2 = true;
               used_ext2 = ext_levels[k];
               break;
            }
         }
         if(valid_drive2) {
            //--- Retrace B
            double retraceB = E.price - D.price;
            bool valid_retrB = false;
            double used_retrB = 0.0;
            for(int k=0; k<ArraySize(retr_levels); k++) {
               double ideal_retraceB = retr_levels[k] * drive2;
               if(MathAbs(retraceB - ideal_retraceB) <= Tolerance * drive2) {
                  valid_retrB = true;
                  used_retrB = retr_levels[k];
                  break;
               }
            }
            if(valid_retrB) {
               //--- Drive 3
               double drive3 = E.price - F.price;
               bool valid_drive3 = false;
               for(int k=0; k<ArraySize(ext_levels); k++) {
                  double ideal_drive3 = ext_levels[k] * retraceB;
                  if(MathAbs(drive3 - ideal_drive3) <= Tolerance * retraceB) {
                     valid_drive3 = true;
                     used_ext = ext_levels[k];
                     break;
                  }
               }
               if(valid_drive3 && F.price < D.price && D.price < B.price) {
                  patternFound = true;
                  patternType = "Bullish";
               }
            }
         }
      }
   }
}
//--- Check for the low-high-low-high-low-high (Bearish reversal) structure
if((!A.isHigh) && B.isHigh && (!C.isHigh) && D.isHigh && (!E.isHigh) && F.isHigh) {
   //--- Calculate drive 1
   double drive1 = B.price - A.price;
   if(drive1 > 0) {
      //--- Retrace A
      double retraceA = B.price - C.price;
      bool valid_retrA = false;
      double used_retrA = 0.0;
      for(int k=0; k<ArraySize(retr_levels); k++) {
         double ideal_retraceA = retr_levels[k] * drive1;
         if(MathAbs(retraceA - ideal_retraceA) <= Tolerance * drive1) {
            valid_retrA = true;
            used_retrA = retr_levels[k];
            break;
         }
      }
      if(valid_retrA) {
         //--- Drive 2
         double drive2 = D.price - C.price;
         bool valid_drive2 = false;
         double used_ext2 = 0.0;
         for(int k=0; k<ArraySize(ext_levels); k++) {
            double ideal_drive2 = ext_levels[k] * retraceA;
            if(MathAbs(drive2 - ideal_drive2) <= Tolerance * retraceA) {
               valid_drive2 = true;
               used_ext2 = ext_levels[k];
               break;
            }
         }
         if(valid_drive2) {
            //--- Retrace B
            double retraceB = D.price - E.price;
            bool valid_retrB = false;
            double used_retrB = 0.0;
            for(int k=0; k<ArraySize(retr_levels); k++) {
               double ideal_retraceB = retr_levels[k] * drive2;
               if(MathAbs(retraceB - ideal_retraceB) <= Tolerance * drive2) {
                  valid_retrB = true;
                  used_retrB = retr_levels[k];
                  break;
               }
            }
            if(valid_retrB) {
               //--- Drive 3
               double drive3 = F.price - E.price;
               bool valid_drive3 = false;
               for(int k=0; k<ArraySize(ext_levels); k++) {
                  double ideal_drive3 = ext_levels[k] * retraceB;
                  if(MathAbs(drive3 - ideal_drive3) <= Tolerance * retraceB) {
                     valid_drive3 = true;
                     used_ext = ext_levels[k];
                     break;
                  }
               }
               if(valid_drive3 && F.price > D.price && D.price > B.price) {
                  patternFound = true;
                  patternType = "Bearish";
               }
            }
         }
      }
   }
}
まず、ArraySize(pivots)で得られるピボットの総数をpivotCountに格納し、ピボット数が6未満の場合は処理を終了し、g_patternFormationBarとg_lockedPatternAをそれぞれ-1と0にリセットします。これは、スリードライブパターンではA、B、C、D、E、Fの5点が必須であるためです。
次に、pivots配列から最後の6つのピボットを抽出し、最も古いものから順にA、B、C、D、E、Fを割り当てます。次に、強気パターン(A高値、B安値、C高値、D安値、E高値、F安値)の場合、ドライブ1(A.price - B.price)を計算し、リトレースメントA(C.price − B.priceがドライブ1の0.618または0.786にTolerance内で収まるか)を検証し、ドライブ2(C.price − D.priceがリトレースメントAの1.13、1.272、または1.618の範囲か)を計算し、リトレースメントB(E.price − D.priceがドライブ2の0.618または0.786に収まるか)を検証し、ドライブ3(E.price − F.priceがリトレースメントBの1.13、1.272、または1.618の範囲か)を計算し、「F.price < D.price < B.price」の条件を確認し、有効であればpatternFoundをtrueに設定し、patternTypeをBullishに設定し、使用したエクステンションをused_extとして保存します。弱気パターン(A安値、B高値、C安値、D高値、E安値、F高値)の場合も同様にドライブ1(B.price − A.price)、リトレースメントA、ドライブ2、リトレースメントB、ドライブ3を計算・検証し、「F.price > D.price > B.price」の条件を確認し、有効であればpatternFoundをtrueに設定し、patternTypeをBearishに設定します。 パターンが検出された場合、チャート上にそのパターンを可視化する処理を進めることができます。
//--- If a valid 3 Drives pattern is detected
if(patternFound) {
   //--- Print a message indicating the pattern type and detection time
   Print(patternType, " 3 Drives pattern detected at ", TimeToString(F.time, TIME_DATE|TIME_MINUTES|TIME_SECONDS));

   //--- Create a unique prefix for all graphical objects related to this pattern
   string signalPrefix = "3D_" + IntegerToString(A.time);

   //--- Choose triangle color based on the pattern type
   color triangleColor = (patternType=="Bullish") ? clrBlue : clrRed;

   //--- Draw the first triangle connecting pivots B, C, D
   DrawTriangle(signalPrefix+"_Triangle1", B.time, B.price, C.time, C.price, D.time, D.price,
                triangleColor, 2, true, true);
   //--- Draw the second triangle connecting pivots D, E, F
   DrawTriangle(signalPrefix+"_Triangle2", D.time, D.price, E.time, E.price, F.time, F.price,
                triangleColor, 2, true, true);
}
ここで、チャート上で検出されたパターンの可視化を開始します。有効なパターンが検出された場合(patternFoundがtrue)、Printを用いて検出をログに記録し、patternType(BullishまたはBearish)と、TimeToStringによって日付、分、秒形式で整形されたFピボットの時間を出力します。次に、チャートオブジェクトに対して重複しない名前を付けるために、A.timeをIntegerToStringで文字列に変換し、「3D_」と連結してユニークな識別子signalPrefixを作成します。
次に、triangleColorを、強気パターンの場合は青、弱気パターンの場合は赤に設定して、視覚的に区別します。最後に、パターンを可視化するためにDrawTriangleを2回呼び出します。最初はピボットB、C、Dを結ぶ三角形BCDを、次にピボットD、E、Fを結ぶ三角形DEFを描画し、signalPrefixに「_Triangle1」と「_Triangle2」を付加したID、各ピボットの時間と価格、triangleColor、幅2、塗りつぶしと背景表示のtrueフラグを指定します。次のような結果が得られます。

画像から、検出されたパターンを正しくマッピングおよび可視化できていることが確認できます。次に、トレンドラインを引き続きマッピングしてパターンを境界内で完全に可視化し、レベルをよりわかりやすく識別できるようにラベルを追加する必要があります。
//--- Draw boundary trend lines connecting the pivots for clarity
DrawTrendLine(signalPrefix+"_TL_AB", A.time, A.price, B.time, B.price, clrBlack, 2, STYLE_SOLID);
DrawTrendLine(signalPrefix+"_TL_BC", B.time, B.price, C.time, C.price, clrBlack, 2, STYLE_SOLID);
DrawTrendLine(signalPrefix+"_TL_CD", C.time, C.price, D.time, D.price, clrBlack, 2, STYLE_SOLID);
DrawTrendLine(signalPrefix+"_TL_DE", D.time, D.price, E.time, E.price, clrBlack, 2, STYLE_SOLID);
DrawTrendLine(signalPrefix+"_TL_EF", E.time, E.price, F.time, F.price, clrBlack, 2, STYLE_SOLID);

//--- Retrieve the symbol's point size to calculate offsets for text positioning
double point = SymbolInfoDouble(_Symbol, SYMBOL_POINT);
//--- Calculate an offset (15 points) for positioning text above or below pivots
double offset = 15 * point;

//--- Determine the Y coordinate for each pivot label based on its type
double textY_A = (A.isHigh ? A.price + offset : A.price - offset);
double textY_B = (B.isHigh ? B.price + offset : B.price - offset);
double textY_C = (C.isHigh ? C.price + offset : C.price - offset);
double textY_D = (D.isHigh ? D.price + offset : D.price - offset);
double textY_E = (E.isHigh ? E.price + offset : E.price - offset);
double textY_F = (F.isHigh ? F.price + offset : F.price - offset);

//--- Draw text labels for each pivot with appropriate anchoring
DrawTextEx(signalPrefix+"_Text_A", "A", A.time, textY_A, clrBlack, 11, A.isHigh);
DrawTextEx(signalPrefix+"_Text_B", "B", B.time, textY_B, clrBlack, 11, B.isHigh);
DrawTextEx(signalPrefix+"_Text_C", "C", C.time, textY_C, clrBlack, 11, C.isHigh);
DrawTextEx(signalPrefix+"_Text_D", "D", D.time, textY_D, clrBlack, 11, D.isHigh);
DrawTextEx(signalPrefix+"_Text_E", "E", E.time, textY_E, clrBlack, 11, E.isHigh);
DrawTextEx(signalPrefix+"_Text_F", "F", F.time, textY_F, clrBlack, 11, F.isHigh);

//--- Calculate the central label's time as the midpoint between pivots A and D
datetime centralTime = (A.time + D.time) / 2;
//--- Set the central label's price at pivot F's price
double centralPrice = F.price;
//--- Create the central text label indicating the pattern type
if(ObjectCreate(0, signalPrefix+"_Text_Center", OBJ_TEXT, 0, centralTime, centralPrice)) {
   ObjectSetString(0, signalPrefix+"_Text_Center", OBJPROP_TEXT,
      (patternType=="Bullish") ? "Bullish 3 Drives" : "Bearish 3 Drives");
   ObjectSetInteger(0, signalPrefix+"_Text_Center", OBJPROP_COLOR, clrBlack);
   ObjectSetInteger(0, signalPrefix+"_Text_Center", OBJPROP_FONTSIZE, 11);
   ObjectSetString(0, signalPrefix+"_Text_Center", OBJPROP_FONT, "Arial Bold");
   ObjectSetInteger(0, signalPrefix+"_Text_Center", OBJPROP_ALIGN, ALIGN_CENTER);
}
検出されたパターンの可視化をさらに強化するため、パターン構造を明確に示す詳細なチャートオブジェクトを追加します。まず、主要なピボット点を結ぶために、固有のsignalPrefixを付けたDrawTrendLineを使用して5本の実線トレンドラインを描画します。AB、BC、CD、DE、EFの各ラインは、それぞれのピボット時間と価格(例:A.time、A.price)を使用し、OBJPROP_COLORをclrBlack、OBJPROP_WIDTHを2、OBJPROP_STYLEをSTYLE_SOLIDに設定し、ObjectSetIntegerでパターンの各レッグを明確にします。次に、SymbolInfoDouble(_Symbol, SYMBOL_POINT)でシンボルの点サイズを取得し、ラベル配置のために15点のオフセットを計算し、各ピボットがスイングハイ(isHighがtrue)かスイングローかに応じてオフセットを加減してtextY_A、textY_B、textY_C、textY_D、textY_E、textY_Fを決定し、高値の上、安値の下にラベルを配置します。
続いて、DrawTextExを使ってピボットX、A、B、C、D、E、Fのテキストラベルを作成します。signalPrefixに「_Text_A」などの接尾辞を付け、それぞれの文字を表示し、ピボット時間と調整済みのY座標に配置し、clrBlack、フォントサイズ11、ピボットのisHigh値をアンカーとして設定します。最後に、中央ラベルの位置をA.timeとD.timeの中点としてcentralTimeに、価格位置をF.priceとしてcentralPriceに設定し、ObjectCreateで「signalPrefix + _Text_Center」という名前のテキストオブジェクトを生成し、OBJPROP_TEXTをpatternTypeに応じて「Bullish 3 Drives」または「Bearish 3 Drives」に設定し、ObjectSetStringとObjectSetIntegerでOBJPROP_COLORをclrBlack、OBJPROP_FONTSIZEを11、OBJPROP_FONTをArial Bold、OBJPROP_ALIGNをALIGN_CENTERに設定します。このロジックにより、スリードライブパターンの構造と種類がチャート上に包括的に表示されます。 プログラムを実行すると、次のような表示が得られます。

画像から、パターンにエッジ(トレンドライン)とラベルを追加したことで、より明確かつ視覚的に把握しやすくなったことが分かります。次におこなうべきことは、このパターンに基づいてトレードレベルを決定することです。
//--- Define start and end times for drawing horizontal dotted lines for trade levels
datetime lineStart = F.time;
datetime lineEnd = F.time + PeriodSeconds(_Period)*2;

//--- Declare variables for entry price and take profit levels
double entryPriceLevel, TP1Level, TP2Level, TP3Level;
//--- Calculate pattern range (drive 3 length)
double patternRange = (patternType=="Bullish") ? (E.price - F.price) : (F.price - E.price);
//--- Calculate trade levels based on whether the pattern is Bullish or Bearish
if(patternType=="Bullish") { //--- Bullish → BUY signal
   //--- Set entry at the pattern tip (F price)
   entryPriceLevel = F.price;
   //--- Set TP3 at pivot E's price
   TP3Level = E.price;
   //--- Set TP1 at 0.382 fib retrace from F to E
   TP1Level = F.price + 0.382 * patternRange;
   //--- Set TP2 at 0.618 fib retrace from F to E
   TP2Level = F.price + 0.618 * patternRange;
} else { //--- Bearish → SELL signal
   //--- Set entry at the pattern tip (F price)
   entryPriceLevel = F.price;
   //--- Set TP3 at pivot E's price
   TP3Level = E.price;
   //--- Set TP1 at 0.382 fib retrace from F to E
   TP1Level = F.price - 0.382 * patternRange;
   //--- Set TP2 at 0.618 fib retrace from F to E
   TP2Level = F.price - 0.618 * patternRange;
}

//--- Draw dotted horizontal lines to represent the entry and TP levels
DrawDottedLine(signalPrefix+"_EntryLine", lineStart, entryPriceLevel, lineEnd, clrMagenta);
DrawDottedLine(signalPrefix+"_TP1Line", lineStart, TP1Level, lineEnd, clrForestGreen);
DrawDottedLine(signalPrefix+"_TP2Line", lineStart, TP2Level, lineEnd, clrGreen);
DrawDottedLine(signalPrefix+"_TP3Line", lineStart, TP3Level, lineEnd, clrDarkGreen);

//--- Define a label time coordinate positioned just to the right of the dotted lines
datetime labelTime = lineEnd + PeriodSeconds(_Period)/2;

//--- Construct the entry label text with the price
string entryLabel = (patternType=="Bullish") ? "BUY (" : "SELL (";
entryLabel += DoubleToString(entryPriceLevel, _Digits) + ")";
//--- Draw the entry label on the chart
DrawTextEx(signalPrefix+"_EntryLabel", entryLabel, labelTime, entryPriceLevel, clrMagenta, 11, true);

//--- Construct and draw the TP1 label
string tp1Label = "TP1 (" + DoubleToString(TP1Level, _Digits) + ")";
DrawTextEx(signalPrefix+"_TP1Label", tp1Label, labelTime, TP1Level, clrForestGreen, 11, true);

//--- Construct and draw the TP2 label
string tp2Label = "TP2 (" + DoubleToString(TP2Level, _Digits) + ")";
DrawTextEx(signalPrefix+"_TP2Label", tp2Label, labelTime, TP2Level, clrGreen, 11, true);

//--- Construct and draw the TP3 label
string tp3Label = "TP3 (" + DoubleToString(TP3Level, _Digits) + ")";
DrawTextEx(signalPrefix+"_TP3Label", tp3Label, labelTime, TP3Level, clrDarkGreen, 11, true);
検出されたパターンの取引レベルを定義して可視化するために、lineStartをピボットFの時間(F.time)に設定し、「PeriodSeconds(_Period) * 2」を用いてlineEndを2期間先に設定します。取引計算用の変数としてentryPriceLevel、TP1Level、TP2Level、TP3Levelを宣言します。次に、patternRangeをドライブ3の長さとして計算します(強気の場合はE.price − F.price、弱気の場合はF.price − E.price)。強気パターンでは、entryPriceLevelをF.priceに設定し、TP3LevelをE.price、TP1Levelを「F.price + 0.382 * patternRange」、TP2Levelを「F.price + 0.618 * patternRange」に設定します。弱気パターンでは、entryPriceLevelをF.priceに設定し、TP3LevelをE.price、TP1Levelを「F.price − 0.382 * patternRange」、TP2Levelを「F.price − 0.618 * patternRange」に設定します。
次に、DrawDottedLineを使用して4本の点線水平線を描画します。マゼンタ色でentryPriceLevelのエントリーレベル線、TP1Levelをフォレストグリーン、TP2Levelをグリーン、TP3LevelをダークグリーンでTPラインとして、lineStartからlineEndまで描画します。最後に、labelTimeをlineEndに半期間を加えた値に設定し、DoubleToStringで価格をフォーマットしてラベルテキストを作成します(例:エントリーではBUY(price)またはSELL(price)、TP1はTP1(price)など)。DrawTextExを使用してこれらのラベルをlabelTimeに描画し、対応する色、フォントサイズ11、価格レベルの上にアンカー設定します。コンパイルすると、次の結果が得られます。
弱気パターン

強気パターン

画像から、エントリーレベルが正しく表示されていることが確認できます。次に必要なのは実際にエントリーすることだけです。
//--- Retrieve the index of the current bar
int currentBarIndex = Bars(_Symbol, _Period) - 1;
//--- If no pattern has been previously locked, lock the current pattern formation
if(g_patternFormationBar == -1) {
   g_patternFormationBar = currentBarIndex;
   g_lockedPatternA = A.time;
   //--- Print a message that the pattern is detected and waiting for confirmation
   Print("Pattern detected on bar ", currentBarIndex, ". Waiting for confirmation on next bar.");
   return;
}
//--- If still on the same formation bar, the pattern is considered to be repainting
if(currentBarIndex == g_patternFormationBar) {
   Print("Pattern is repainting; still on locked formation bar ", currentBarIndex, ". No trade yet.");
   return;
}
//--- If we are on a new bar compared to the locked formation
if(currentBarIndex > g_patternFormationBar) {
   //--- Check if the locked pattern still corresponds to the same A pivot
   if(g_lockedPatternA == A.time) {
      Print("Confirmed pattern (locked on bar ", g_patternFormationBar, "). Opening trade on bar ", currentBarIndex, ".");
      //--- Update the pattern formation bar to the current bar
      g_patternFormationBar = currentBarIndex;
      //--- Only proceed with trading if allowed and if there is no existing position
      if(AllowTrading && !PositionSelect(_Symbol)) {
         //--- Check if this pattern has already been traded
         bool alreadyTraded = false;
         for(int k = 0; k < ArraySize(tradedPatterns); k++) {
            if(tradedPatterns[k] == A.time) {
               alreadyTraded = true;
               break;
            }
         }
         if(alreadyTraded) {
            Print("This pattern has already been traded. No new trade executed.");
            return;
         }
         double entryPriceTrade = 0, stopLoss = 0, takeProfit = 0;
         point = SymbolInfoDouble(_Symbol, SYMBOL_POINT);
         bool tradeResult = false;
         //--- Select TP level based on user input
         switch(TakeProfitLevel) {
            case TP1:
               takeProfit = TP1Level;
               break;
            case TP2:
               takeProfit = TP2Level;
               break;
            case TP3:
               takeProfit = TP3Level;
               break;
            default:
               takeProfit = TP2Level; // Fallback to TP2
         }
         //--- Calculate SL based on user-selected method
         if(patternType=="Bullish") { //--- BUY signal
            entryPriceTrade = SymbolInfoDouble(_Symbol, SYMBOL_ASK);
            if(StopLossType == SL_FIBO) {
               double third_drive = E.price - F.price;
               stopLoss = F.price - (SL_FiboExtension - 1.0) * third_drive;
            } else { // SL_FIXED
               stopLoss = entryPriceTrade - SL_FixedPoints * point;
            }
            // Ensure SL is below entry for BUY
            if(stopLoss >= entryPriceTrade) {
               stopLoss = entryPriceTrade - 10 * point;
            }
            tradeResult = obj_Trade.Buy(LotSize, _Symbol, entryPriceTrade, stopLoss, takeProfit, "3 Drives Signal");
            if(tradeResult)
               Print("Buy order opened successfully.");
            else
               Print("Buy order failed: ", obj_Trade.ResultRetcodeDescription());
         }
         //--- For a Bearish pattern, execute a SELL trade
         else if(patternType=="Bearish") { //--- SELL signal
            entryPriceTrade = SymbolInfoDouble(_Symbol, SYMBOL_BID);
            if(StopLossType == SL_FIBO) {
               double third_drive = F.price - E.price;
               stopLoss = F.price + (SL_FiboExtension - 1.0) * third_drive;
            } else { // SL_FIXED
               stopLoss = entryPriceTrade + SL_FixedPoints * point;
            }
            // Ensure SL is above entry for SELL
            if(stopLoss <= entryPriceTrade) {
               stopLoss = entryPriceTrade + 10 * point;
            }
            tradeResult = obj_Trade.Sell(LotSize, _Symbol, entryPriceTrade, stopLoss, takeProfit, "3 Drives Signal");
            if(tradeResult)
               Print("Sell order opened successfully.");
            else
               Print("Sell order failed: ", obj_Trade.ResultRetcodeDescription());
         }
         //--- If trade was successful, mark the pattern as traded
         if(tradeResult) {
            int size = ArraySize(tradedPatterns);
            ArrayResize(tradedPatterns, size + 1);
            tradedPatterns[size] = A.time;
         }
      }
      else {
         //--- If a position is already open, do not execute a new trade
         Print("A position is already open for ", _Symbol, ". No new trade executed.");
      }
   }
   else {
      //--- If the pattern has changed, update the lock with the new formation bar and A pivot
      g_patternFormationBar = currentBarIndex;
      g_lockedPatternA = A.time;
      Print("Pattern has changed; updating lock on bar ", currentBarIndex, ". Waiting for confirmation.");
      return;
   }
}
else {
   //--- If no valid 3 Drives pattern is detected, reset the pattern lock variables
   g_patternFormationBar = -1;
   g_lockedPatternA = 0;
}
検出されたパターンの取引実行とパターン確認を管理することで実装を完了します。まず、「Bars(_Symbol, _Period) - 1」で現在のバーのインデックスを取得し、currentBarIndexに格納します。次に、パターンがロックされていない場合(g_patternFormationBar == -1)、g_patternFormationBarをcurrentBarIndexに設定し、g_lockedPatternAにA.timeを格納してAピボットの時間をロックします。Printでパターン検出をログに記録し、確認待ちであることを示して処理を終了します。
次に、まだフォーメーションバー上にある場合(currentBarIndex == g_patternFormationBar)、再描画をログに記録して終了し、早すぎる取引を防ぎます。最後に、新しいバーが形成された場合(currentBarIndex > g_patternFormationBar)かつAピボットがg_lockedPatternAと一致する場合、パターンを確定し、ログを記録し、g_patternFormationBarを更新します。その後、AllowTradingがtrueであり、PositionSelect関数で未決済ポジションがないことを確認し、tradedPatternsをチェックしてパターンが未取引であることを確認します。次に、TakeProfitLevelに応じてTP1Level、TP2Level、TP3Levelのいずれかを選択し、ストップロスをSL_FIBOの場合は「F.price ± (SL_FiboExtension − 1.0) * third_drive」、SL_FIXEDの場合は「entryPriceTrade ± SL_FixedPoints * point」で計算し、有効なストップロスであることを確認します。その後、LotSizeと「3 Drives Signal」を指定してobj_Trade.Buyまたはobj_Trade.Sellで売買を実行し、成功または失敗をログに記録し、tradedPatternsにパターンを取引済みとしてマークします。取引が許可されていない場合、ポジションが存在する場合、またはパターンがすでに取引済みの場合は取引せずにログを記録します。パターンが変化した場合はロックを更新して待機し、パターンが見つからない場合はグローバル変数をリセットします。コンパイルすると、次の結果が得られます。
弱気シグナル

強気シグナル

画像から、ハーモニックパターンを正しくプロットできており、パターンが確定した後にそれに応じてエントリーできていることが確認できます。これにより、パターンの識別、描画、取引という目的を達成できています。残っている作業は、このプログラムのバックテストをおこなうことです。バックテストについては次のセクションで扱います。
バックテスト
徹底的なバックテストによって、次の結果が得られました。
バックテストグラフ

バックテストレポート

結論
MQL5でスリードライブパターンシステムを開発しました。価格の動きを活用して強気と弱気のスリードライブハーモニックパターンを、正確なフィボナッチリトレースメントとフィボナッチエクステンションで検出し、カスタマイズ可能なエントリー、SL、複数レベルのTPポイントを使用した取引を自動化し、三角形やトレンドラインといったチャートオブジェクトでパターンを可視化しました。
免責条項:本記事は教育目的のみを意図したものです。取引には重大な財務リスクが伴い、市場の変動によって損失が生じる可能性があります。本プログラムを実際の市場で運用する前に、十分なバックテストと慎重なリスク管理が不可欠です。
提示された概念と実装を活用することで、このスリードライブパターンシステムを自分の取引スタイルに適応させ、アルゴリズム戦略を強化できます。取引をお楽しみください。
MetaQuotes Ltdにより英語から翻訳されました。
元の記事: https://www.mql5.com/en/articles/19449
警告: これらの資料についてのすべての権利はMetaQuotes Ltd.が保有しています。これらの資料の全部または一部の複製や再プリントは禁じられています。
この記事はサイトのユーザーによって執筆されたものであり、著者の個人的な見解を反映しています。MetaQuotes Ltdは、提示された情報の正確性や、記載されているソリューション、戦略、または推奨事項の使用によって生じたいかなる結果についても責任を負いません。

- 無料取引アプリ
- 8千を超えるシグナルをコピー
- 金融ニュースで金融マーケットを探索
EAがグラフに表示されないのはなぜですか?また、EAを使用するための最適化数値と最低取引金額はいくらですか?
こんにちは。最適化タブで最適化できます。