Dashboard Trend Bar Smart Level 9TF Double CCI
- 지표
-
Anon Candra N
 I am a professional trader who has been in the stock market for several years. After making in-depth observations of the stock market, I developed the trading tools that have helped my trading career so far. The good news is, you can have these trading tools on this website.
 - 버전: 1.0
- 활성화: 15
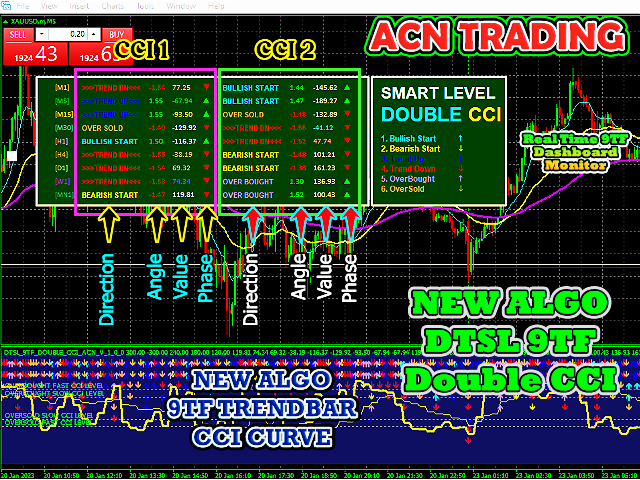
정확한 CCI 지표를 사용할 수 있습니다.
대시보드 트렌드 바 스마트 레벨 9TF Double CCI.
이중 CCI, 즉 빠른 CCI 및 느린 CCI
두 번째 CCI가 필요한 이유는 무엇입니까? 추가 지표를 사용하면 라이브 거래에서 더 많은 확신을 얻을 수 있습니다.
9TF 빠른 CCI 곡선
9TF 느린 CCI 곡선
9TF 실시간 CCI 각도
9TF 실시간 CCI 값
9TF 실시간 CCI 방향/위상
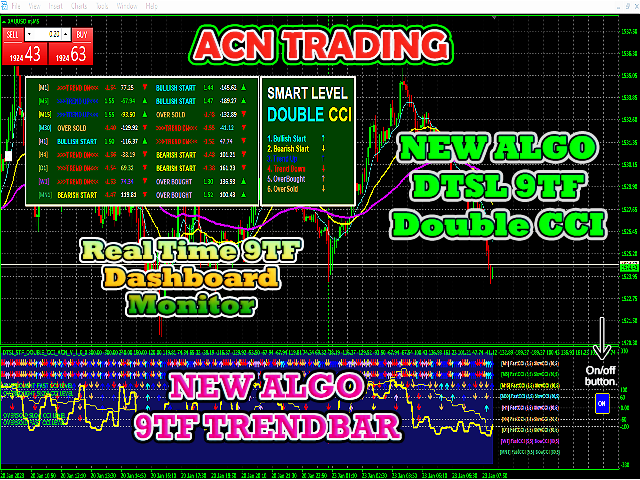
9TF 트렌드 바
추세 막대 계산의 새로운 알고리즘
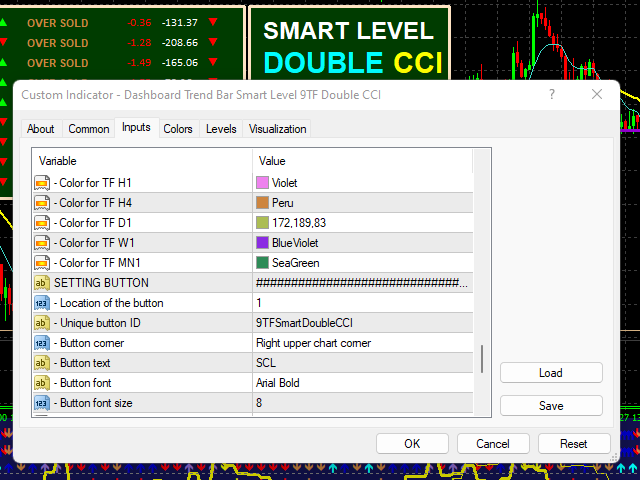
켜기/끄기 버튼. 한 번의 클릭으로 표시기를 표시하거나 숨길 때 매우 유용합니다.
실시간 9TF 대시보드 모니터
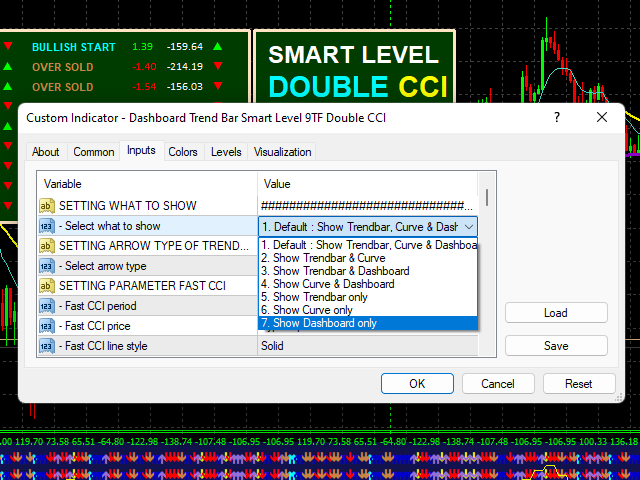
추세 막대만 표시하는 기능
CCI 곡선만 표시하는 기능
대시보드만 표시하는 기능
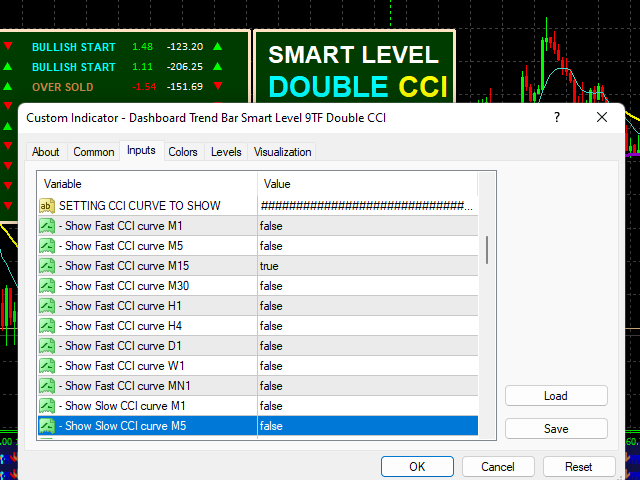
표시할 CCI 곡선을 선택하는 기능
추세의 화살표 유형 선택 기능
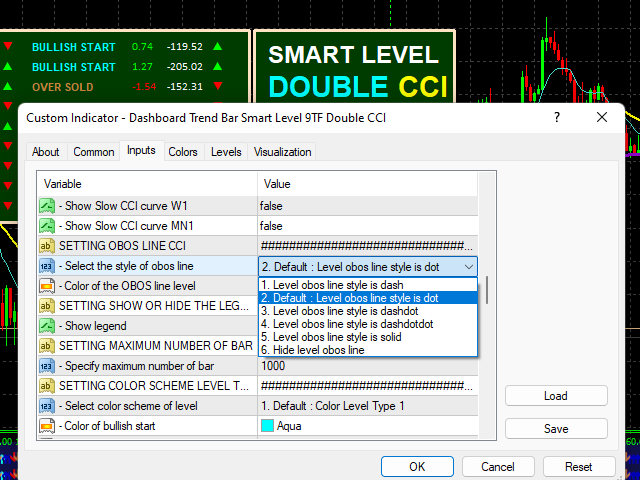
obos 선 스타일을 선택하는 기능
범례 표시/숨기기 기능
막대 수를 늘리거나 줄이는 기능
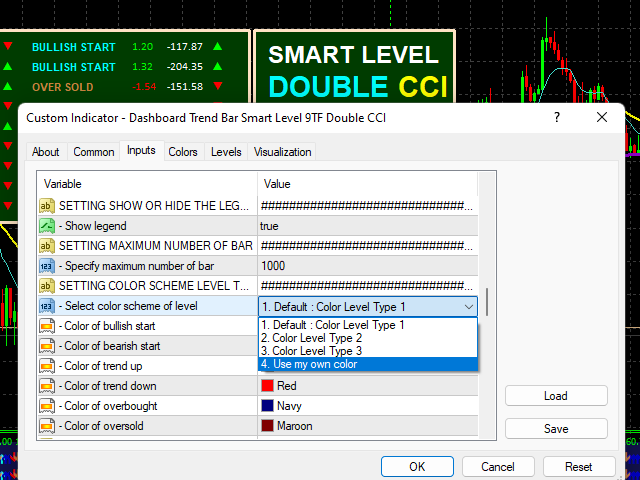
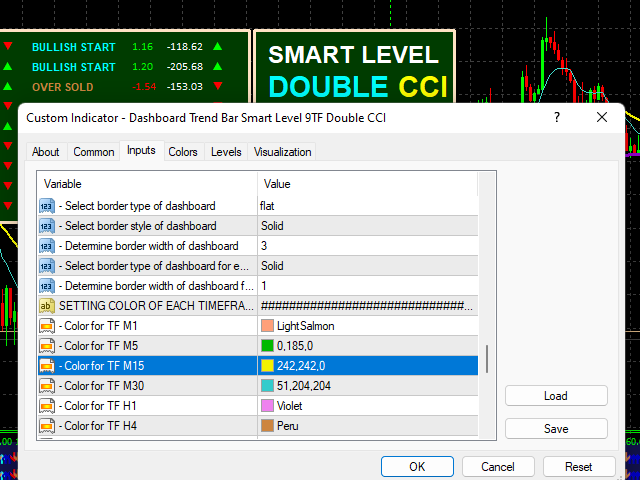
색 구성표 수준을 선택하는 기능
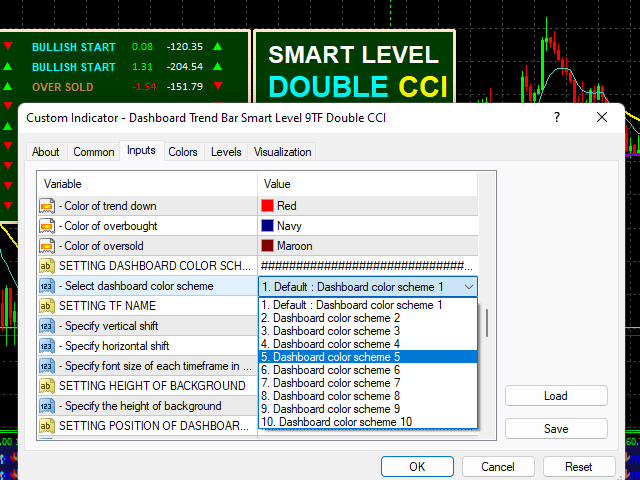
최대 10개의 대시보드 추세 막대 색 구성표를 선택하는 기능
CCI 곡선의 색상을 변경하는 기능
이 지표는 일련의 시험을 거쳤습니다. 프로그래밍 코드는 세심한 주의를 기울여 작성되었습니다.
최고의 DTSL 9TF Double CCI 거래 지표로 자신 있게 입력하세요.
지금 구매하고 프로처럼 거래하십시오.
고맙습니다.