Dashboard Trend Bar Smart Level 9TF Double CCI
- インディケータ
- バージョン: 1.0
- アクティベーション: 15

正確な CCI インジケータが利用可能です。
ダッシュボード トレンド バー スマート レベル 9TF ダブル CCI。
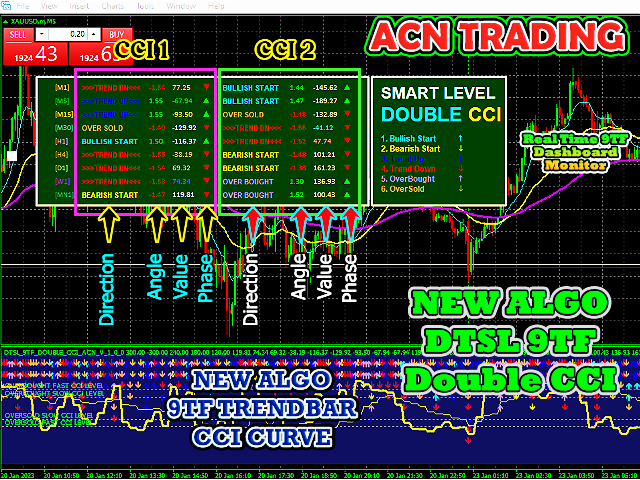
Double CCI、つまり Fast CCI と Slow CCI
2 番目の CCI が必要な理由 追加のインジケーターを使用すると、ライブ取引でより説得力が増します
9TF ファスト CCI カーブ
9TF スロー CCI カーブ
9TF リアルタイム CCI 角度
9TF リアルタイム CCI 値
9TF リアルタイム CCI 方向/位相
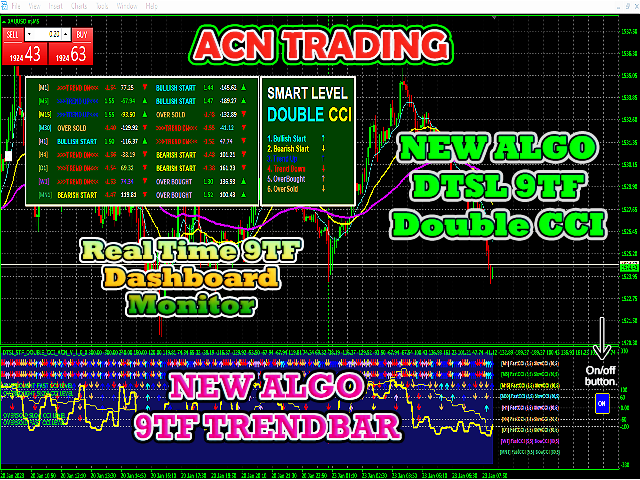
9TF トレンドバー
トレンドバーを計算する新しいアルゴリズム
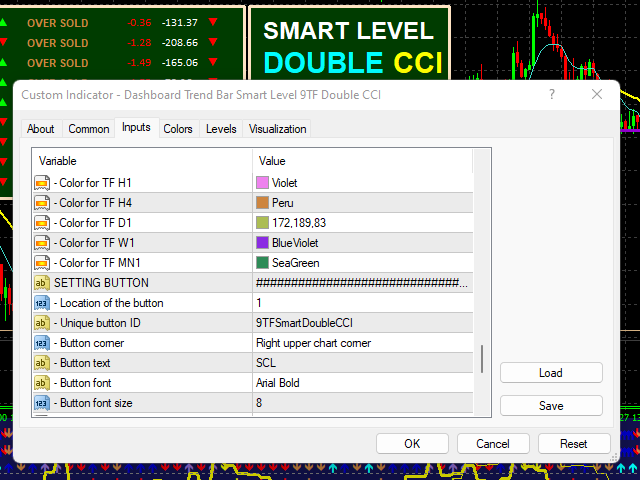
オン/オフボタン。 ワンクリックでインジケータを表示/非表示にするのに非常に便利
リアルタイム 9TF ダッシュボード モニター
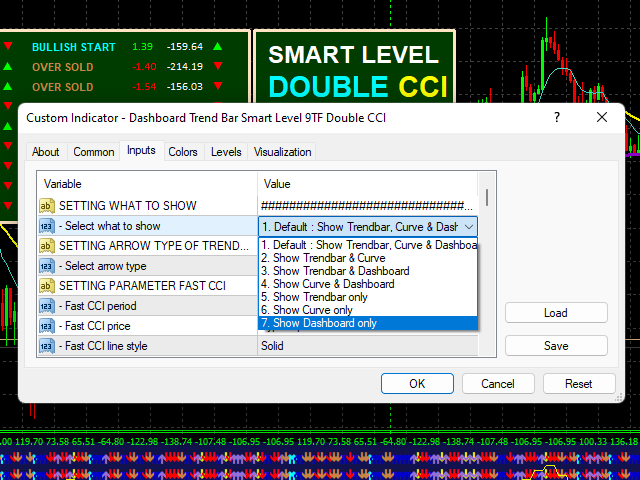
トレンドバーのみ表示可能
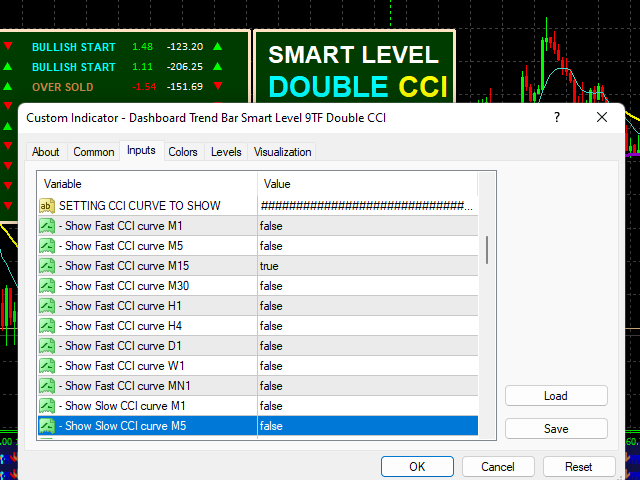
CCI 曲線のみを表示する機能
ダッシュボードのみを表示する機能
表示する CCI 曲線を選択する機能
トレンドの矢印タイプを選択可能
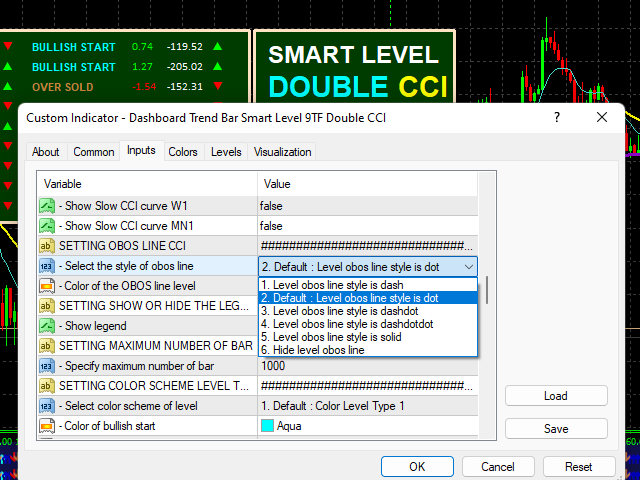
obos ライン スタイルを選択する機能
凡例を表示/非表示にする機能
小節の数を増減する機能
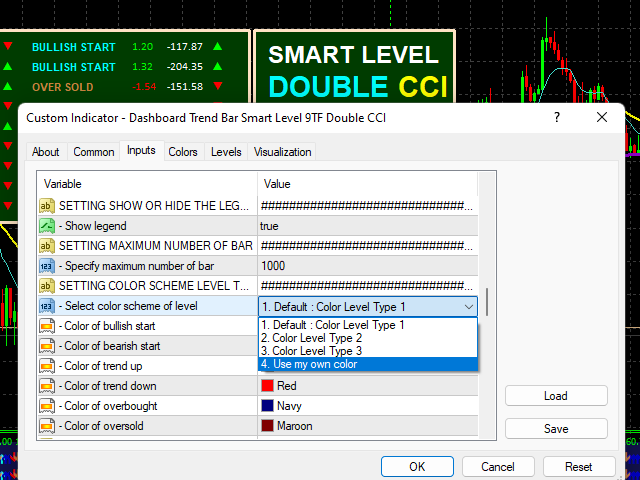
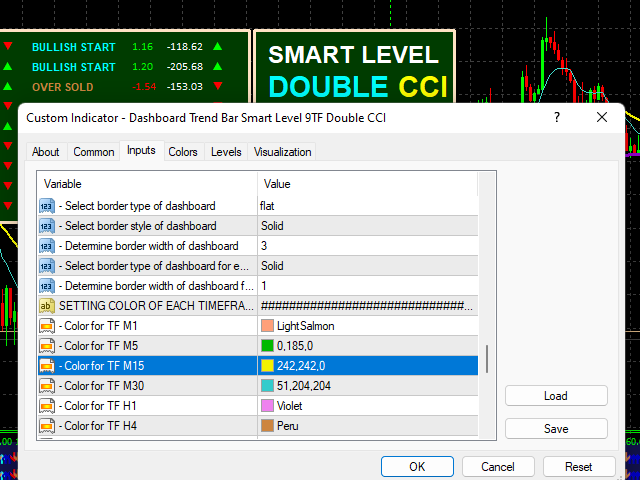
配色レベルを選択する機能
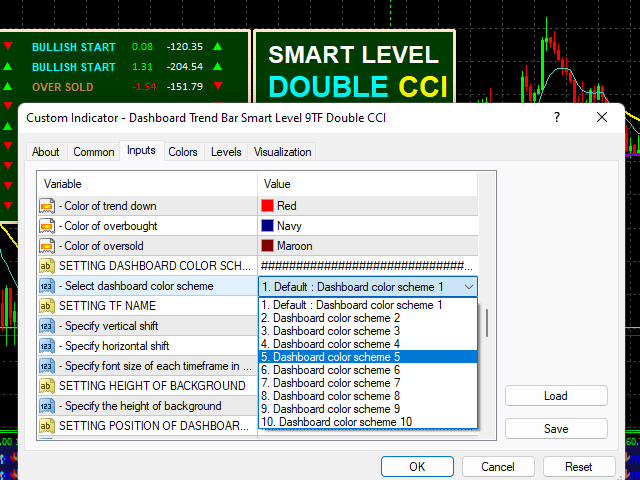
最大 10 個のダッシュボード トレンド バーの配色を選択する機能
CCI 曲線の色を変更する機能
この指標は、一連の試行を経てきました。 プログラミングコードは細心の注意を払って書かれています。
最高の DTSL 9TF Double CCI 取引インジケーターで自信を持ってエントリーしましょう。
今すぐプロのように取引しましょう。
ありがとう。