Dashboard Trend Bar Smart Level 9TF Double CCI
- Indicatori
-
Anon Candra N
 I am a professional trader who has been in the stock market for several years. After making in-depth observations of the stock market, I developed the trading tools that have helped my trading career so far. The good news is, you can have these trading tools on this website.
 - Versione: 1.0
- Attivazioni: 15
È disponibile un accurato indicatore CCI.
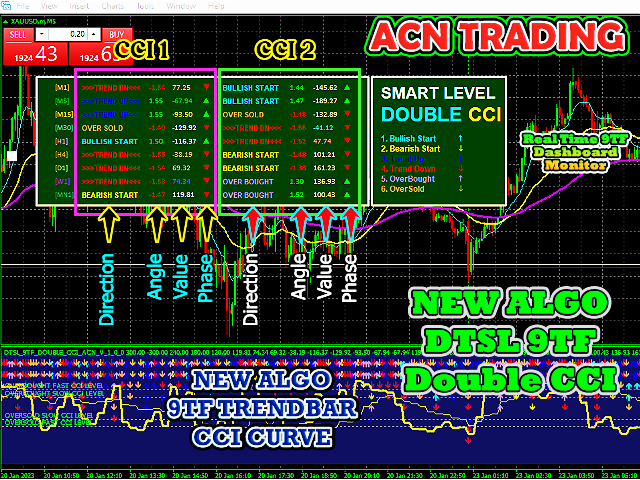
Cruscotto Trend Bar Smart Level 9TF Doppio CCI.
Doppio CCI, ovvero CCI veloce e CCI lento
Perché hai bisogno di un secondo CCI? L'utilizzo di indicatori aggiuntivi ci convincerà di più nel trading dal vivo
9TF Curva CCI veloce
9TF Curva CCI lenta
Angolo CCI in tempo reale 9TF
Valore CCI in tempo reale 9TF
Direzione/fase CCI in tempo reale 9TF
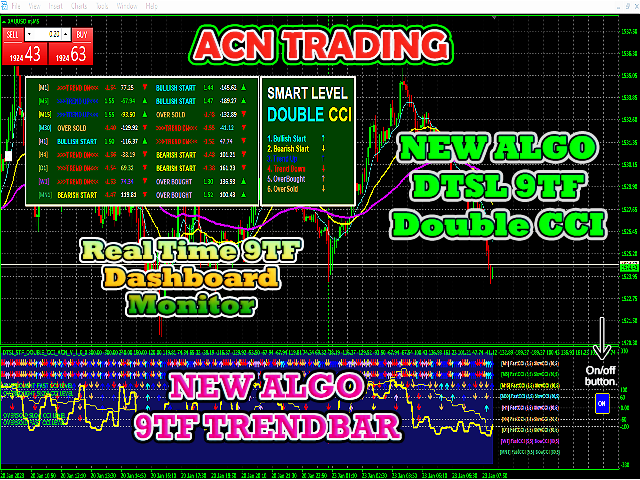
Barra di tendenza 9TF
Nuovo algoritmo per il calcolo della barra dei trend
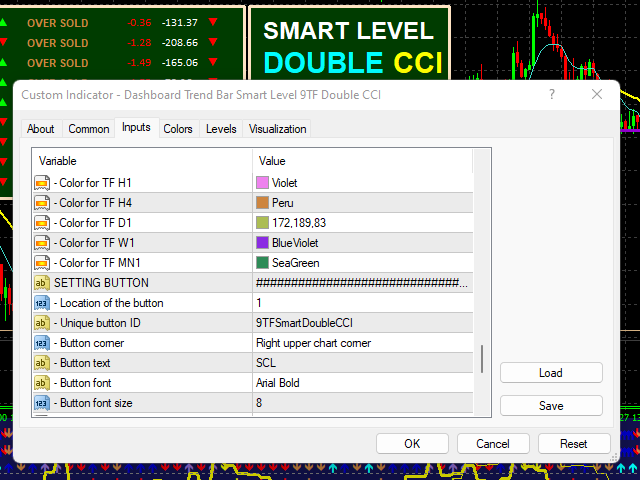
Pulsante di accensione/spegnimento. Molto utile per mostrare/nascondere l'indicatore con un solo clic
Monitor cruscotto 9TF in tempo reale
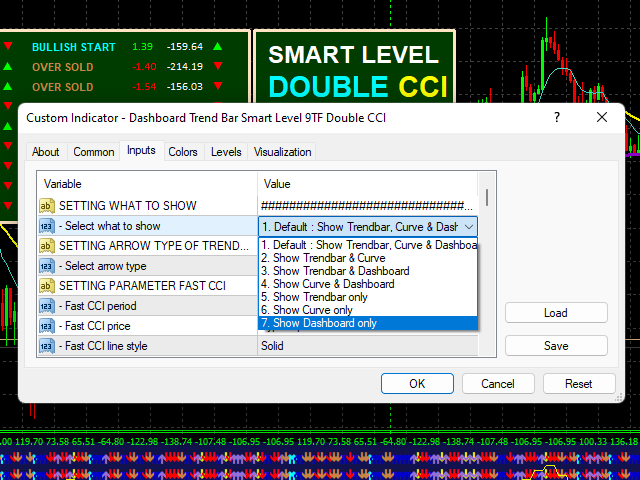
Possibilità di mostrare solo la barra di tendenza
Possibilità di mostrare solo la curva CCI
Possibilità di mostrare solo dashboard
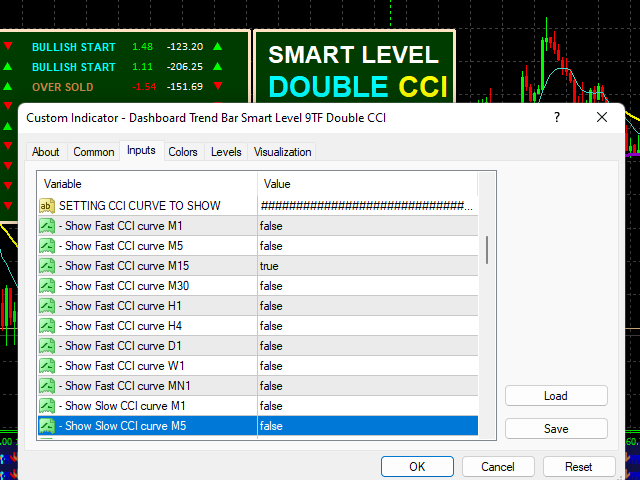
Possibilità di selezionare quale curva CCI mostrare
Possibilità di selezionare il tipo di tendenza della freccia
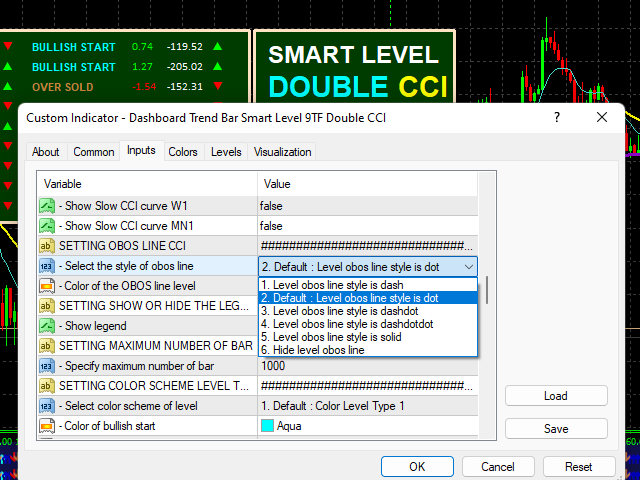
Possibilità di selezionare lo stile della linea obos
Possibilità di mostrare/nascondere la legenda
Possibilità di aumentare/diminuire il numero di barre
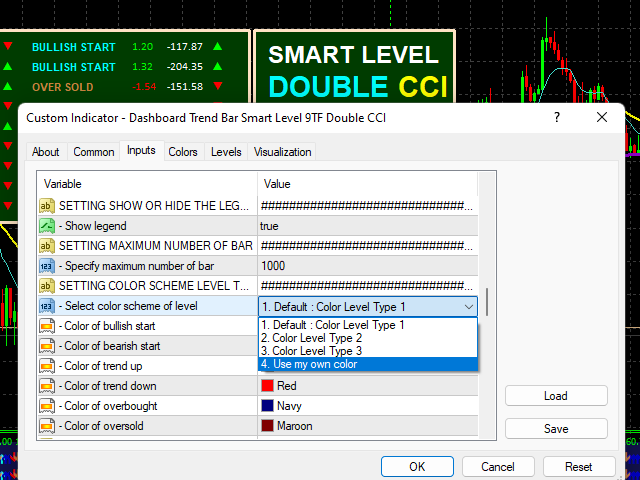
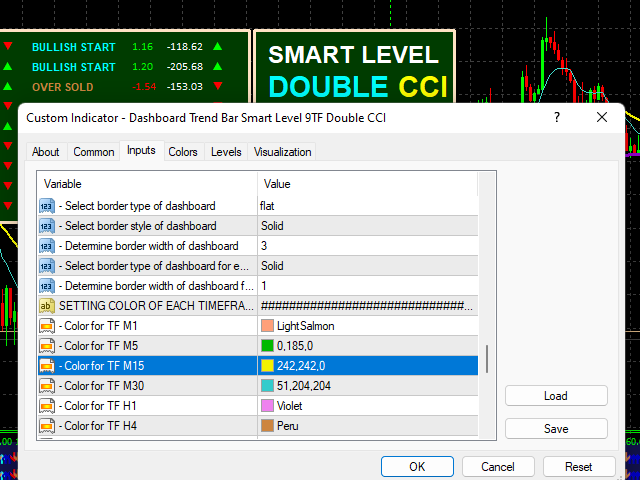
Possibilità di selezionare il livello della combinazione di colori
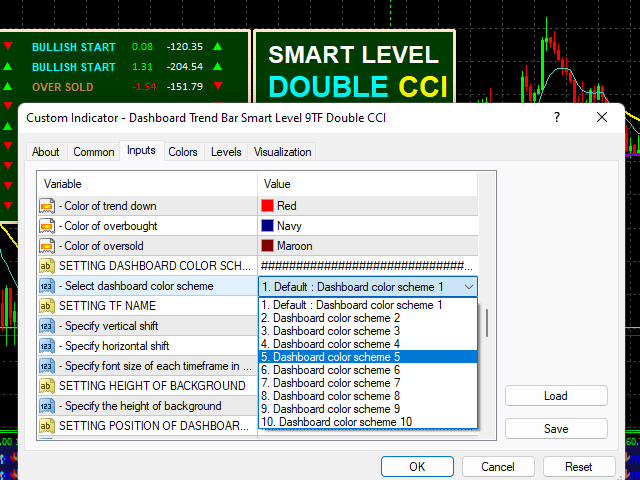
Possibilità di selezionare fino a 10 combinazioni di colori della barra di tendenza del dashboard
Possibilità di cambiare il colore della curva CCI
Questo indicatore ha attraversato una serie di prove. I codici di programmazione sono stati scritti con grande cura.
Entra in sicurezza con il miglior indicatore di trading DTSL 9TF Double CCI.
Acquista ora e fai trading come un professionista.
Grazie.