Boom and Crash Spike Detector Indicator for MT4
- Indicators
-
STE S.S.COMPANY
 Hello,
my name is Ashraf a fintech Software Engineer.
I create amazing forex indicators and expert advisors for Metatrader 4 and Metatrader 5, the best trading platforms.
Use my service and let me build your trading strategies ( Indicator coding or EA coding ) by click on bellow link - Version: 1.2
- Updated: 29 October 2022
- Activations: 10
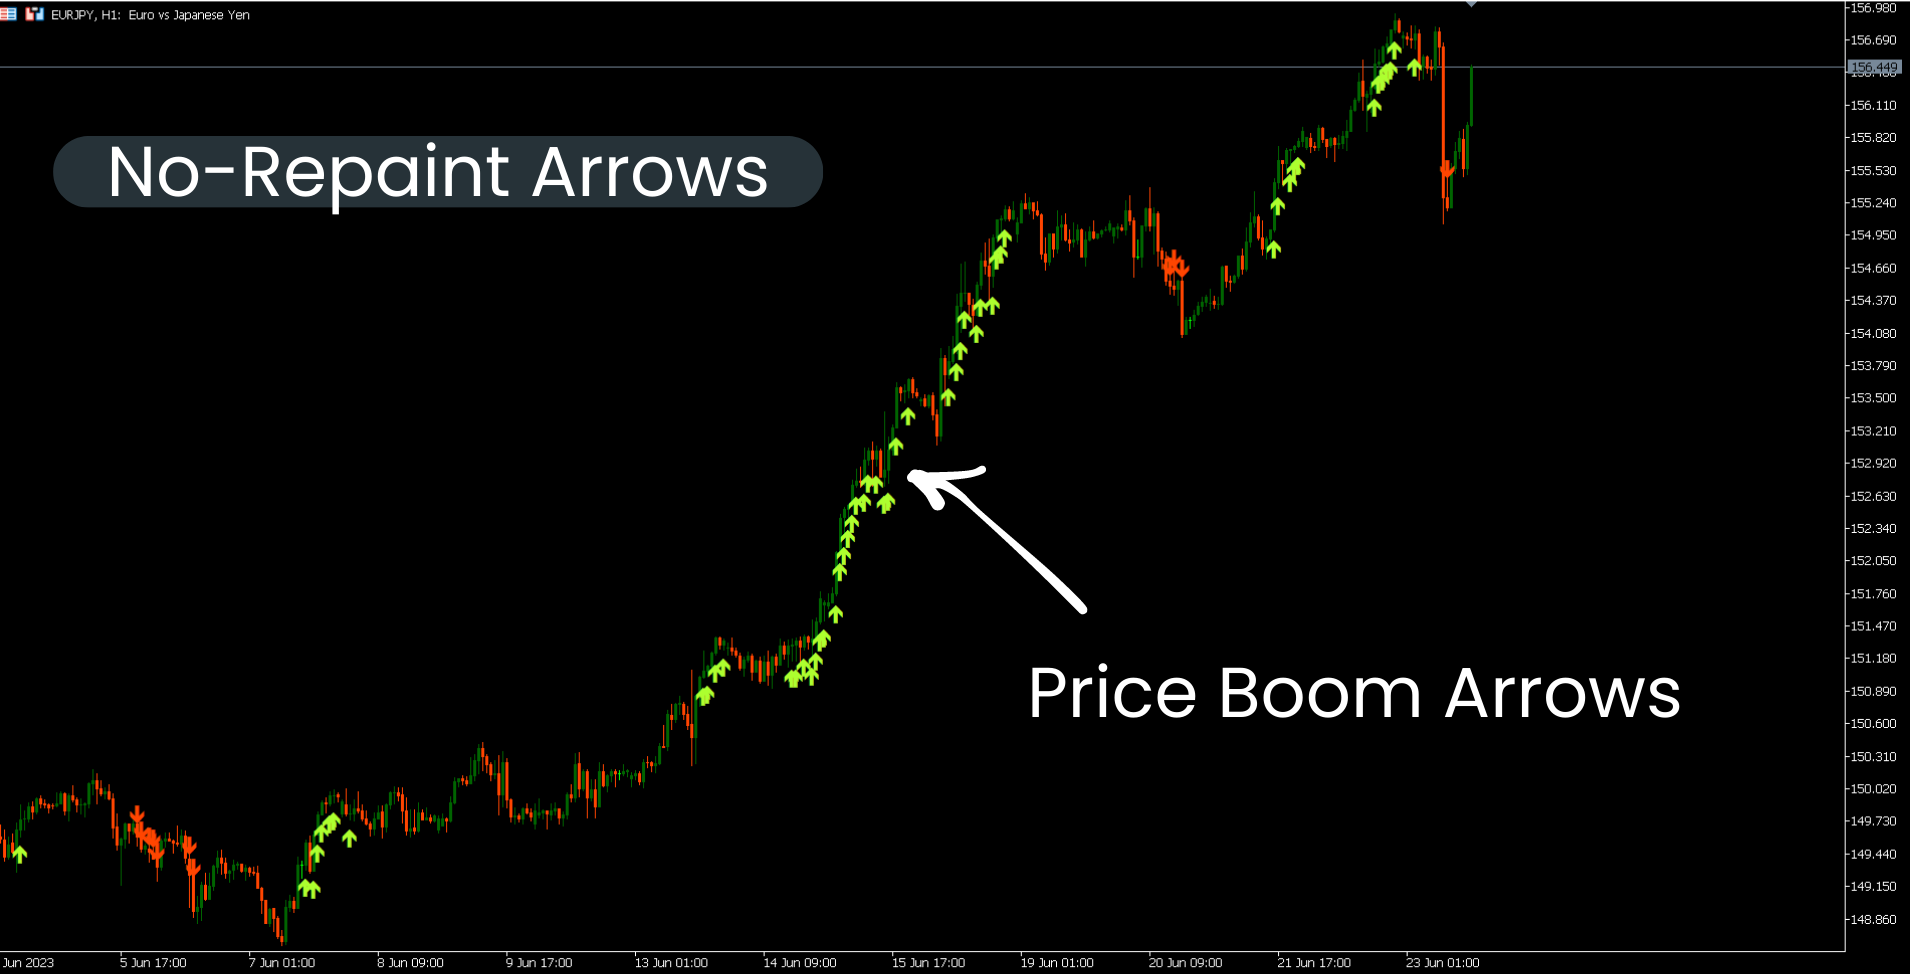
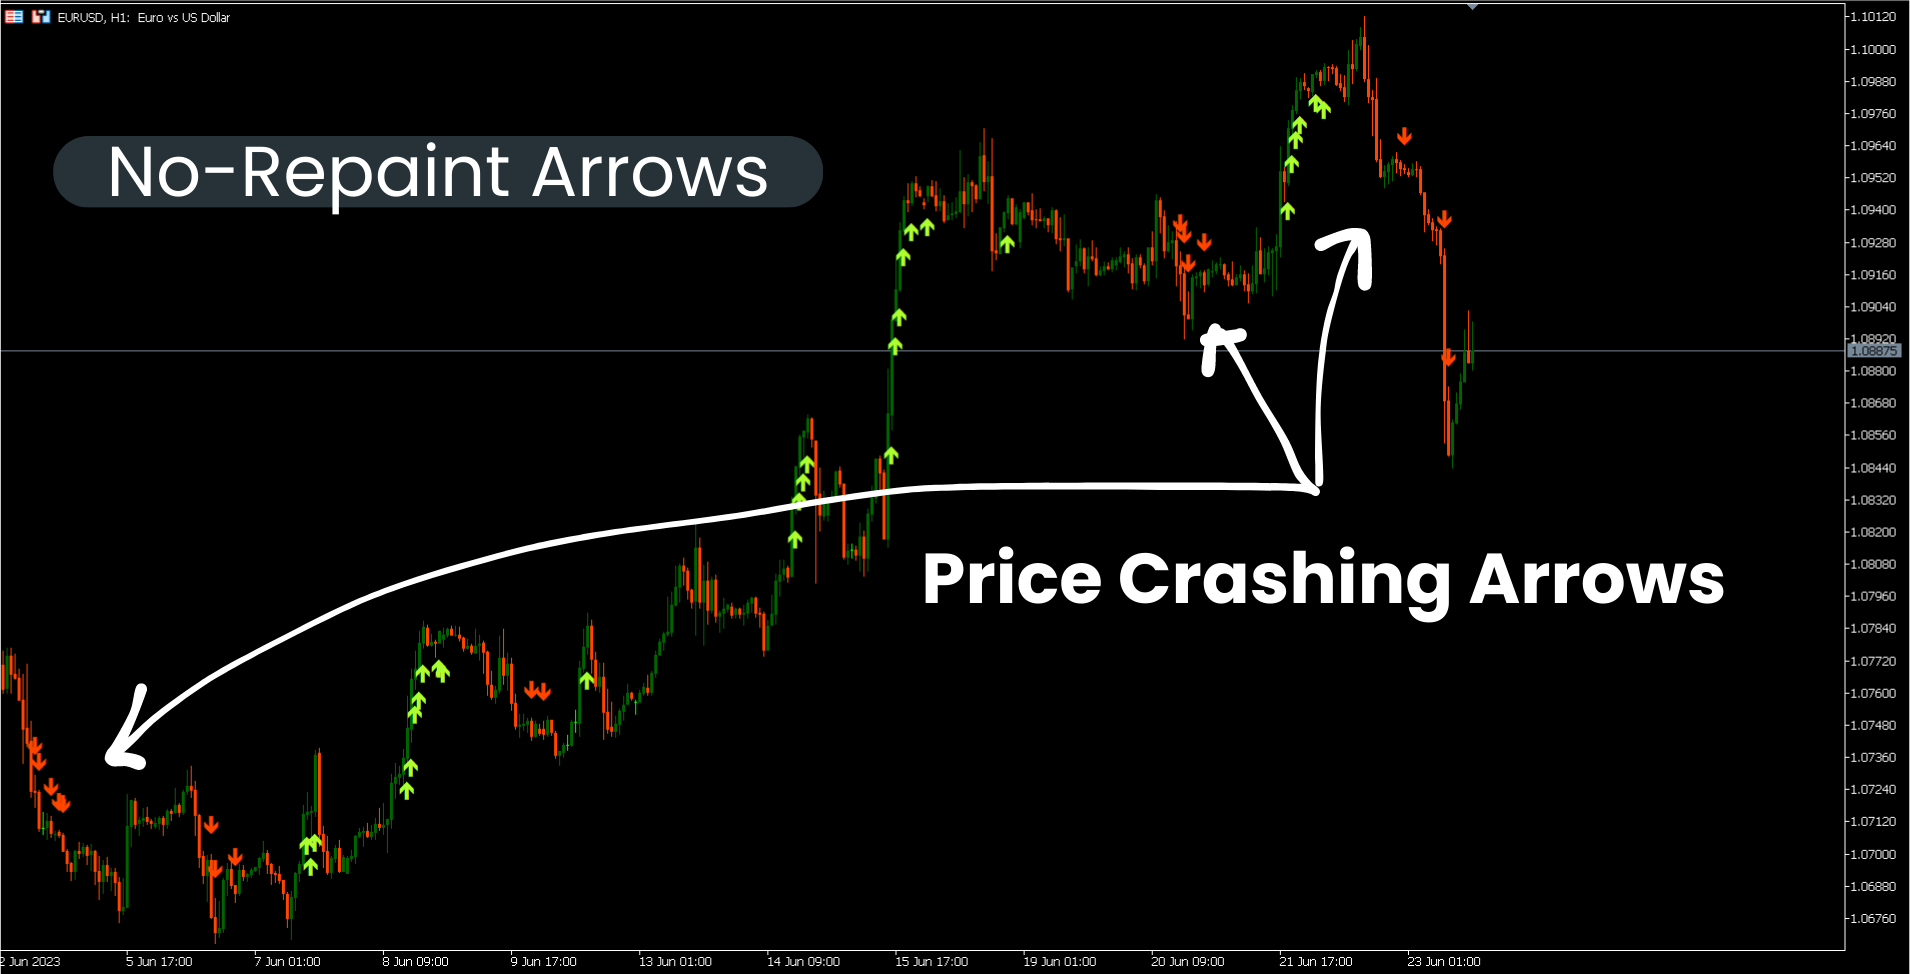
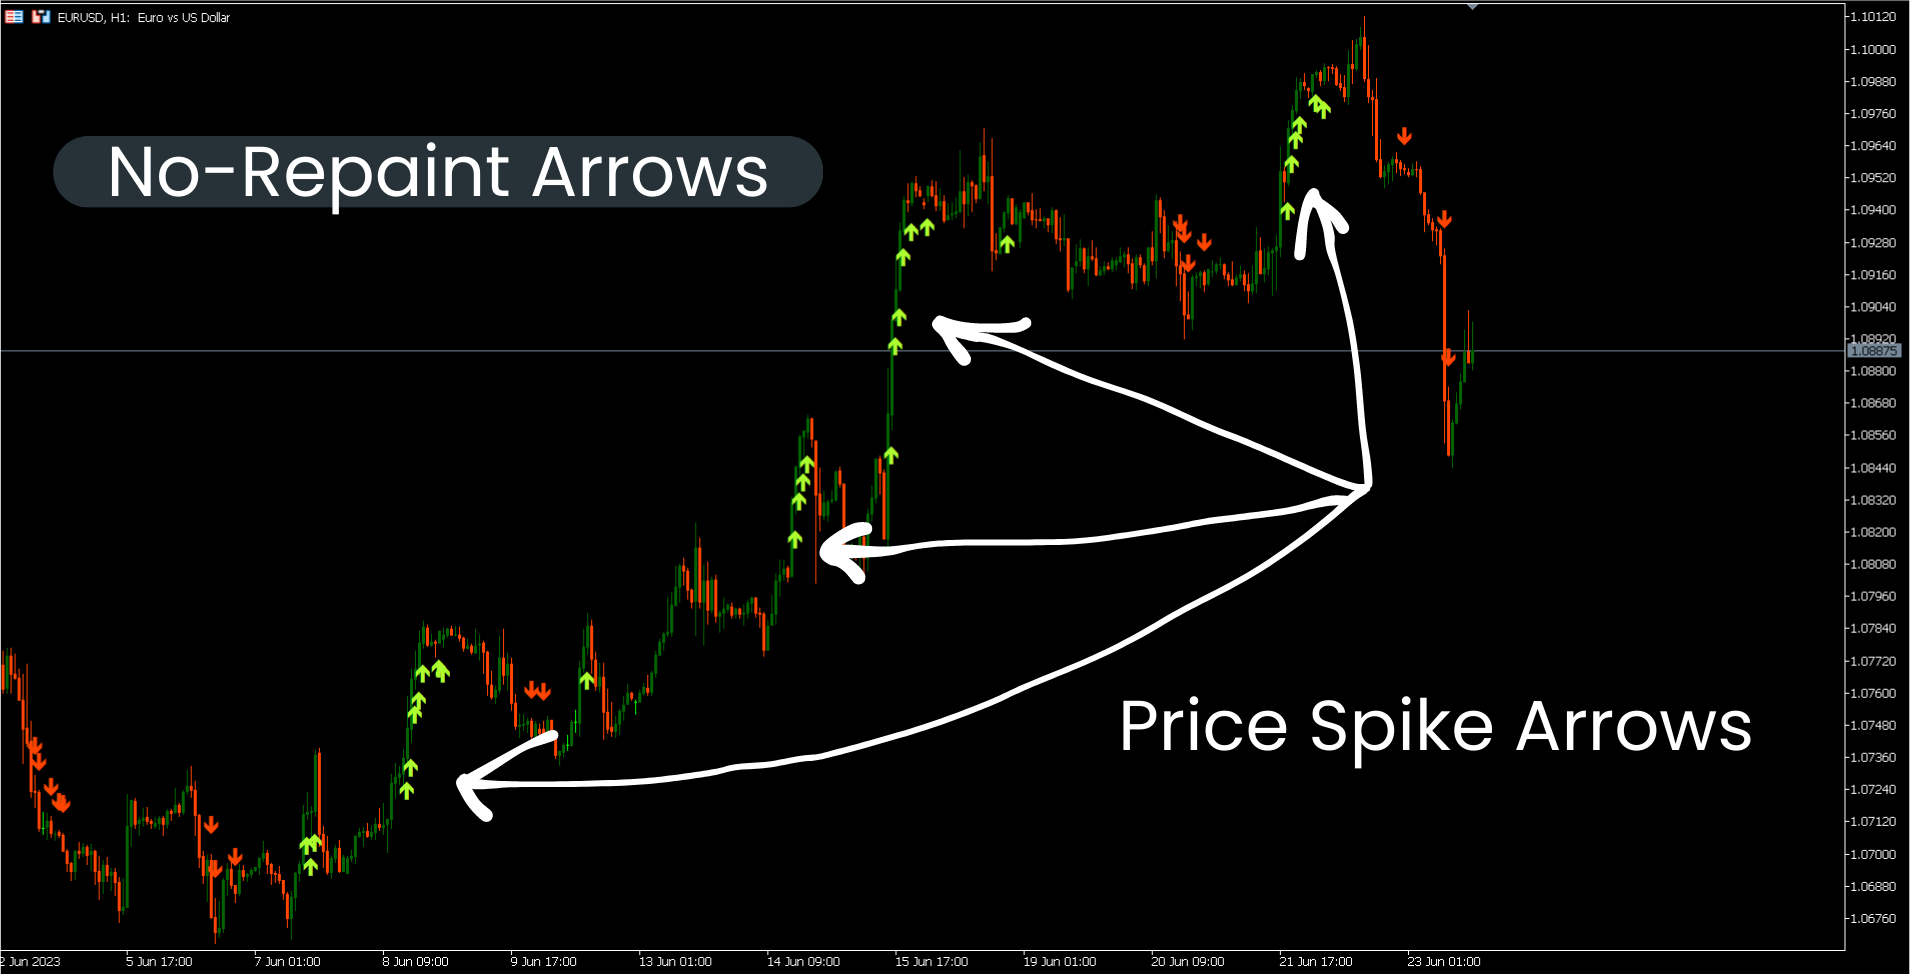
Boom and Crash Spike Detector indicator is coded based on an advanced strategy primarily for detecting the Boom and Crash in the prices. Complex algorithms were implanted to detect high probability Booms and Crashs in the prices. It alerts on potential Boom or crash phases.
Key Features
- Sends push notifications to mobile phone
- Pop up and sound alerts on computer or laptop
- Displays non repaint arrows (up arrows for Potential Boom and down arrows for Potential Crash)
- Working with all pairs.
Recommendation
Timeframe : H1 and H4
Recommend pairs : Pairs in trending phases.
More Premium Indicators
If you're looking for a good and professional trading indicators, our indicators are designed for you.
| Indicator Name | Description | Download MT4 version |
|---|---|---|
| Trend Screener | A full trading system that have all trend tools to analyze the trend and make Metatrader a Trend Analyzer. With this indicator, you will have Trend Dashboard, Trend Line , Trend C.S.M , Strong Trend Signals and Weak Trend Signals. | Download |
| HV Support and Resistance | A power tools to identify Resistances Zones and Support Zones via Ticks volumes algorithm and Harmonic Patterns algorithm. | Download |
| Trend Currency Strength Meter | Give a quick visual guide to which currencies are currently strong, and which ones are weak. This CSM indicator is based on the percentage of change and volume. | Download |
| Trend Line Map | Forex Signals scanner based on Trend Screner Indicator. It's working as an Addons for Trend screener Indicator. | Download |
Contact
If you have some questions or if you need help,contact me via Private Message.
Author
SAYADI ACHREF , fintech software engineer and founder of Finansya.

I will give this Boom & Crash indicator the five star review that it deserves! It is very accurate in finding fast moving pairs. Also it is NOT REPAINT, which is key as so many other indicators look "perfect" but end up being worthless, even some here on this platform. I will contact the head coding genius Sayadi to see if possible to get a custom improvement but overall very happy with this indicator! Also it is an incredible value. A+ by Jim