Boom and Crash Spike Detector Indicator for MT5
- Indicators
-
STE S.S.COMPANY
 Hello,
my name is Ashraf a fintech Software Engineer.
I create amazing forex indicators and expert advisors for Metatrader 4 and Metatrader 5, the best trading platforms.
Use my service and let me build your trading strategies ( Indicator coding or EA coding ) by click on bellow link - Version: 1.0
- Activations: 10
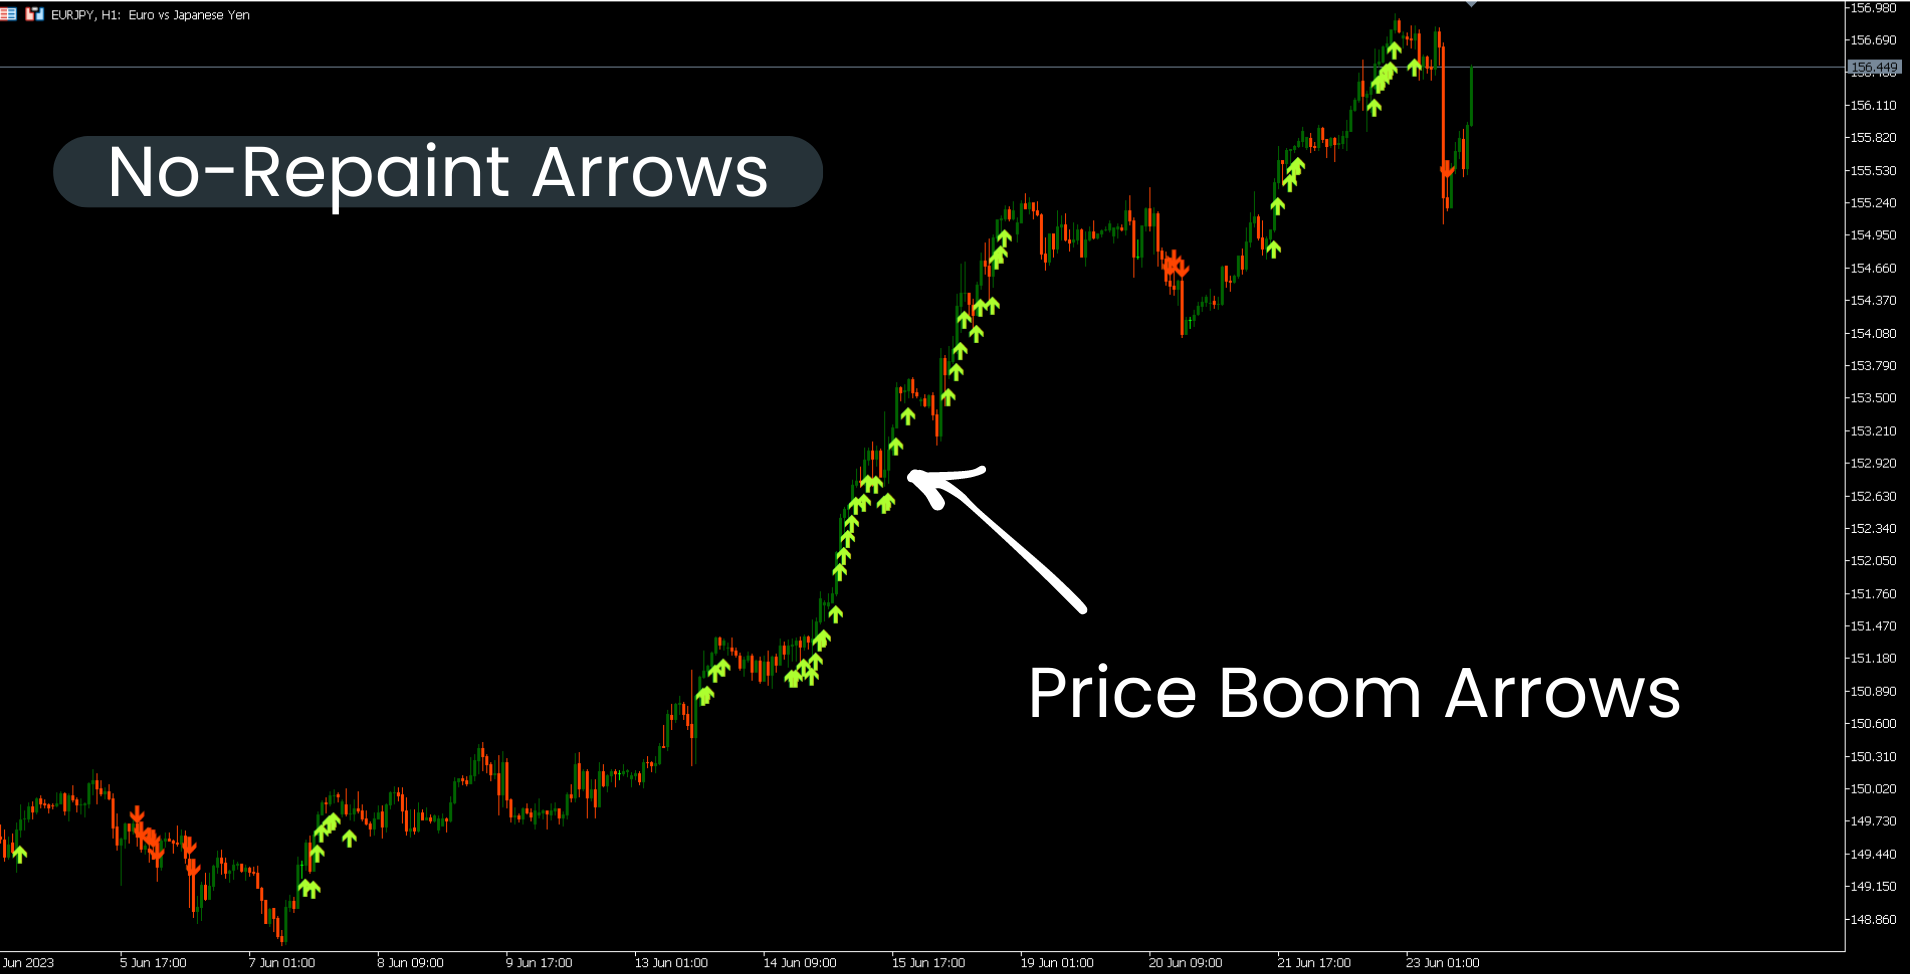
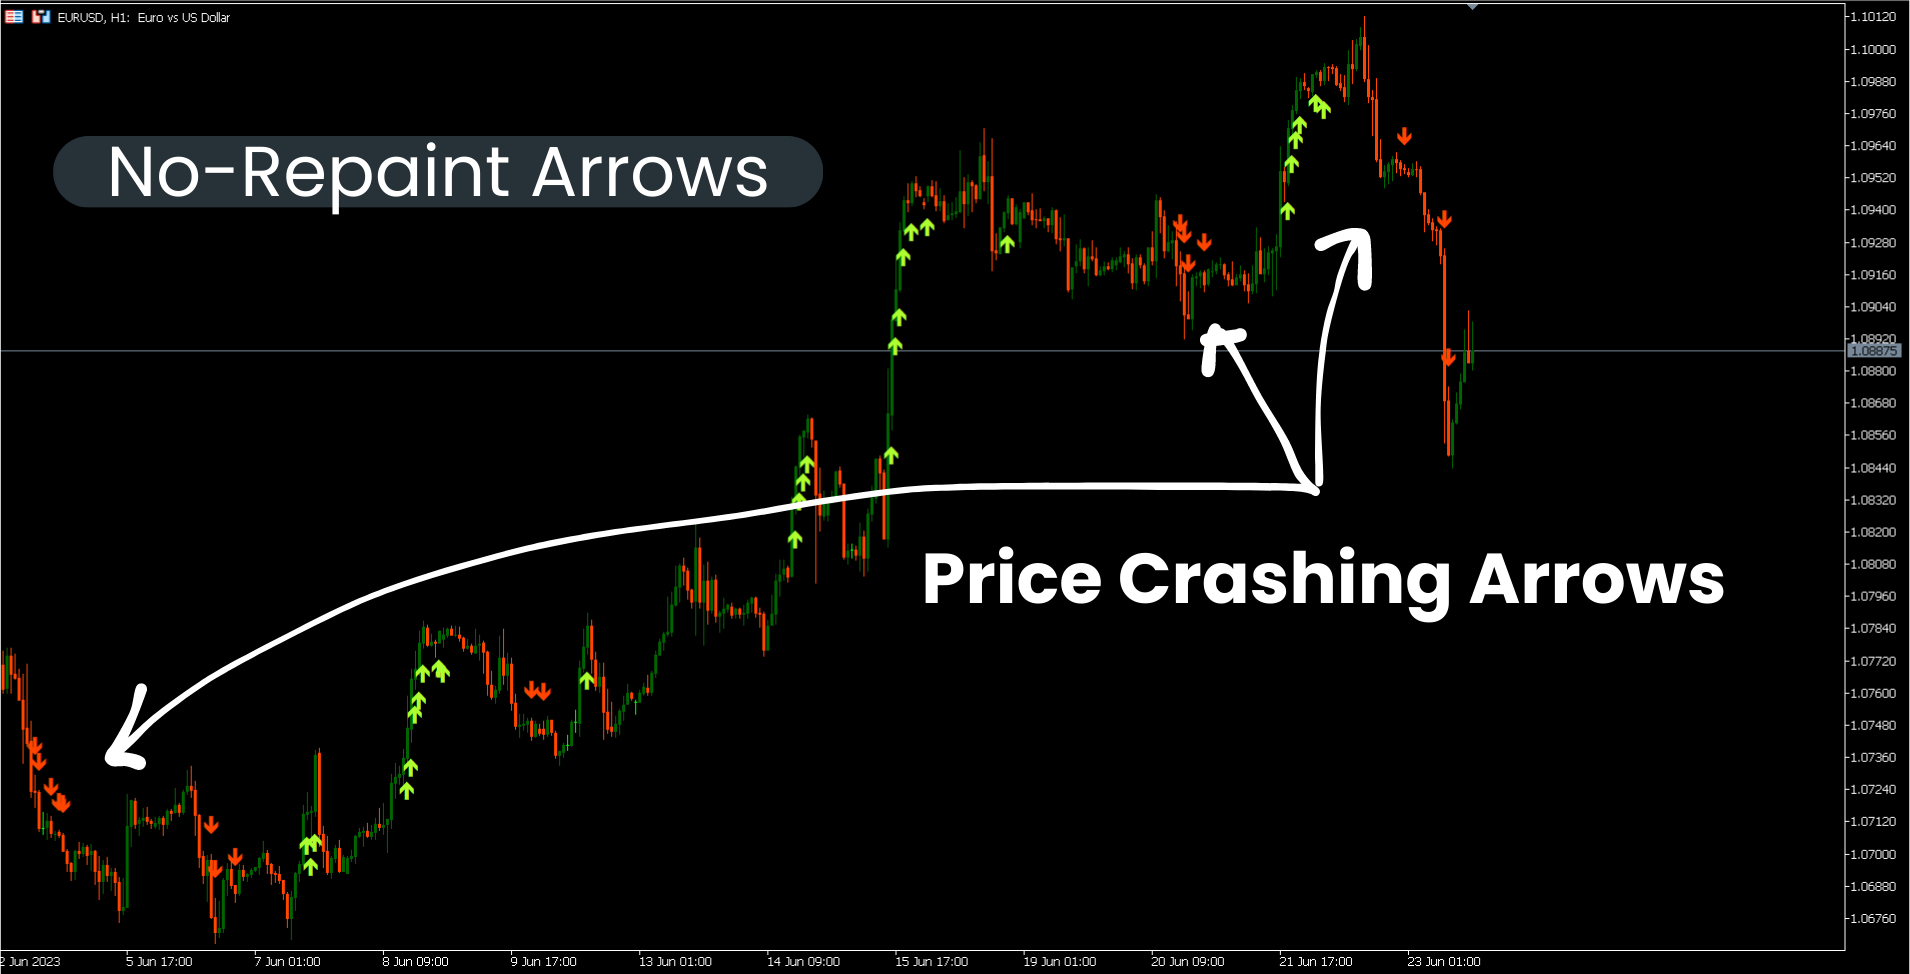
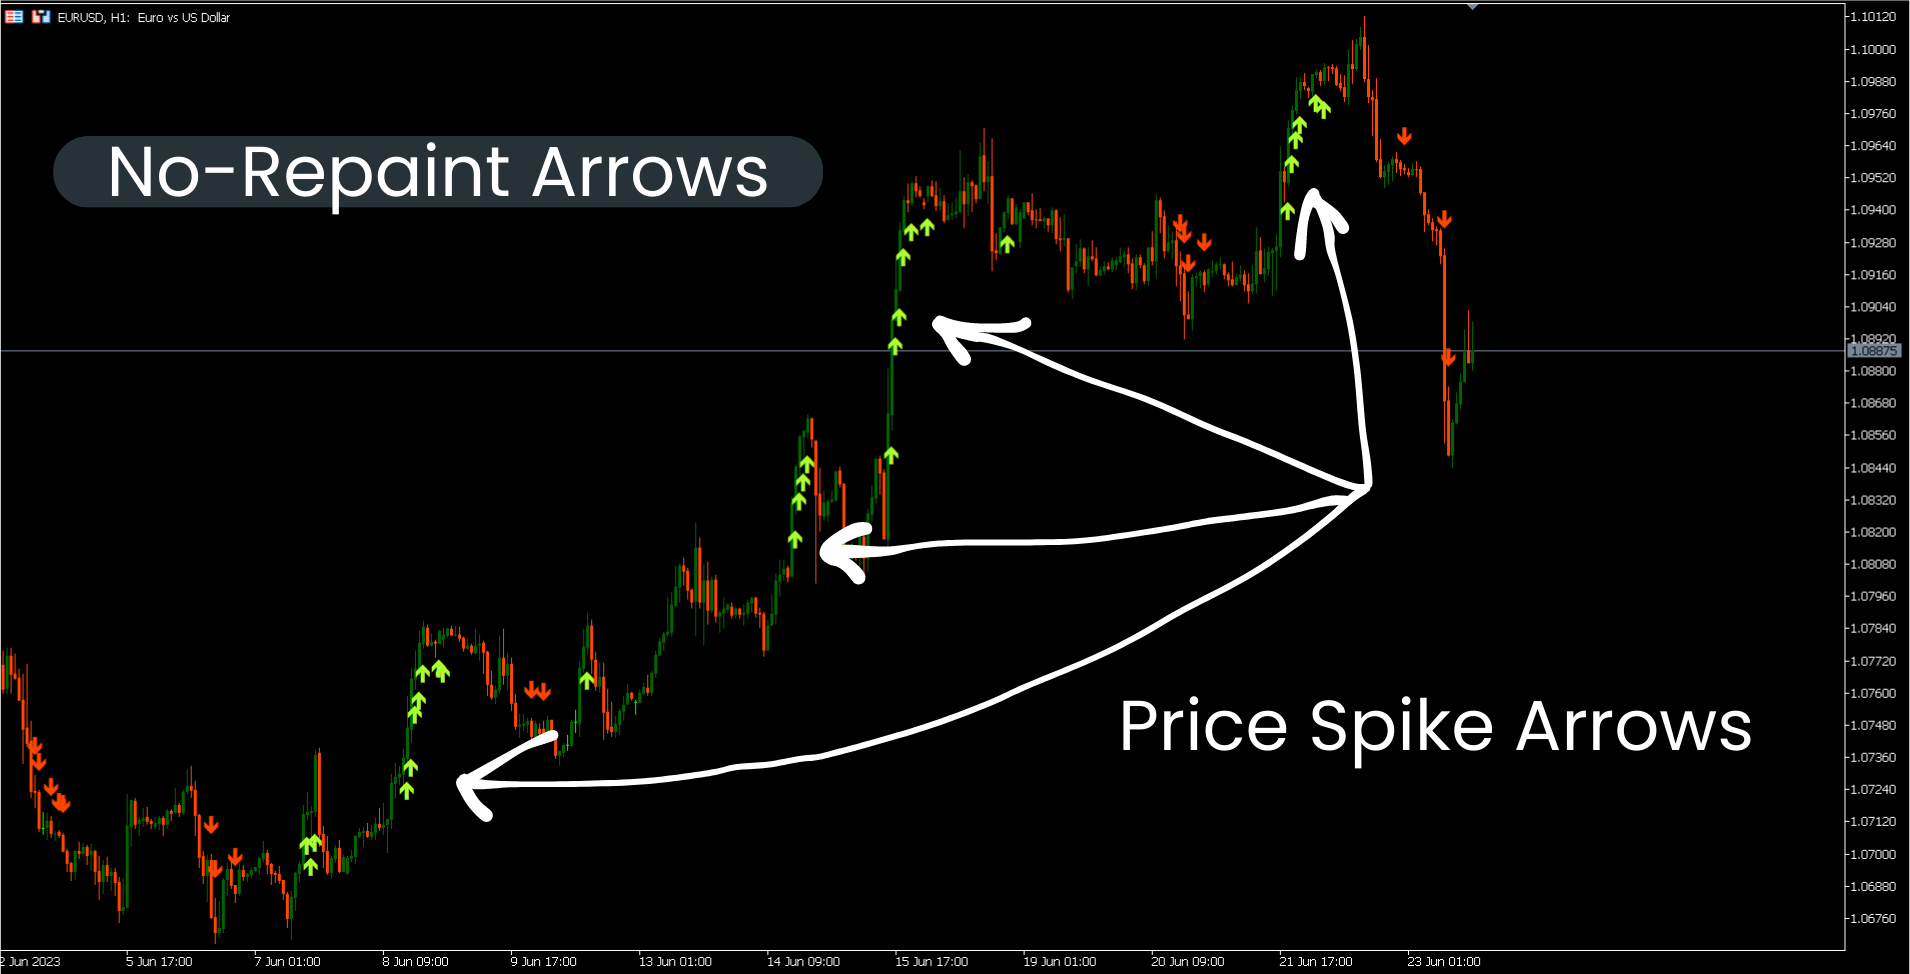
Boom and Crash Spike Detector indicator is coded based on an advanced strategy primarily for detecting the Boom and Crash in the prices. Complex algorithms were implanted to detect high probability Booms and Crashs in the prices.
Key Features
- Sends push notifications to mobile phone
- Pop up and sound alerts on computer or laptop
- Displays non repaint arrows (up arrows for Potential Boom and down arrows for Potential Crash)
- Working with all pairs.
Recommendation
Timeframe : H1 and H4
Recommend pairs : Pairs in trending phases.
More Premium Indicators
If you're looking for a good and professional trading indicators, our indicators are designed for you.
| Indicator Name | Description | Download MT4 version |
|---|---|---|
| Trend Screener | A full trading system that have all trend tools to analyze the trend and make Metatrader a Trend Analyzer. With this indicator, you will have Trend Dashboard, Trend Line , Trend C.S.M , Strong Trend Signals and Weak Trend Signals. | Download |
| Trend Line Map | Forex Signals scanner based on Trend Screner Indicator. It's working as an Addons for Trend screener Indicator. | Download |
Contact
If you have some questions or if you need help,contact me via Private Message.
Author
SAYADI ACHREF , fintech software engineer and founder of Finansya.

P0werful indicat0r, f0r b00m and crash H1 H4 Thumb up!