Boom and Crash Spike Detector Indicator for MT4
- Indicatori
-
STE S.S.COMPANY
 Hello,
my name is Ashraf a fintech Software Engineer.
I create amazing forex indicators and expert advisors for Metatrader 4 and Metatrader 5, the best trading platforms.
Use my service and let me build your trading strategies ( Indicator coding or EA coding ) by click on bellow link - Versione: 1.2
- Aggiornato: 29 ottobre 2022
- Attivazioni: 10
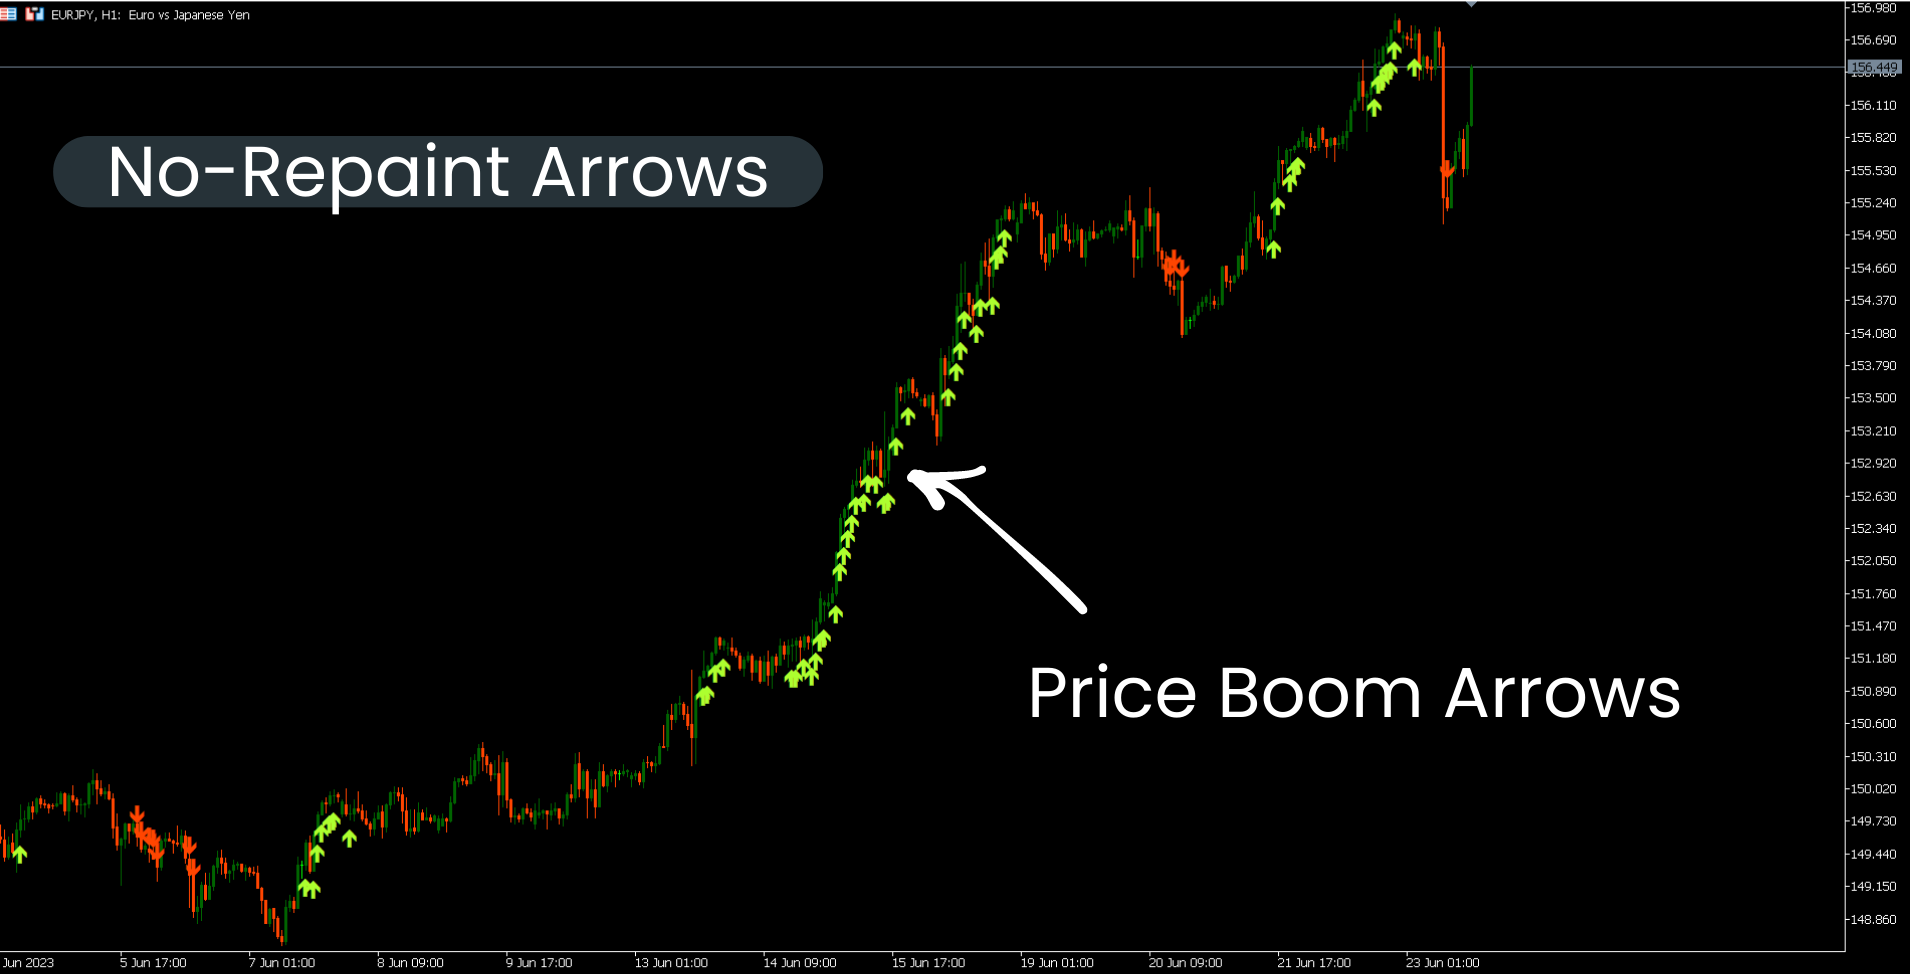
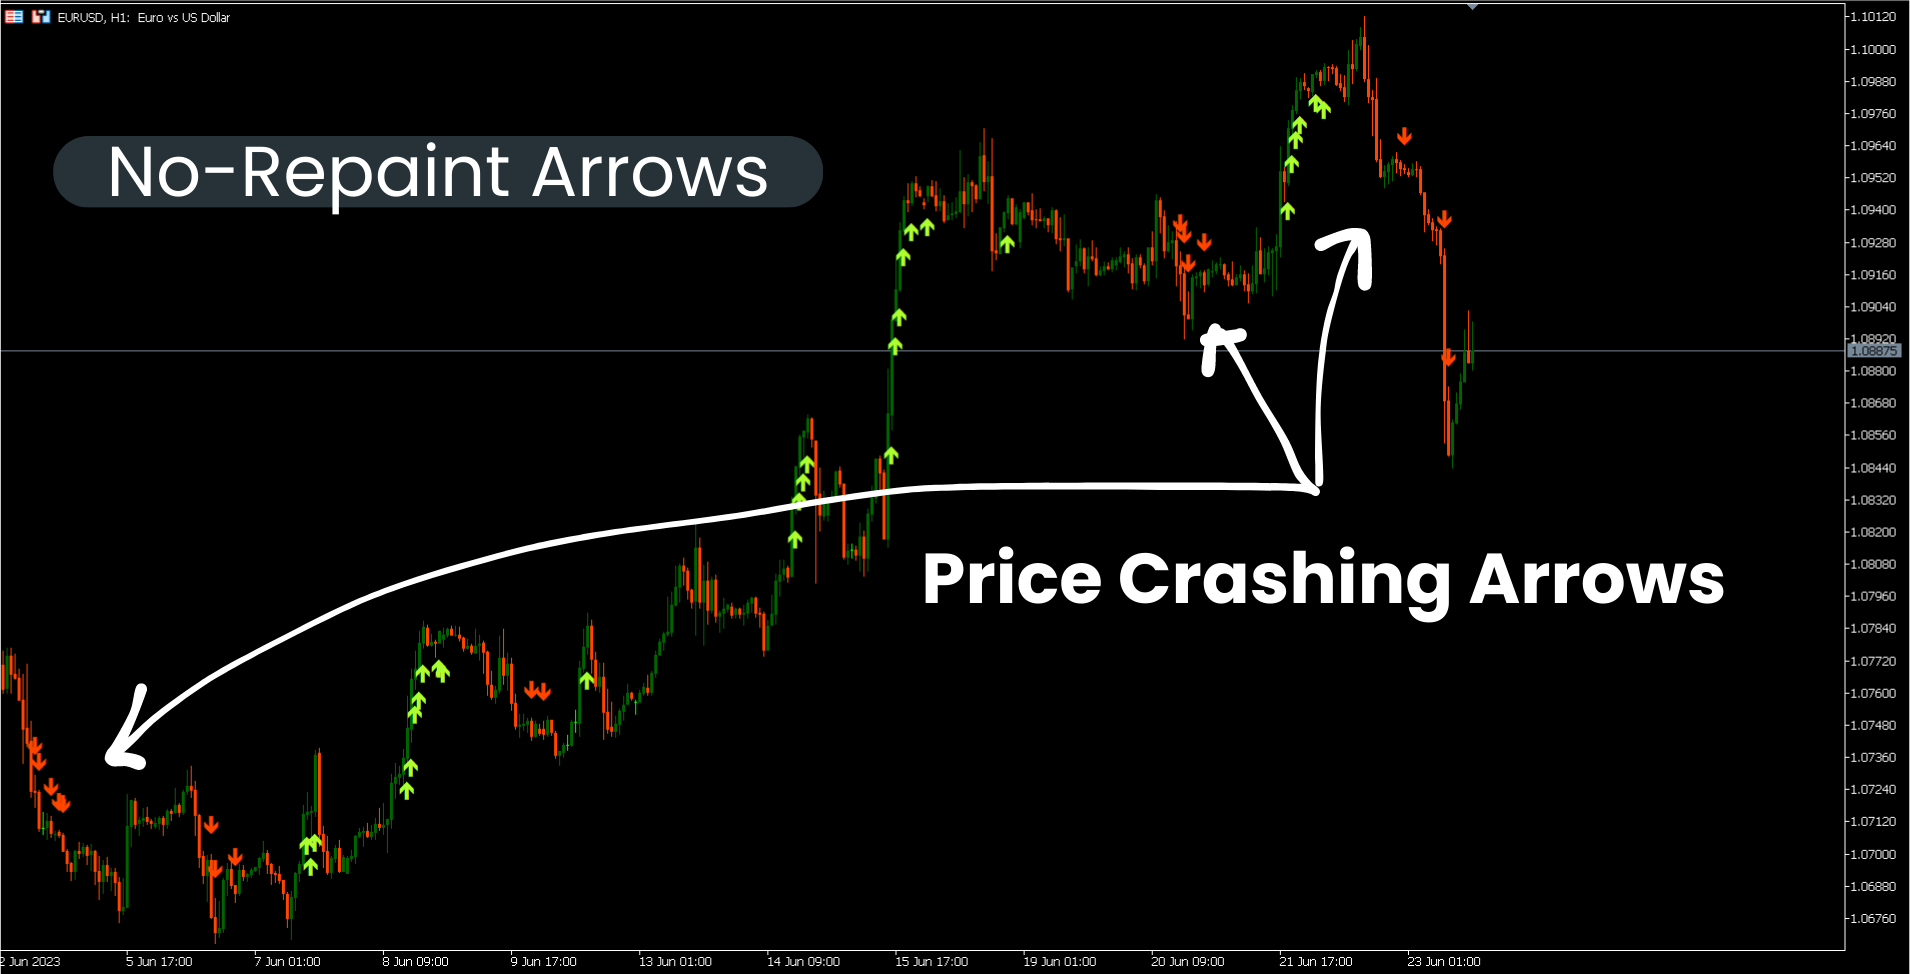
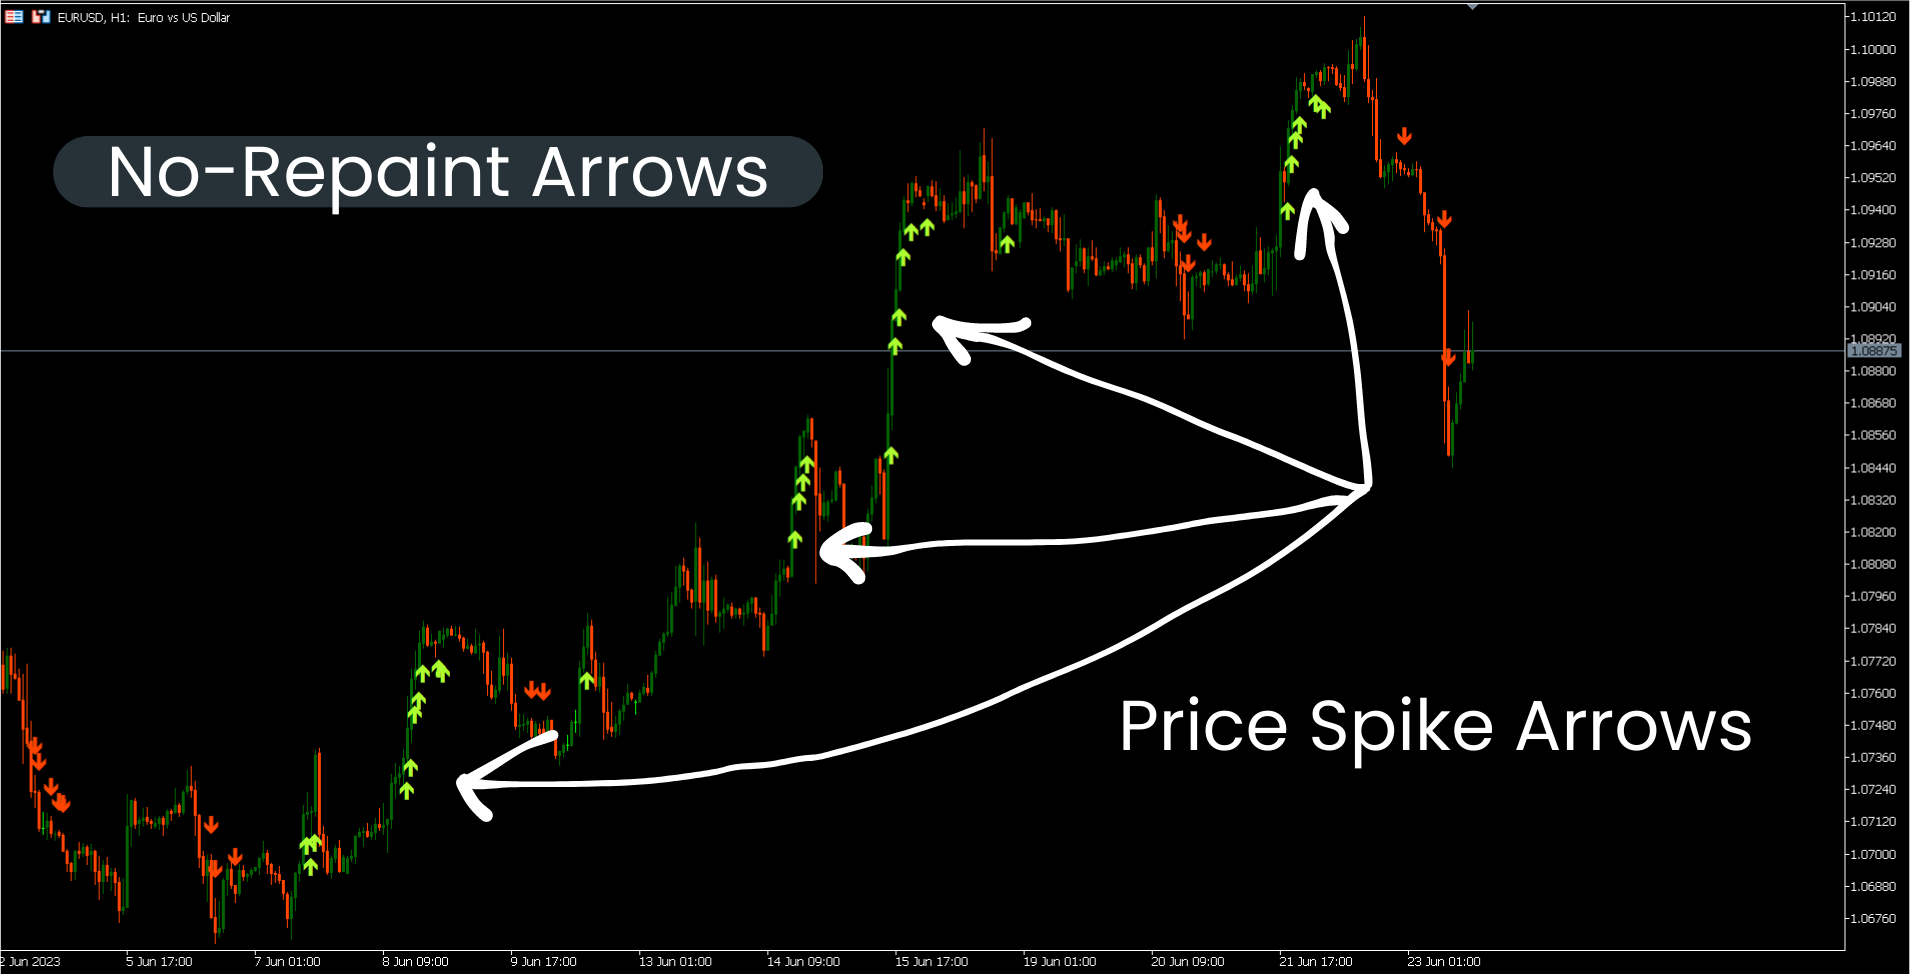
L'indicatore Boom and Crash Spike Detector è codificato in base a una strategia avanzata principalmente per rilevare il boom e il crash nei prezzi. Algoritmi complessi sono stati impiantati per rilevare boom e crash ad alta probabilità nei prezzi. Avvisa su potenziali fasi di boom o arresto anomalo:
- Fase boom: quando il prezzo aumenta troppo velocemente.
- Crash Phase: quando il prezzo diminuisce troppo velocemente.
OFFERTA A TEMPO LIMITATO: L'indicatore è disponibile per soli 30$ e per tutta la vita.
Caratteristiche principali
- Invia notifiche push al telefono cellulare
- Pop-up e avvisi sonori su computer o laptop
- Visualizza le frecce non ridipinte (frecce su per Potential Boom e frecce giù per Potential Crash)
- Lavorare con tutte le coppie.
Raccomandazione
- Tempi: H1 e H4
- Consiglia coppie: coppie in fasi di tendenza.
Contatto
Se hai qualche domanda o se hai bisogno di aiuto, contattami tramite messaggio privato.
Autore
SAYADI ACHREF, ingegnere del software fintech e fondatore di Finansya.

I will give this Boom & Crash indicator the five star review that it deserves! It is very accurate in finding fast moving pairs. Also it is NOT REPAINT, which is key as so many other indicators look "perfect" but end up being worthless, even some here on this platform. I will contact the head coding genius Sayadi to see if possible to get a custom improvement but overall very happy with this indicator! Also it is an incredible value. A+ by Jim