Sayadi Achraf / Seller
Published products

Unlock the Power of Trends trading with Trend Screener Indicator: Your Ultimate Trend Trading Solution powered by fuzzy logic and Multi-currencies System ! Elevate your trend trading with Trend Screener, the revolutionary trend indicator powered by fuzzy logic. It is a powerful trend-following indicator that combines over 13 premium tools and features and 3 trading strategies , making it a versatile choice to make your Metatrader a Trend Analyzer. LIMITED TIME OFFER : Trend Screener Indi

Unlock the Power of Trends trading with Trend Screener Indicator: Your Ultimate Trend Trading Solution powered by fuzzy logic and Multi-currencies System ! Elevate your trend trading with Trend Screener, the revolutionary trend indicator powered by fuzzy logic. It is a powerful trend-following indicator that combines over 13 premium tools and features and 3 trading strategies , making it a versatile choice to make your Metatrader a Trend Analyzer. LIMITED TIME OFFER : Trend Screener Indi

Xmaster formula indicator analyzes the trend. In addition,It generates buy and sell signals that work for most currency pairs and timeframes. In conclusion, we have optimized the formula of Xmaster to be more accurate by adding a volatility analyzer and Multi-timeframe analysis. LIMITED TIME OFFER: All our premium indicators are available for only 50$, by accessing our MQL5 blog you will find all the details of our premium indicators. Click here. To Join Finansya Indicators & EAs channel : Cl
FREE
Xmaster formula indicator analyzes the trend. In addition,It generates buy and sell signals that work for most currency pairs and timeframes. In conclusion, we have optimized the formula of Xmaster to be more accurate by adding a volatility analyzer and Multi-timeframe analysis.
LIMITED TIME OFFER: All our premium indicators are available for only 50$, by accessing our MQL5 blog you will find all the details of our premium indicators. Click here. To Join Finansya Indicators & EAs channel :
FREE

Support And Resistance Screener Breakthrough unique Solution With All Important levels analyzer and Markets Structures Feature Built Inside One Tool! Our indicator has been developed by traders for traders and with one Indicator you will find all Imporant market levels with one click.
LIMITED TIME OFFER : Support and Resistance Screener Indicator is available for only 50 $ and lifetime. ( Original price 125$ ) (offer extended) The available tools ( Features ) in our Indicator are : 1. HH-LL

Support And Resistance Screener Breakthrough unique Solution With All Important levels analyzer and Markets Structures Feature Built Inside One Tool ! Our indicator has been developed by traders for traders and with one Indicator you will find all Imporant market levels with one click.
LIMITED TIME OFFER : Support and Resistance Screener Indicator is available for only 50 $ and lifetime. ( Original price 125$ ) (offer extended) The available tools ( Features ) in our Indicator are : 1. HH-LL

Boom and Crash Spike Detector indicator is coded based on an advanced strategy primarily for detecting the Boom and Crash in the prices. Complex algorithms were implanted to detect high probability Booms and Crashs in the prices .
Key Features
Sends push notifications to mobile phone Pop up and sound alerts on computer or laptop Displays non repaint arrows (up arrows for Potential Boom and down arrows for Potential Crash) Working with all pairs.
Recommendation
Timeframe : H1 and H4 Re

Boom and Crash Spike Detector indicator is coded based on an advanced strategy primarily for detecting the Boom and Crash in the prices. Complex algorithms were implanted to detect high probability Booms and Crashs in the prices . It alerts on potential Boom or crash phases.
Key Features
Sends push notifications to mobile phone Pop up and sound alerts on computer or laptop Displays non repaint arrows (up arrows for Potential Boom and down arrows for Potential Crash) Working with all pairs.

Introducing our Smart Scalping EA for Metatrader, a highly sophisticated and specialized EA designed to capitalize on the unique characteristics of the EURGBP pair during the Asia session. This expert advisor has been meticulously crafted to operate on the M5 timeframe with limit orders , targeting the low volatility and consolidated market conditions that are prevalent during the Asian trading hours. Developed by a team of experienced traders with trading experience of over 10 yea

Introducing our Smart Scalping EA for Metatrader, a highly sophisticated and specialized EA designed to capitalize on the unique characteristics of the EURGBP pair during the Asia session. This expert advisor has been meticulously crafted to operate on the M5 timeframe with limit orders , targeting the low volatility and consolidated market conditions that are prevalent during the Asian trading hours. Developed by a team of experienced traders with trading experience of over 10 yea

Introducing Spread Screener and Candle Time Indicator - your all-in-one solution for seamless forex trading analysis! Designed with traders like you in mind, this cutting-edge tool revolutionizes the way you monitor spreads and track server time across multiple currency pairs. Best of all, it's completely free to download! Spread Screener empowers you to effortlessly monitor the spread of multiple currency pairs simultaneously. No more tedious switching between charts or guessing which pairs off
FREE

Currency Strength Meter, gives you a quick visual guide to which currencies are currently strong, and which ones are weak. The meter measures the strength of all forex cross pairs and applies calculations on them to determine the overall strength for each individual currency. We calculate based the strength of currency based on the trend of 28 pairs.
LIMITED TIME OFFER : TREND CSM Indicator is available for only 50 $. ( Original price 125$ )
By accessing to our MQL5 Blog, you can find all o

Currency strength meter gives you a quick visual guide to which currencies are currently strong, and which ones are weak. The meter measures the strength of all forex cross pairs and applies calculations on them to determine the overall strength for each individual currency.We calculate based the strength of currency based on the trend of 28 pairs.
LIMITED TIME OFFER : Trend CSM Indicator is available for only 50 $. ( Original price 125$ )
By accessing to our MQL5 Blog, you can find all our
Volatility analyzer is a momentum indicator, which capitalizes on the tendency for price to break out strongly after consolidating in a tight trading range. The indicator also uses a momentum oscillator to show the expected direction of the move when the squeeze fires. This histogram oscillates around the zero line, increasing momentum above the zero line indicates an opportunity to purchase long, while momentum falling below the zero line can indicate a shorting opportunity.
LIMITED TIME OFF
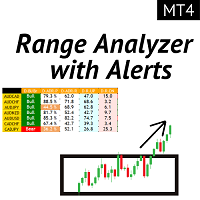
The Range analyzer indicator shows the average pip range of a Forex pair measured over a certain number of periods. Traders can use the ADR to visualize potential price action outside the average daily move. When ADR is above average, it means that the daily volatility is higher than usual, which implies that the currency pair may be extending beyond its norm. Our ADR Analyzer is composed of 5 main features : Range ( ADR ) Screener: A multi-currencies ADR analysis. ADR Zone: shows the expec
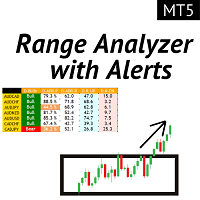
The Average Daily Range shows the average pip range of a Forex pair measured over a certain number of periods. Traders can use the ADR to visualize potential price action outside the average daily move. When ADR is above average, it means that the daily volatility is higher than usual, which implies that the currency pair may be extending beyond its norm. Our ADR Analyzer is composed of 5 main features : Range ( ADR ) Screener: A multi-currencies ADR analysis. ADR Zone: shows the expected m

Trend Line Map indicator is an addons for Trend Screener Indicator . It's working as a scanner for all signals generated by Trend screener ( Trend Line Signals ) . It's a Trend Line Scanner based on Trend Screener Indicator. If you don't have Trend Screener Pro Indicator, the Trend Line Map Pro will not work.
LIMITED TIME OFFER : Trend Line Map Indicator is available for only 50 $ and lifetime. ( Original price 125$ )
By accessing to our MQL5 Blog, you can find all our premium indicators w

Trend Line Map indicator is an addons for Trend Screener Indicator . It's working as a scanner for all signals generated by Trend screener ( Trend Line Signals ) . It's a Trend Line Scanner based on Trend Screener Indicator. If you don't have Trend Screener Pro Indicator, the Trend Line Map Pro will not work. LIMITED TIME OFFER : Trend Line Map Indicator is available for only 50 $ and lifetime. ( Original price 125$ )
By accessing to our MQL5 Blog, you can find all our premium indica
Every trader knows that he or she should never Risk more than 5% (or 7%) per trade. This is a Money Management law and an usable LotSize should be calculated each time because a trader must use a different StopLoss value for different trading levels. This indicator will calculate an appropriate LotSize for the moment when you will put it on the chart and each time you will drag the "Stop Loss Line" in any direction.
LIMITED TIME OFFER: All our premium indicators are available for only 50$, b
Every trader knows that he or she should never Risk more than 5% (or 7%) per trade.This is a Money Management law and an usable LotSize should be calculated each time because a trader must use a different StopLoss value for different trading levels. This indicator will calculate an appropriate LotSize for the moment when you will put it on the chart and each time you will drag the "Stop Loss Line" in any direction.
LIMITED TIME OFFER: All our premium indicators are available for only 50$, by
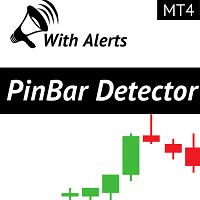
Pin Bar Detector is an indicator that finds Pin Bars price action pattern on the chart. Pin Bars is a shortcut for "Pinocchio Bars" which is a classic bar pattern alternative to Japanese candlesticks with tall upper or lower shadows and very small bodies like Dragon Fly Doji , Grave Stone Doji, Hammer, Inverted-Hammer, Hanging Man and Shooting Star.
LIMITED TIME OFFER: All our premium indicators are available for only 50$, by accessing our MQL5 blog you will find all the details of our premiu
FREE

Pin Bar Detector is an indicator that finds Pin Bars price action pattern on the chart. Pin Bars is a shortcut for "Pinocchio Bars" which is a classic bar pattern alternative to Japanese candlesticks with tall upper or lower shadows and very small bodies like Dragon Fly Doji , Grave Stone Doji, Hammer, Inverted-Hammer, Hanging Man and Shooting Star.
LIMITED TIME OFFER: All our premium indicators are available for only 50$, by accessing our MQL5 blog you will find all the details of our prem
FREE

Introducing Spread Screener and Candle Time Indicator - your all-in-one solution for seamless forex trading analysis! Designed with traders like you in mind, this cutting-edge tool revolutionizes the way you monitor spreads and track server time across multiple currency pairs. Best of all, it's completely free to download! Spread Screener empowers you to effortlessly monitor the spread of multiple currency pairs simultaneously. No more tedious switching between charts or guessing which pairs off
FREE

Introducing our latest offering in the world of trading indicators: the Moving Average Angle Histogram Indicator, now available for free download on the MQL5 market! Designed to revolutionize the way you identify trend direction, this powerful tool employs a unique histogram visualization coupled with moving average angles to provide you with unparalleled insights into market dynamics. LIMITED TIME OFFER: All our premium indicators are available for only 50$, by accessing our MQL5 blog you will
FREE
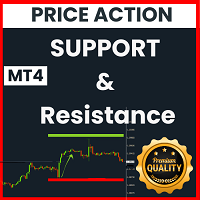
Introducing the "PR Support and Resistance " indicator , a powerful FREE price action indicator rooted in the foundational principles of support and resistance analysis within the realm of forex technical analysis. Designed to identify crucial reversal zones, this indicator utilizes the concept of swing highs and lows, pivotal points where market sentiment shifts. At its core, this indicator is engineered to recognize significant swing highs and lows, which serve as key markers of potential t
FREE
Published signals
- Growth
- -6%
- Subscribers
- 0
- Weeks
- 11
- Trades
- 72
- Win
- 43%
- Profit Factor
- 0.86
- Max DD
- 13%