TheStrat FTFC
- 지표
-
Robert Gerald Wood
 25년 이상 경력의 전문 소프트웨어 개발자, 이제 나만을 위한 도구를 만들고 더 많은 커뮤니티와 공유합니다.
내 제품에 대한 자세한 내용은 https://www.bunnywood.co.uk를 방문하십시오. - 버전: 1.2
- 업데이트됨: 16 6월 2021
- 활성화: 10
FTFC는 Rob Smith의 The Strat 에서 정의한 전체 시간 프레임 연속성을 나타냅니다.
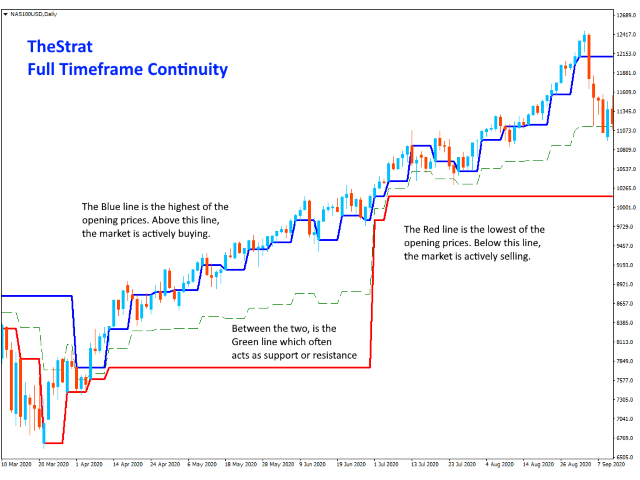
이 지표는 분기별, 월별, 주별, 일별 또는 시간별 시가 수준 중 가장 높은 값 중 하나와 해당 값 중 가장 낮은 값 중 두 번째로 차트에 두 개의 선을 그립니다. 이것은 거래가 한 방향으로 매우 강하게 될 가능성이 높은 위 또는 아래의 채널을 제공합니다. 라인 사이에서 가격 조치는 더 고르지 않으며 더 넓은 스톱을 사용할 수 있습니다.
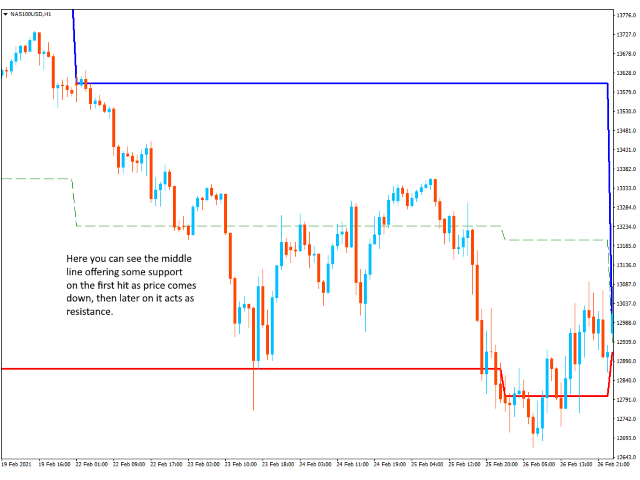
고점과 저점 사이의 중간 지점을 표시하기 위해 세 번째 파선도 그려집니다. 시장이 특정 방향으로 가격을 밀고자 하기 때문에 지지나 저항을 찾기에 좋은 경우가 많습니다. 색상을 NONE으로 설정하여 선택하면 이 선을 끌 수 있습니다.
설정
분기별 수준 포함
일부 사람들이 무시하는 것을 선호하므로 분기별 시가를 계산에 포함하도록 선택할 수 있습니다.
IncludeCurrentTimeframeOpen
true인 경우 현재 표시된 기간이 H1, D1, W1 또는 MN1인 경우 표시기는 해당 기간을 계산에 포함합니다. 최신 지표 버전의 새로운 설정입니다. 이전에는 계산에 현재 열려 있는 기간이 포함되지 않았으며 이는 TheStrat에 동의하지 않습니다.
이 설정은 기본적으로 false이므로 기존 사용자가 설정하지 않는 한 영향을 받지 않습니다.
MaxMilliSecondsToCalculate
많은 기록이 로드된 차트의 경우(10,000개 이상의 막대) 지표를 초기화해야 하는 시간이 제한됩니다. 기본적으로 설정은 1500밀리초(1.5초)입니다. 해당 기간 이후에 지표가 과거 막대에 대한 모든 계산을 수행하지 못한 경우 시도를 중단합니다. 즉, 항상 중요한 기록을 얻을 수 있지만 차트가 중지되지는 않습니다.