Veles dMA Plus

Новая серия индикаторов Veles Dynamic.  Индикаторы не перерисовывают своих значений.
Эти индикаторы работают быстрее и точнее аналогичных по названию.

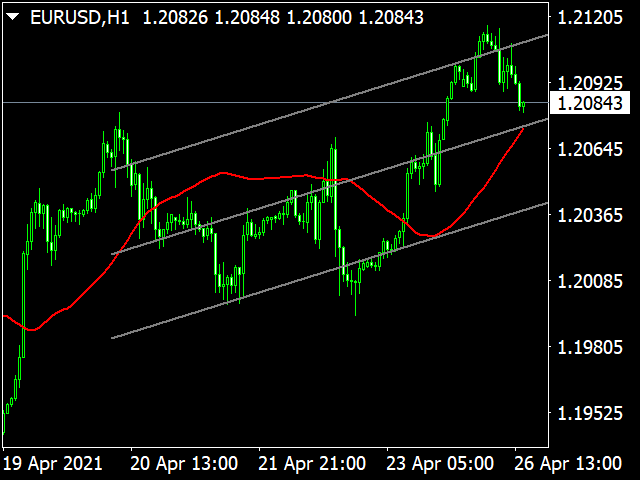
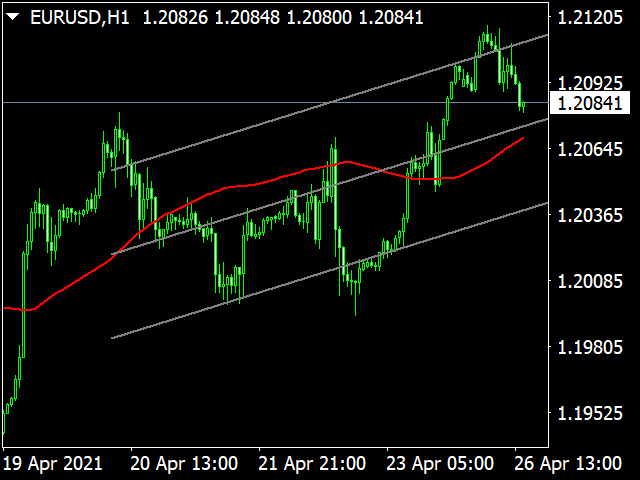
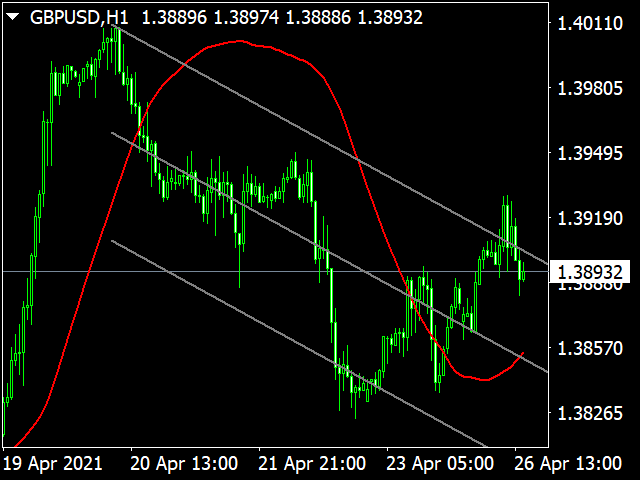
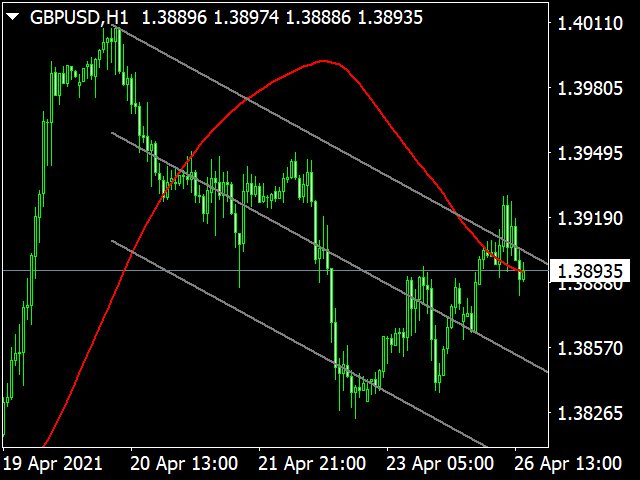
Индикатор Veles_dMA_Plus представляет собой динамическую МА, рассчитанную по текущим ценам инструмента.
Имеется возможность динамического сглаживания линии. Есть возможность отображения текущего трендового канала с изменением его волатильности.

Параметры:

  • period - период динамической МА
  • price - применяемая цена
  • shift - сдвиг МА влево от текущих значений
  • filtre - true включение дополнительного динамического фильтра
  • use_Chennal_Cur - true отображение текущего трендового канала
  • deviation - волатильность канала
  • color_Chennal - цвет канала

Recommended products
The indicator detects and displays Shark harmonic pattern (see the screenshot). The pattern is plotted by the extreme values of the ZigZag indicator (included in the resources, no need to install). After detecting the pattern, the indicator notifies of that by a pop-up window, a mobile notification and an email. The indicator highlights the process of the pattern formation and not just the complete pattern. In the former case, it is displayed in the contour triangles. After the pattern is comple
TSO Top Bottom Divergence MACD
Dionisis Nikolopoulos
5 (1)
This indicator combines double bottom and double top reversal chart patterns together with detection of divergences between the price chart and the MACD oscillator. Features Easily detect strong reversal signals Allows to use double top/bottom and MACD divergence signals combined or independently Get email and/or push notification alerts when a signal is detected Custom colors can be used The indicator is not repainting Can easily be used in an EA (see below) Inputs ENABLE Double Top - Bottom:
This indicator combines double bottom and double top reversal chart patterns together with detection of divergences between the price chart and the Momentum oscillator. Features Easily detect strong reversal signals Allows to use double top/bottom and Momentum divergence signals combined or independently Get email and/or push notification alerts when a signal is detected Custom colors can be used The indicator is not repainting Can easily be used in an EA (see below) Inputs ENABLE Double Top -
Binary Options Support Resistance Indicator This indicator is designed for binary options trading and effectively shows retracements from support and resistance levels. Signals appear on the current candle. A red arrow pointing downwards indicates a potential selling opportunity, while a blue arrow pointing upwards suggests buying opportunities. All that needs adjustment is the color of the signal arrows. It is recommended to use it on the M1-M5 timeframes as signals are frequent on these timef
Dear traders this is Our new Indicator called Hull Pro MTF Indicator — Precision Multi-Timeframe Trend Visualizer Overview The Hull Pro MTF Indicator is a next-generation Heiken-Ashi-based multi-timeframe visual tool designed for top-down market analysis . It blends the power of Hull Moving Average (HMA) logic and multi-level Heiken-Ashi smoothing to reveal directional bias, volatility ranges, and price symmetry across hourly, daily, weekly, monthly, and yearly structures — all in a single c
PABT Pattern Indicator - it's classical system one of the signal patterns. Indicator logic - the Hi & Lo of the bar is fully within the range of the preceding bar, look to trade them as pullback in trend. In the way if indicator found PABT pattern it's drawing two lines and arrow what showing trend way.  - First line - it's entry point and drawing at: 1. On the high of signal bar or on middle of the signal bar (depending from indicator mode) for buy; 2. On the low of signal bar or on middle of t
Alpha Trend sign has been a very popular trading tool in our company for a long time. It can verify our trading system and clearly indicate trading signals, and the signals will not drift. Main functions: Based on the market display of active areas, indicators can be used to intuitively determine whether the current market trend belongs to a trend market or a volatile market. And enter the market according to the indicator arrows, with green arrows indicating buy and red arrows indicating se
Wolfe Wave Scanner MT4
Reza Aghajanpour
4.64 (11)
**  All Symbols  x  All Timeframes  scan just by pressing scanner button ** *** Contact me  to send you instruction and add you in "Wolfe Wave Scanner group" for sharing or seeing experiences with other users. Introduction: A Wolfe Wave is created with five-wave patterns in price. It shows supply and demand and a fight towards a balance price. T hese waves of price actions can help traders identify the boundaries of   the trend . Also  It helps forecast how the price will move in the near future
PZ Divergence Trading
PZ TRADING SLU
5 (2)
Unlock hidden profits: accurate divergence trading for all markets Tricky to find and scarce in frequency, divergences are one of the most reliable trading scenarios. This indicator finds and scans for regular and hidden divergences automatically using your favourite oscillator. [ Installation Guide | Update Guide | Troubleshooting | FAQ | All Products  |  Get Help ] Easy to trade Finds regular and hidden divergences Supports many well known oscillators Implements trading signals based on br
This is a combination of multiple oscillators into a single divergence system that creates the impression of a more reliable divergence indicator. It is multi-currency based and works best on 15 minutes timeframe and above. Every time a signal is generated, it shows an alert to the user. It is more ideal if combined with other price action indicators or trading systems.
MACDivergence MTF
Pavel Zamoshnikov
4.29 (7)
Advanced ideas of the popular MACD indicator: It detects and displays classic and reverse divergences (three methods of detecting divergences). It uses different color to highlight an uptrend and a downtrend. Two methods of determining a trend: а) MACD crosses the 0 level (classic signal); б) MACD crosses its own average (early signal). This is a multi-timeframe indicator: it can display MACD data from other timeframes. Two methods of drawing: classic histogram and line. It generates sound and v
Indicator without redrawing Divergent MAX The DivirgentMAX indicator is a modification based on the MACD. The tool detects divergence based on OsMA and sends signals to buy or sell (buy|sell), taking into account the type of discrepancies detected. Important!!!! In the DivirgentMAX indicator, the optimal entry points are drawn using arrows in the indicator's basement. Divergence is also displayed graphically. In this modification of the MACD, the lag problem characteristic of its predecessor i
Crypto_Forex Indicator "RVI and 2 Moving Averages" for MT4. No Repaint. - Relative_Vigor_Index (RVI) itself is a technical momentum indicator which is very useful on trend markets. - "RVI and 2 Moving Averages" Indicator allows you to see Fast and Slow Moving Averages of RVI oscillator. PC and Mobile Alerts. - Indicator is great for momentum trading especially on big timeframes: D1, H4, H1, M30. - It is very easy to set up this indicator via parameters, it can be used on any timeframe. - You c
[ZhiBiCCI] indicators are suitable for all cycle use, and are also suitable for all market varieties. [ZhiBiCCI] Green solid line is a reversal of bullish divergence. The green dotted line is a classic bullish divergence. [ZhiBiCCI] The solid line to the red is a reverse bearish divergence. The red dotted line is a classical bearish divergence. [ZhiBiCCI] can be set in the parameters (Alert, Send mail, Send notification), set to (true) to send instant signals to the alarm window, email, insta
ADX Pointer
Dominik Mandok
ADX Pointer is an indicator which is based on "Average Directional Index" and draws three numbers in chart window depending on the value of ADX. In ADX Pointer you can set "ADX_Period" which is of course period of Average Directional Index and you can also set 3 levels. When ADX value exceed first level ("ADX_Level1") in chart window appears number "1", when ADX exceed second level ("ADX_Level2") appears "2" and when ADX exceed third level ("ADX_Level3") appears "3". Simple. ADX Pointer works on
The   Trend Duration Forecast MT4   indicator is designed to estimate the probable lifespan of a bullish or bearish trend. Using a Hull Moving Average (HMA) to detect directional shifts, it tracks the duration of each historical trend and calculates an average to forecast how long the current trend is statistically likely to continue. This allows traders to visualize both real-time trend strength and potential exhaustion zones with exceptional clarity. KEY FEATURES Dynamic Trend Detection:   Uti
Trend Flasher Trend is your friend is the age old saying quote in trading arena, there are though many ways to gauge the trend and its direction, more scientific measure and logically meaningful will be an ATR break outs to identify and spot the trend and its acceleration, so we created this easy to use trend identification panel and optimized super trend based multi time frame panel entry system to aid and help the traders to make their trading decision. Unique Features of Trend Flasher 1. H
VR Cub
Vladimir Pastushak
VR Cub is an indicator for getting high-quality entry points. The indicator was developed to facilitate mathematical calculations and simplify the search for entry points into a position. The trading strategy for which the indicator was written has been proving its effectiveness for many years. The simplicity of the trading strategy is its great advantage, which allows even novice traders to successfully trade with it. VR Cub calculates position opening points and Take Profit and Stop Loss targe
Crypto_Forex   Indicator HTF Ichimoku for MT4. Ichimoku indicator is   one of the most powerful trend indicators . H TF means -   H igher TimeFrame. This indicator is excellent for Trend Traders as well as combination with Price Action entries. HTF Ichimoku  Indicator allows you to attach Ichimoku from higher timeframe to your current chart. Up trend   - red line above blue one (and both lines are above cloud) /  Down trend   - red line below blue one  (and both lines are below cloud). Open BUY
MT Roller Coaster
Issara Seeboonrueang
Graph's roller-coaster MT Roller Coaster : Inspired by the graph's roller-coaster-like movement, this tool uses color bands to signal trends effectively. The band colors simplify order decisions: Downtrend: Bands 2 and 3 turn red, signaling sell opportunities. Uptrend: Bands 2 and 3 appear sky blue, suggesting buy orders. Sideways: Alternating band colors allow both buy and sell trades, suitable for scalping strategies. Major trend entries are identified at the outer bands, with corr
Easy RSI Alerts
Luke Kendall
5 (1)
The Relative Strength Index (RSI) was developed by J. Welles Wilder and is a momentum oscillator that identifies overbought and oversold conditions. It is also a popular choice for many traders helping them find entries into the market. How it Works The simplest way to use the Relative Strength Index is to wait for an overbought or oversold condition and then enter into a trade when the RSI indicates that price is resuming in the dominant direction of the trend. Buy signals : For the first cond
Auto Fibo Pro m
DMITRII GRIDASOV
"Auto FIBO Pro"   Crypto_Forex  indicator  - is great auxiliary tool in trading! Indicator automatically calculate and place on chart Fibo levels and local trend lines (red color). Fibonacci levels indicate key areas where price can reverse. Most important levels are 23.6%, 38.2%, 50% and 61.8%. You can use it   for reversal scalping  or for zone grid trading. There are plenty of opportunities to  improve your current system using Auto FIBO Pro indicator as well. It has Info Spread Swap Displa
Fractal Zig Zag
Mikhail Nazarenko
A   professional version of the ZigZag indicator for visualizing the structure of price movements by fractals. Fractal ZigZag fixes the flaws of the standard version of the ZigZag indicator MT4. It uses Price action and a unique filtering algorithm to determine fractals. Suitable for all types of trading. Ideal for trading according to the WM pattern "Sniper" strategy !!! Features Marks the place of price reversal during the formation of a new fractal with specified parameters. Suitable for al
Chart Patterns Detect 15 patterns (Ascending Triangle, Descending Triangle, Rising Wedge, Falling Wedge, Bullish Flag, Bearish Flag, Bullish Rectangle, Bearish Rectangle Symmetrical triangle, Head and Shoulders, Inverted Head and Shoulders, Triple top, Triple Bottom, Double Top, Double Bottom) Use historical data to calculate the probability of each pattern to succeed (possibility to filter notification according to the chance of success) gives graphic indication about the invalidation level and
LordAutoFibonnaci
Igor Pereira Calil
5 (2)
Lord Auto Fibonnaci is a free indicator for Meta Trader, in order to show the most famous chart in the financial market known as "Fibonnaci". As we can see in the images below, the fibonnaci table will automatically analyze the graph for you, with trend factors through percentage, almost infallible use, you can always work when the percentage is low or high, start shopping and sales on time, great for analyzing entries! In the images below we can see an example in gold in H4, where we are at
FREE
Voles Indicator Operation Principles It is based on the standard indicators of the MetaTrader 4 terminal. It shows the market entry points. How to trade When a bar is complete and an arrow is shown, place a BuyStop order at the High of the bar is the arrow is green, or a SellStop order at the Low of the bar if the arrow is red. StopLoss should be set at the level of the last downwards fractal below the entry point at a green arrow or at the level of the last upwards fractal above the entry poi
MACD Divergence MT4
KEENBASE SOFTWARE SOLUTIONS
KT MACD Divergence shows the regular and hidden divergences build between the price and oscillator. If your trading strategy anticipates the trend reversal, you can include the MACD regular divergence to speculate the potential turning points. And if your trading strategy based on the trend continuation, MACD hidden divergence would be a good fit. Limitations of KT MACD Divergence Using the macd divergence as a standalone entry signal can be a risky affair. Every divergence can't be interprete
Wave Wolf MT4
Andrei Salanevich
The Wave Wold MT4 Forex indicator is designed to search for Wolf waves and display them in the current window of the trading terminal. An excellent indicator for traders who use Wolf waves in trading. Its application in trading strategies will significantly increase their efficiency and profitability. INFORMATION ABOUT THE INDICATOR Unlike other Wolf wave indicators, the Wave Wold MT4 forex indicator has a number of features that significantly increase its effectiveness: The first is the Ope
EZZ Zig Zag MT4
Paulo Rocha
5 (1)
EZZ Elite Zig Zag is an indicator for the MetaTrader 4 terminal. This indicator traces the peak of the trend based on the market reversal, thus showing various opportunities in the financial market. EZZ Elite Zig Zag is a visual tool, intuitive, and easy to understand and use.  Test it Yourself by Downloading it for Free. Author Paulo Rocha all rights reserved
Crosskalp1
Mikhail Bilan
Добрый День уважаемые трейдеры!  Вашему вниманию индикатор созданный и работающий на базе трендовика ADX,  для торговли на смене направления движения который учитывает коррекцию и даёт возможность на ней заработать.  Применяю этот индикатор для скальпинга. Рекомендую таймфреймы от 15 ти минутного(М15) до часового (Н1) периодов.  Красный кружок сигнал на продажу- Sell) Зелёный кружок  сигнал на покупку Buy) Чем меньше ваш таймфрейм тем меньше пунктов вы зарабатываете.   Важно выставлять стопы! !В
Buyers of this product also purchase
Gann Made Easy
Oleg Rodin
4.83 (162)
Gann Made Easy is a professional and easy to use Forex trading system which is based on the best principles of trading using the theory of W.D. Gann. The indicator provides accurate BUY and SELL signals including Stop Loss and Take Profit levels. You can trade even on the go using PUSH notifications. PLEASE CONTACT ME AFTER PURCHASE TO GET TRADING  INSTRUCTIONS AND GREAT EXTRA INDICATORS   FOR FREE! Probably you already heard about the Gann trading methods before. Usually the Gann theory is a ve
M1 Sniper
Oleg Rodin
5 (22)
M1 SNIPER is an easy to use trading indicator system. It is an arrow indicator which is designed for M1 time frame. The indicator can be used as a standalone system for scalping on M1 time frame and it can be used as a part of your existing trading system. Though this trading system was designed specifically for trading on M1, it still can be used with other time frames too. Originally I designed this method for trading XAUUSD and BTCUSD. But I find this method helpful in trading other markets a
PRO Renko System
Oleg Rodin
5 (30)
PRO Renko System is a highly accurate trading system specially designed for trading RENKO charts. The ARROWS and Trend Indicators DO NOT REPAINT! The system effectively neutralizes so called market noise giving you access to accurate reversal signals. The indicator is very easy to use and has only one parameter responsible for signal generation. You can easily adapt the tool to any trading instrument of your choice and the size of the renko bar. I am always ready to provide extra support to help
Market Makers
Mohamed Hassan
5 (3)
After purchase, contact me privately to receive 1 month of free testing with EA Forex Proton! This advanced MT4 trading robot automatically executes signals from any MT4 indicator, including Market Makers. The latest version also includes AI integration, allowing each trade signal to be analyzed using Artificial Intelligence. Live Signal with EA Forex Proton: Click here Market Makers is a powerful price action trading system designed to identify high-probability Buy and Sell opportunities based
Trend Screener
STE S.S.COMPANY
4.79 (95)
Trend Screener Indicator --Professional Trend Trading & Market Scanning System for MetaTrader Unlock the true power of trend trading with Trend Screener Indicator — a complete multi-currency, multi-timeframe trend analysis solution   powered by Fuzzy Logic,Trend Pulse Technology  and advanced market structure algorithms.   Trend Screener transforms your MetaTrader platform into a professional-grade Trend Analyzer and Market Scanner, helping you identify high-probability trend opportunities, ear
GoldRush Trend Arrow Signal V1.6 The GoldRush Trend Arrow Signal indicator V1.6 continues to provide precise, real-time trend analysis tailored for high-speed, short-term scalpers in XAU/USD , but it now has additional features and improved efficiency and reliability. Built specifically for the 1-minute time frame, this tool displays directional arrows for clear entry points, allowing scalpers to navigate volatile market conditions with confidence. The indicator consists of PRIMARY and SECONDARY
NAM Divergences
NAM TECH GROUP, CORP.
5 (1)
MT4 Multi-timeframe Divergence and Overbougt/Oversold detection indicator. Features - Fully customizable on chart control panel, provides complete interaction. - Hide and show control panel wherever you want. - Real time information about non-capitalized divergences. - Real time information about overbougt / oversold situations. - Real time information about regular divergences. - Real time information about hidden divergences. - Oscillators available for divergences detection: AO, RSI, CCI, MA
Super Signal – Skyblade Edition Professional No-Repaint / No-Lag Trend Signal System with Exceptional Win Rate | For MT4 / MT5 It works best on lower timeframes, such as 1-minute, 5-minute, and 15-minute charts. Core Features: Super Signal – Skyblade Edition is a smart signal system designed specifically for trend trading. It applies a multi-layered confirmation mechanism to detect only strong, directional moves supported by real momentum. This system does not attempt to predict tops or bottoms
Advanced Supply Demand
Bernhard Schweigert
4.91 (299)
Trading Special – 40% OFF Best Solution for any Newbie or Expert Trader! This indicator is a unique, high quality and affordable trading tool because we have incorporated a number of proprietary features and a new formula. With this update, you will be able to show double timeframe zones. You will not only be able to show a higher TF but to show both, the chart TF, PLUS the higher TF: SHOWING NESTED ZONES. All Supply Demand traders will love it. :) Important Information Revealed Maximize the pot
Scalper Inside PRO
Alexey Minkov
4.74 (69)
Scalper Inside PRO – Since 2020. An exclusive indicator that utilizes an innovative algorithm to swiftly and accurately determine the market trend. The indicator automatically calculates opening, closing, and profit levels, providing detailed trading statistics. With these features, you can choose the most appropriate trading instrument for the current market conditions. Additionally, you can easily integrate your own arrow indicators into Scalper Inside Pro to quickly evaluate their statistics
The " Dynamic Scalper System " indicator is designed for the scalping method of trading within trend waves. Tested on major currency pairs and gold, compatibility with other trading instruments is possible. Provides signals for short-term opening of positions along the trend with additional price movement support. The principle of the indicator. Large arrows determine the trend direction. An algorithm for generating signals for scalping in the form of small arrows operates within trend waves.
Apollo SR Master is a Support/Resistance indicator with special features which make trading with Support/Resistance zones easier and more reliable. The indicator calculates Support/Resistance zones in real-time without any time lag by detecting local price tops and bottoms. Then to confirm the newly formed SR area, the indicator shows special signal which signalizes that the SR zone can be taken into consideration and used as an actual SELL or BUY signal. In this case the strength of the SR zone
Trading Special –40% OFF Best Solution for any Newbie or Expert Trader! This Indicator is a unique, high quality and affordable trading tool because we have incorporated a number of proprietary features and a new formula. With only ONE chart you can read Currency Strength for 28 Forex pairs! Imagine how your trading will improve because you are able to pinpoint the exact trigger point of a new trend or scalping opportunity? User manual: click here That's the first one, the original! Don't buy a
Ultimate Sniper Dashboard
Hispraise Chinedum Abraham
4.82 (22)
Currently on massive July Discount! Prices will increase in the future! Read description below! Once you purchase, send a message to my inbox for manual and starter kit. Best Entry System for Ultimate Sniper Dashboard: ULTIMATE DYNAMIC LEVELS. (Please Check my products) The Ultimate Sniper Dashboard ONLY works on live markets due to MT4 multicurrency testing limits. Introducing the Ultimate-Sniper Dashboard! Our very best which contains both HA-Sniper, MA-Sniper. and many special modes. The Ul
Currency Strength Wizard is a very powerful indicator that provides you with all-in-one solution for successful trading. The indicator calculates the power of this or that forex pair using the data of all currencies on multiple time frames. This data is represented in a form of easy to use currency index and currency power lines which you can use to see the power of this or that currency. All you need is attach the indicator to the chart you want to trade and the indicator will show you real str
BTMM State Engine Pro is a MetaTrader 4 indicator for traders who use the Beat The Market Maker approach: Asian session context, kill zone timing, level progression, peak formation detection, and a multi-pair scanner from a single chart. It combines cycle state logic with a built-in scanner dashboard so you do not need the same tool on many charts at once. What it does Draws the Asian session range; session times can follow broker server offset or be set in inputs. Tracks level progression (L
KT Alpha Hunter Arrows MT4
KEENBASE SOFTWARE SOLUTIONS
Most arrow indicators give you a signal and leave you to figure out the rest. KT Alpha Hunter Arrows gives you the full trading plan. Every signal arrow prints with a full plan already drawn: entry line, stop-loss, four take-profit levels, and a live edge verdict telling you whether this symbol and time-frame is worth trading right now. An included Trade Manager EA handles the execution after you enter, so discipline stays intact when the market gets loud. Non-repaint. Closed-bar signals only. B
- Real price is 80$ - 50% Discount (It is 39$ now) - just for 2 purchases. Contact me for instruction, add group and any questions! - Non-repaint - I just sell my products in Elif Kaya profile, any other websites are stolen old versions, So no any new updates or support. - Lifetime update free Related product:   Bitcoin Expert Introduction The breakout and retest strategy is traded support and resistance levels. it involves price breaking through a previous level.  The break and retest strateg
Atomic Analyst
Issam Kassas
5 (5)
First of all Its worth emphasizing here that this Trading Indicator is   Non-Repainting , Non Redrawing and Non Lagging Indicator   Indicator, Which makes it ideal from both manual and robot trading.  User manual: settings, inputs and strategy . The Atomic Analyst  is a PA Price Action Indicator that uses Strength and Momentum of the price to find a better edge in the market. Equipped with Advanced filters which help remove noises and false signals, and Increase Trading Potential. Using Multiple
Dynamic Forex28 Navigator
Bernhard Schweigert
4.43 (7)
Specials Discount now. The Next Generation Forex Trading Tool. Dynamic Forex28 Navigator is the evolution of our long-time, popular indicators, combining the power of three into one: Advanced Currency Strength28 Indicator (695 reviews) + Advanced Currency IMPULSE with ALERT (520 reviews) + CS28 Combo Signals (recent Bonus) Details about the indicator  https://www.mql5.com/en/blogs/post/758844 What Does The Next-Generation Strength Indicator Offer? Everything you loved about the originals, now
Trading Special – 40% OFF Best Solution for any Newbie or Expert Trader! This indicator is a unique, high quality and affordable trading tool because we have incorporated a number of proprietary features and a secret formula. With only ONE chart it gives Alerts for all 28 currency pairs. Imagine how your trading will improve because you are able to pinpoint the exact trigger point of a new trend or scalping opportunity! Built on new underlying algorithms it makes it even easier to identify and c
Auto Optimized Parabolic RSI: Advanced 3D Momentum Engine Most retail indicators fail because they rely on static inputs that break the moment market volatility shifts. Auto Optimized Parabolic RSI solves the problem of "indicator decay" by continuously recalculating its own mathematical edge, bringing institutional-grade quantitative adaptation directly to your MT5 terminal. The Core Advantage: Custom In-Memory 3D Optimization   Standard auto-optimizers often freeze the MT5 platform because the
FX Volume
Daniel Stein
4.63 (38)
FX Volume: Experience Genuine Market Sentiment from a Broker’s Perspective Quick Overview Looking to elevate your trading approach? FX Volume provides real-time insights into how retail traders and brokers are positioned—long before delayed reports like the COT. Whether you’re aiming for consistent gains or simply want a deeper edge in the markets, FX Volume helps you spot major imbalances, confirm breakouts, and refine your risk management. Get started now and see how genuine volume data can
TPSpro RFI Levels
Roman Podpora
4.86 (28)
INSTRUCTIONS RUS   /   INSTRUCTIONS   ENG   -   VERSION  MT5 Main functions: Displays active zones of sellers and buyers! The indicator displays all the correct first impulse levels/zones for purchases and sales. When these levels/zones are activated, where the search for entry points begins, the levels change color and are filled with certain colors. Arrows also appear for a more intuitive perception of the situation. LOGIC AI - Display of zones (circles) for searching entry points when activa
Cycle Sniper
Elmira Memish
4.39 (36)
Please contact us after your purchase and we will send you the complimentary indicators to complete the system Cycle Sniper is not a holy grail but when you use it in a system which is explained in the videos, you will feel the difference. If you are not willing to focus on the charts designed with Cycle Sniper and other free tools we provide, we recommend not buying this indicator. We recommend watching the videos about the indiactor and system before purchasing. Videos, settings  and descri
Volatility Trend System - a trading system that gives signals for entries. The volatility system gives linear and point signals in the direction of the trend, as well as signals to exit it, without redrawing and delays. The trend indicator monitors the direction of the medium-term trend, shows the direction and its change. The signal indicator is based on changes in volatility and shows market entries. The indicator is equipped with several types of alerts. Can be applied to various trading ins
Route Lines Prices is an indicator designed for finding price directions. Its simple interface contains multiple algorithms for price behavior and future direction calculations. These algorithms include volatility calculations and price smoothing based on the timeframes used. The indicator has a single parameter for changing the " Calculating Price Values " value. The default value of 1 provides a balanced automatic calculation, which can be used without manually configuring the indicator. By m
Trend indicator AI
Ramil Minniakhmetov
4.53 (83)
Trend Ai indicator is great tool that will enhance a trader’s market analysis by combining trend identification with actionable entry points and reversal alerts.  This indicator empowers users to navigate the complexities of the forex market with confidence and precision Beyond the primary signals, Trend Ai indicator identifies secondary entry points that arise during pullbacks or retracements, enabling traders to capitalize on price corrections within the established trend. Important Advantage
GOLD Impulse with Alert
Bernhard Schweigert
4.67 (12)
This indicator is a super combination of our 2 products  Advanced Currency IMPULSE with ALERT  and  Currency Strength Exotics . It works for all time frames and shows graphically impulse of strength or weakness for the 8 main currencies plus one Symbol! This Indicator is specialized to show currency strength acceleration for any symbols like Gold, Exotic Pairs, Commodities, Indexes or Futures. Is first of its kind, any symbol can be added to the 9th line to show  true currency strength accelerat
Stop Guessing. Start Trading with a Statistical Edge. Stock indices don't trade like forex. They have defined sessions, they gap overnight, and they follow predictable statistical patterns. This indicator gives you the probability data you need to trade indices like the DAX, S&P 500, and Dow Jones with confidence. What Makes This Different Most indicators show you what happened. This one shows you what's likely to happen next.  Every trading day, the indicator analyses your current setup against
More from author
Очень точный индикатор, с  его помощью очень легко определять барные паттерны. Это очередная разновидность ЗигЗага, за исключением, он не рисует текущую линию, которая может перерисоваться,если нарисовал конечную точку, по закрытому бару, то больше ее не изменяет - это означает смену направления и следующая точка будет другого цвета. Может быть применен как для определения основного движения, при использовании увеличенных параметров, так и непосредственно для входа с минимальным риском. Очень х
The indicator is based on MA with additional processing of all the current prices, as well as all Highs and Lows for an appropriate period. The product efficiently displays trend changes and tracks a trend line and color if conditions remain unchanged. The indicator has only three parameters making it easy to configure. Parameters PeriodTrend  - amount of bars used for a trend calculation PeriodAverage - indicator line averaging period Method - averaging method
The indicator shows the exact price position in the current market on any symbol. It shows the trend direction on the current chart as well as on the two subsequent higher timeframes at the same time (from top to bottom). For example, you can observe the trend direction on M5 and M15 without leaving the M1 chart. The indicator switches all trend depending on the market conditions preventing you from entering against a trend or allowing you to exit a position in a timely manner. The indicator is
This indicator shows the current market situation relative to the price volatility channel, its external and internal boundaries, displays the last direction of the price movement. The main purpose of the indicator is to identify the trend movement and its boundaries. With a wide channel, it can be used for determining the initial price movement waves. It works on any instrument and any time frame of the chart. It works in 2 different modes: The first mode shows any changes in the channel when t
The oscillator shows reversal points and the movement strength very well. It can be used on any symbol and any timeframe. It has a parameter of the level when the signal reaches the required power. The indicator is very easy to setup. Indicator bars are not redrawn. Description of the Parameters PeriodPower - signal power calculation period LevelPower - the required level of the signal power
Индикатор очень своевременно показывает изменение направления рынка на любом инструменте.   Более того, этот индикатор мультитаймфреймовый, что позволяет увидеть на текущем периоде графика смену направления движения рынка с более старшего таймфрейма. Стрелка вверх сигнализирует о восходящем движении, стрелка вниз - о нисходящем. Каждая стрелка имеет свою ценовую составляющую, равную(как правило) значению экстремума на используемом таймфрейме, что можно использовать в качестве установки стоповых
Индикатор очень своевременно показывает входы в рынок на любом инструменте.  Каждая стрелка имеет свою ценовую составляющую, равную(как правило) значению экстремума на используемом таймфрейме, что можно использовать в качестве установки стоповых ордеров или других действий при применении индикатора в советниках. Индикатор имеет минимальное количество параметров, позволяющих без особого труда настроить его работу. Параметр Level_Open  отвечает за скорость выдачи сигнала. Чем больше этот параметр
Новая серия индикаторов Veles Dynamic.     Индикаторы не перерисовывают своих значений. Эти индикаторы работают быстрее и точнее аналогичных по названию. Индикатор Veles_dMACD представляет собой разницу показаний между двух динамических МА, рассчитанных по текущим ценам инструмента. Хорошо показывает разворотные моменты, позволяет точно определять дивергенции. Имеет цветовое сопровождение изменения показаний. Параметры: period_Fast - период быстрой динамической МА period_Slow  - период медлен
Новая серия индикаторов Veles Dynamic.     Индикаторы не перерисовывают своих значений. Эти индикаторы работают быстрее и точнее аналогичных по названию. Индикатор Veles_dChannel представляет собой динамическую МА с расчетным каналом по текущим ценам инструмента. Индикатор показывает полностью законченное движение в цикле. Данный индикатор может использоваться в качестве установки и траллирования стопов при скальпинге.  Параметры: period - период динамической МА price - применяемая цена shif
Новая серия индикаторов Veles Dynamic.     Индикаторы не перерисовывают своих значений. Эти индикаторы работают быстрее и точнее аналогичных по названию. Индикатор Veles_dTrend представляет собой гистограмму, рассчитанную на основе нескольких динамических алгоритмов, использующих текущие цены инструмента. Пока индикатор не покажет смену тренда, будьте уверены, что тренд продолжит свое направление. Кроме этого, есть зоны принятия решения, которые ограниченны уровнями.В этих зонах будет самый
Этот индикатор - очередная разновидность ЗигЗага, за исключением, он не рисует текущую линию, которая может перерисоваться. Этот индикатор, если нарисовал конечную точку, по закрытому бару, то больше ее не изменяет - это означает смену направления и следующая точка будет другого цвета. Может быть применен как для определения основного движения, при использовании увеличенных параметров, так и непосредственно для входа с минимальным риском.Очень хорошо показывает все волны. Работает с любым инстру
Индикатор iVeles_Channel_Extremum_II_MTF вычисляет точки слома направлений движения цены на установленном в параметрах ТФ, на основе этих точек и выбранного их количества строится основной канал цены, который можно использовать в качестве уровней поддержки и сопротивления для меньшего ТФ, на котором установлен индикатор. В зависимости от направления движения основного тренда рассчитывается средняя линия канала по уровню Фибоначи, от которой, как правило, идет отскок в сторону тренда. Также по ур
Индикатор iVeles_MACD_Pro представляет симбиоз обычного индикатора MACD или  разницу показаний между двух динамических МА, рассчитанных по текущим ценам инструмента. Сигнальная линия отсутствует, но ее заменяет более точные динамические облачные уровни. Хорошо показывает разворотные моменты, позволяет точно определять дивергенции. Имеет цветовое сопровождение изменения показаний. Параметры: period_Fast - период быстрой МА period_Slow    - период медленной МА price_Bar - применяемая цена level -
Veles RSI
Gennady Mazur
Индикатор iVeles_RSI представляет собой  обычный  RSI, привязанный к нулевой отметке . В отличии от обычного RSI, наложены уровни сигнала в виде облака, что заметно расширяет области применения данного индикатора. Очень хорошо показывает разворотные моменты, так же позволяет точно определять дивергенции. Параметры: period - период RSI price - применяемая цена level - уровень облака
Veles RVI
Gennady Mazur
Индикатор iVeles_RVI представляет собой  обычный  RVI, с пересчитанными и приведенными значениями . В отличии от обычного RVI, наложены уровни сигнала в виде облака, что заметно расширяет области применения данного индикатора. Очень хорошо показывает разворотные моменты и циклы тенденций, так же позволяет определять дивергенции. Параметры: period - период RVI price - применяемая цена level - уровень облака
Индикатор iVeles_DeMarker представляет собой  обычный  DeMarker, с пересчитанными и приведенными к нулю значениями . В отличии от обычного DeMarker, наложены уровни сигнала в виде облака, что заметно расширяет области применения данного индикатора. Очень хорошо показывает разворотные моменты и циклы тенденций, так же позволяет определять дивергенции. Параметры: period - период DeMarker level - уровень облака
Veles CCI
Gennady Mazur
Индикатор iVeles_CCI представляет собой  обычный  CCI . В отличии от обычного CCI, наложены уровни сигнала в виде облака, что заметно расширяет области применения данного индикатора. Очень хорошо показывает окончание трендов, разворотные моменты и циклы тенденций, так же позволяет определять дивергенции. Параметры: period - период CCI price - применяемая цена level - уровень облака
Индикатор iVeles_Moment представляет собой  обычный  Momentum, с пересчитанными и приведенными к нулю значениями . В отличии от обычного Momentum, наложены уровни сигнала в виде облака, что заметно расширяет области применения данного индикатора. Очень хорошо показывает разворотные моменты и циклы тенденций, может применяться как основной сигнал для входа в позицию. Параметры: period - период Momentum price - применяемая цена level - уровень облака
Индикатор iVeles_Trend_X_II - использует специализированный расчет текущих цен графика. Очень качественно и своевременно показывает смену направления, более того, отображаемая цена индикатора может быть использован в качестве уровня принятия решения. Работает качественно на любом ТФ и с любым инструментом. Параметры: period - период расчетов average   - усреднение  МА method - применяемый метод shift - сдвиг показаний
Индикатор iVeles_Perfect_Oscilator является опережающим и одним из самых лучших осциляторов на сегодняшний день,  использует специализированный расчет текущих цен графика.  Очень качественно и своевременно показывает смену направления, очень точный подход к уровням перекупленности и перепроданности, что позволяет своевременно принять решение по сделке.  Работает качественно на любом ТФ и с любым инструментом. Параметры: period_Osc - период расчетов average_Osc  - усреднение  МА method_Osc - прим
Индикатор iVeles_Perfect_Oscilator является опережающим и одним из самых лучших осциляторов на сегодняшний день,  использует специализированный расчет текущих цен графика.  Очень качественно и своевременно показывает смену направления, очень точный подход к уровням перекупленности и перепроданности, что позволяет своевременно принять решение по сделке.  Работает качественно на любом ТФ и с любым инструментом. Параметры: Period - период расчетов Average  - усреднение  МА Method - применяемый мето
Представлен принципиально новый индикатор ZigZag, который отличается от стандартного абсолютной легкостью, быстродействием расчетов и очень высокой точностью. В основе индикатора заложен принцип цикличности рынка с совокупностью анализа количества текущих баров и их основных ценовых уровней. Чем меньше баров для определения расчетов, тем более агрессивная постройка линий индикатора. Как и в  стандартном индикаторе перерисовывается только последняя линия, при изменении достигнутого экстремума. П
Данная утилита позволяет осуществлять полноценную торговлю в ручном режиме в тестере. Это особенно необходимо для тестирования своих стратегий торговли, без открытия счета и совершенно без риска. Кроме этого утилитой можно пользоваться и при обычной торговле на счете. Открытие любого количества позиций (при условии достаточности маржи) в любом направлении. Закрытие всех позиций по направлению или вообще всех открытых позиций счета с данным магическим числом. Параметры: Volume - объем сделки Mag
Советник-утилита "Veles Custom Chart" создает выбранный один из 3-ех персональный график движения цены в режиме реального времени. Возможно создание временного графика с длительностью свечи не минуты, а равного заданному числу секунд, тикового графика, где размер и длительность бара определяется количеством тиков в баре или тикового объема, и ренко графика по размеру кирпичика бара, при чем этот график полностью повторяет структуру движения цены, отрисовывая противоположные тени цены. Графики о
Filter:
No reviews
Reply to review