MACDivergence MTF
- Indicators
- Pavel Zamoshnikov
- Version: 1.42
- Updated: 17 November 2021
- Activations: 10
Advanced ideas of the popular MACD indicator:
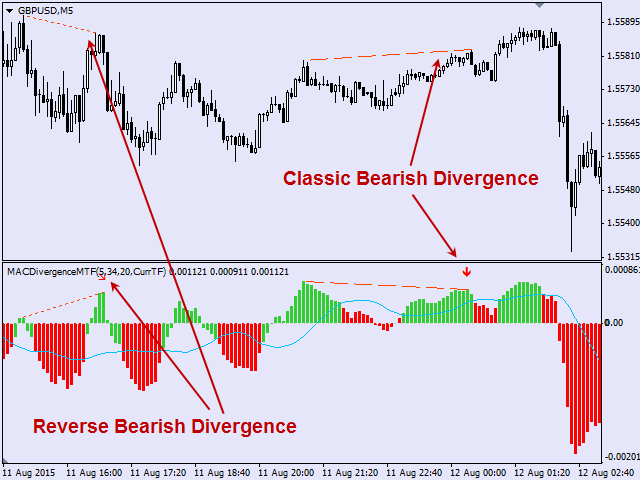
- It detects and displays classic and reverse divergences (three methods of detecting divergences).
- It uses different color to highlight an uptrend and a downtrend.
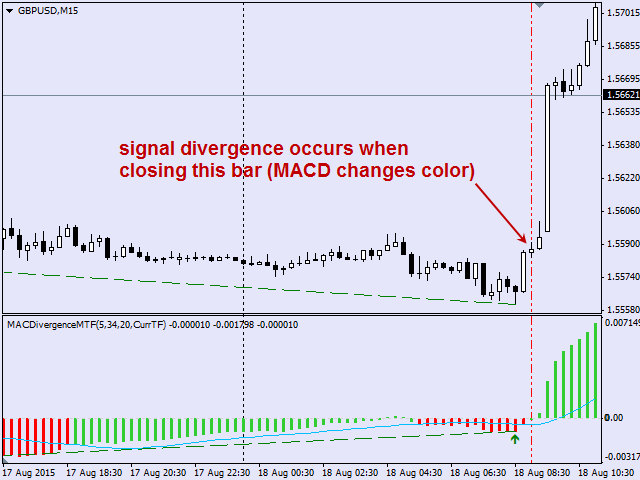
- Two methods of determining a trend: а) MACD crosses the 0 level (classic signal); б) MACD crosses its own average (early signal).
- This is a multi-timeframe indicator: it can display MACD data from other timeframes.
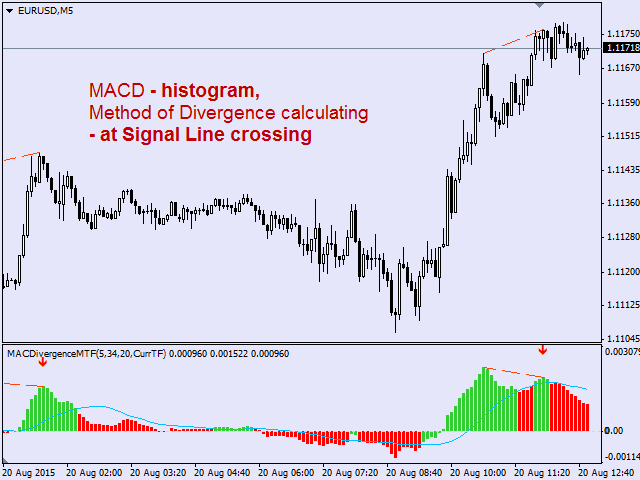
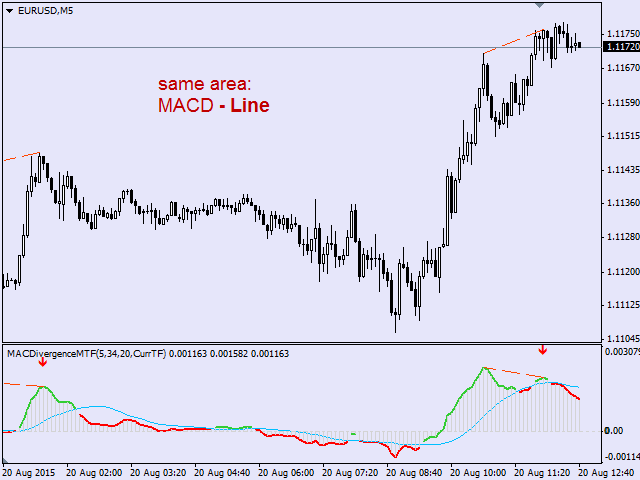
- Two methods of drawing: classic histogram and line.
- It generates sound and visual signals when the trend is changed and the divergence is formed. It sends emails and push-notifications to mobile devices.
You can test the functionality of the program by downloading the test version from the Comments tab
Parameters:
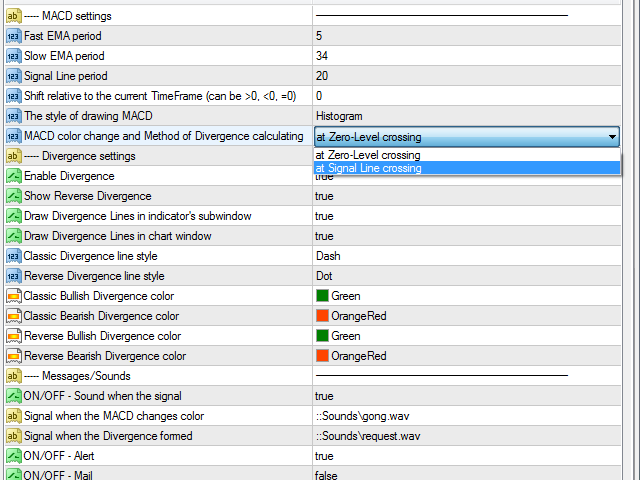
MACD Parameters
- Fast EMA period - fast EMA period.
- Slow EMA period - slow EMA period.
- Signal Line period - signal line period.
- Shift relative to the current TimeFrame (can be >0, <0, =0) - shift of the timeframe relatively to the current TF. 1 means higher by 1, 2 - higher by 2. -1 means lower by 1 period etc. For example, when the current period is M15, if you set the parameter to 1, the indicator will display MACD data on M30, and if you set it to -1, the indicator will display MACD data on M5.
- The style of drawing MACD - way of drawing MACD (histogram or line).
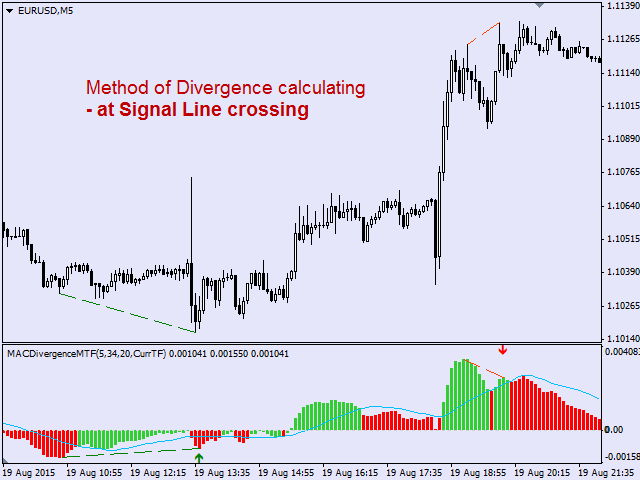
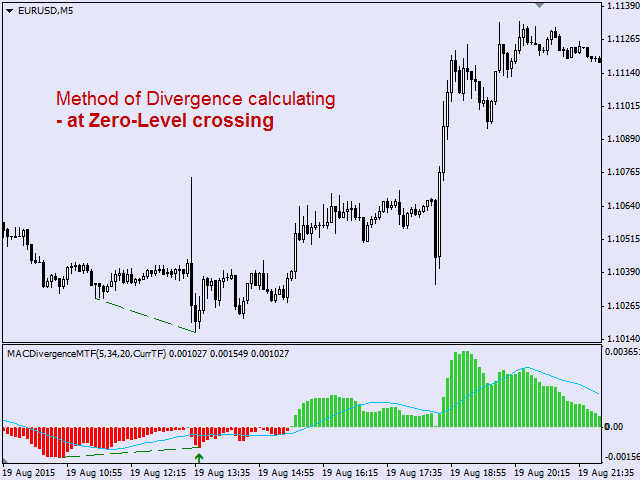
- MACD color change and Method of Divergence calculating - methods of determining a trend (MACD changes color) and detecting divergences (crossing the zero level (classic method) or crossing the signal line (earlier signal).
- the Elder's method - method offered by Elder in his work "The Strongest Signal in Technical Analysis" (MACD and 0 crossing, the end of a peak/bottom is a bar following the extremum) - signals are activated earlier, but the number of false ones is increased;
- at simple Zero-Level crossing - simple MACD and 0 crossing (standard version) - accurate signals with a considerable delay;
- at Signal Line crossing - MACD and signal line crossing (optimal version) - accurate signals with a small delay.
Divergence Display
- Enable Divergence - enable/disable display of divergences
- Show Reverse Divergence - display reverse divergences
- Draw Divergence Lines in indicator's subwindow - if allowed, divergences will be also displayed as lines in the indicator's window (complementary to signal arrows).
- Draw Divergence Lines in chart window - displaying divergence lines in the main window.
- Classic Divergence line style - style of classic divergence lines.
- Reverse Divergence line style - style of reverse divergence lines.
- Classic Bullish Divergence color - color of classic bullish divergence.
- Classic Bearish Divergence color - color of classic bearish divergence.
- Reverse Bullish Divergence color - color of reverse bullish divergence.
- Reverse Bearish Divergence color - color of reverse bearishClassic Bearish Divergence color - color of classic bearish divergence. divergence.
Notifications and Alerts
- ON/OFF – Sound when the signal sound signal
- Signal when the MACD changes color – name of the sound file played when the trend is changed (MACD changes color).
- Signal when the Divergence formed – name of the sound file played when divergence is formed.
- ON/OFF - Alert – enable/disable in the terminal when signals emerge
- ON/OFF - Mail – sending emails
- ON/OFF - Push – sending push notifications to mobile devices
Other Settings
- Language – language of messages (English or Russian)


This product is extremely good value for money. Warmly recommended