Veles MACD Pro

  • Indicators
  • Gennady Mazur
    Gennady Mazur
    • Разработчик экспертных систем для Форекс at  Veles-FX
    • Russia
    • 4623
    3.9 (17)
    Практикующий трейдер, программист MQL4, MQL5.
    С 2000 года на рынке Форекс, c 2005 года программист на языке MQL4.
    В 2006 году написал свои первые индикаторы и советники Форекс на заказ.
    Общую известность мне принес мультивалютный советник MultiIlan, написанный в 2011 году.
  • Version: 1.0
  • Activations: 5

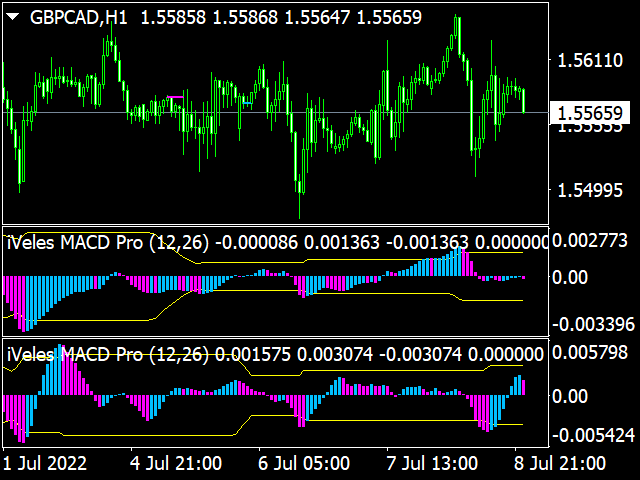
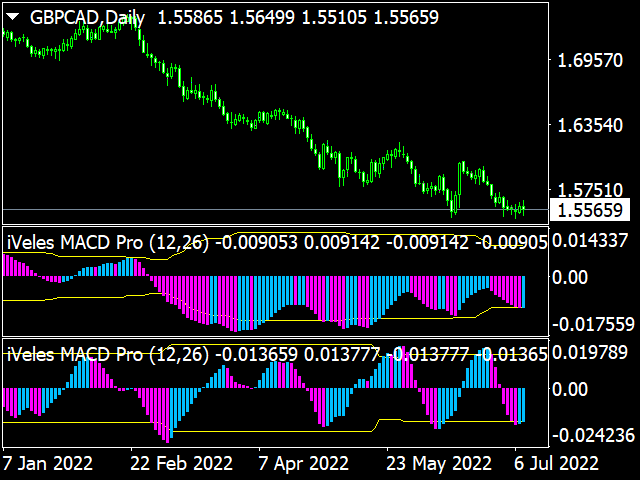
Индикатор iVeles_MACD_Pro представляет симбиоз обычного индикатора MACD или разницу показаний между двух динамических МА, рассчитанных по текущим ценам инструмента. Сигнальная линия отсутствует, но ее заменяет более точные динамические облачные уровни.
Хорошо показывает разворотные моменты, позволяет точно определять дивергенции. Имеет цветовое сопровождение изменения показаний.

Параметры:

  • period_Fast - период быстрой МА
  • period_Slow  - период медленной МА
  • price_Bar - применяемая цена
  • level - уровень облака
  • mode_Dinamic - включение динамического расчета


Recommended products
Dear traders this is Our new Indicator called Hull Pro MTF Indicator — Precision Multi-Timeframe Trend Visualizer Overview The Hull Pro MTF Indicator is a next-generation Heiken-Ashi-based multi-timeframe visual tool designed for top-down market analysis . It blends the power of Hull Moving Average (HMA) logic and multi-level Heiken-Ashi smoothing to reveal directional bias, volatility ranges, and price symmetry across hourly, daily, weekly, monthly, and yearly structures — all in a single c
Easy RSI Alerts
Luke Kendall
5 (1)
The Relative Strength Index (RSI) was developed by J. Welles Wilder and is a momentum oscillator that identifies overbought and oversold conditions. It is also a popular choice for many traders helping them find entries into the market. How it Works The simplest way to use the Relative Strength Index is to wait for an overbought or oversold condition and then enter into a trade when the RSI indicates that price is resuming in the dominant direction of the trend. Buy signals : For the first cond
Binary Options Support Resistance Indicator This indicator is designed for binary options trading and effectively shows retracements from support and resistance levels. Signals appear on the current candle. A red arrow pointing downwards indicates a potential selling opportunity, while a blue arrow pointing upwards suggests buying opportunities. All that needs adjustment is the color of the signal arrows. It is recommended to use it on the M1-M5 timeframes as signals are frequent on these timef
An accurate MACD indicator is available. Dashboard Trend Bar Smart Level 9TF Dual MACD. Dual MACD , i.e Fast (MACD 1) & Slow (MACD 2) Why you need second MACD? Using additional indicators will convince us more in live trading 9TF Fast MACD 1 curve 9TF Slow MACD 2 curve 9TF real time  MACD angle 9TF real time MACD value 9TF real time MACD direction/phase 9TF Trend Bar   New algo in calculating trend bar On/off Button . Very useful to show/hide indicator in just one click Real time 9TF dashboard m
ADX Pointer
Dominik Mandok
ADX Pointer is an indicator which is based on "Average Directional Index" and draws three numbers in chart window depending on the value of ADX. In ADX Pointer you can set "ADX_Period" which is of course period of Average Directional Index and you can also set 3 levels. When ADX value exceed first level ("ADX_Level1") in chart window appears number "1", when ADX exceed second level ("ADX_Level2") appears "2" and when ADX exceed third level ("ADX_Level3") appears "3". Simple. ADX Pointer works on
MT Roller Coaster
Issara Seeboonrueang
Graph's roller-coaster MT Roller Coaster : Inspired by the graph's roller-coaster-like movement, this tool uses color bands to signal trends effectively. The band colors simplify order decisions: Downtrend: Bands 2 and 3 turn red, signaling sell opportunities. Uptrend: Bands 2 and 3 appear sky blue, suggesting buy orders. Sideways: Alternating band colors allow both buy and sell trades, suitable for scalping strategies. Major trend entries are identified at the outer bands, with corr
Indicator for determining the trend. The arrows and lines on the chart show the price reversal and the probable current trend or correction. You should always trade in the direction of the arrow. It is best to use the indicator on several time frames at once and enter the market when all time frames have the same arrow. For example, we open a sell trade if there is a red arrow on the M5, M30 and H4 timeframes. Or we open a buy deal if the indicator shows a blue arrow on all timeframes. Advanta
The indicator is designed to determine the momentum of the price. The Stochastic is recommended to be used during the lateral movement phase together with other indicators. However, some Stochastic signals have worked well in the trending market. Overbought and oversold zones Oscillator zones above 80% and below 20% are called overbought and oversold zones, respectively. When the price enters the overbought zone (that is, trades near the upper border of the range), if it bounces down, then w
Crypto_Forex   Indicator HTF Ichimoku for MT4. Ichimoku indicator is   one of the most powerful trend indicators . H TF means -   H igher TimeFrame. This indicator is excellent for Trend Traders as well as combination with Price Action entries. HTF Ichimoku  Indicator allows you to attach Ichimoku from higher timeframe to your current chart. Up trend   - red line above blue one (and both lines are above cloud) /  Down trend   - red line below blue one  (and both lines are below cloud). Open BUY
The Oscillator Trend indicators are most useful in identifying trend decay. Nobody canceled the divergence. Correct use of this signal will give you a certain head start in the market. When working in flat. The principle of operation of the oscillator is based on the measurement of fluctuations. The indicator tries to determine the maximum or minimum of the next swing - an exit from the overbought and oversold zones. Do not forget that these signals are most interesting at the borders of the fl
The King of Forex Trend Cloud Indicator is a trend following indicator based on moving averages. The Indicator is meant to Capture both the beginning and the end of a trend. This indicator can be used to predict both short and long terms market trends.  The king of Forex Trend Cloud if paired together with the King of Forex Trend Indicator can give a broad picture in market analysis and forecasts. I have attached images for both the  The king of Forex Trend Cloud on its own and  The king of Fore
Th3Eng signals wave is a very good indicator to read the trend. But you need to filter the main trend direction with your own strategy. Because this indicator signals are repainted. So for example: Use Moving average 21 to find the trend and if the price is above the moving on higher TF or the current >> open only buy signals from the indicator. Also you can use it on option trading, Not only on forex. Works with all time-frames. works with all pairs, CFD and cryptocurrency. Sending all alertin
FREE
PABT Pattern Indicator - it's classical system one of the signal patterns. Indicator logic - the Hi & Lo of the bar is fully within the range of the preceding bar, look to trade them as pullback in trend. In the way if indicator found PABT pattern it's drawing two lines and arrow what showing trend way.  - First line - it's entry point and drawing at: 1. On the high of signal bar or on middle of the signal bar (depending from indicator mode) for buy; 2. On the low of signal bar or on middle of t
Power Renko MT4
Pierce Vallieres
Power Renko is an indicator which plots Renko bricks underneath the chart using a histogram. You can select the brick size and the timeframe of the Renko bricks as well as whether or not to use the close price or the high/low price of the candles. Renko bricks are based on price alone, not time, therefor the Renko bricks will not be aligned with the chart's time. They are extremely useful for trend trading and many different strategies can be formed from them. Buffers are provided allowing you t
Crypto_Forex   Indicator BREAKOUT CHANNEL for MT4, No Repaint. This indicator can be used as complete trading system based on   High/Low breakouts. It has   just 1 parameter - HYSTORY DEPTH, it reflects the number of candles which are taken into consideration by indicator. Parameter HYSTORY DEPTH recommended values: timeframe D1 - 20 (one month), H4 - 30 (one week), H1 - 24 (one day). BREAKOUT  CHANNEL consist of 3 lines: High Border - max price of last N ( HYSTORY DEPTH parameter)  candles, Lo
Good Signal
Yaroslav Varankin
The indicator is designed for binary options and short-term transactions on Forex To enter a trade when a signal appears blue up arrow buy red down arrow sell signal For Forex enter on a signal exit on the opposite signal or take profit For binary options Enter on 1 candle, if the deal goes negative, set a catch on the next candle Works on all timeframes If you apply a filter like Rsi, you will get a good reliable strategy.. The algorithm is at the stage of improvement and will be further develo
Trend Direction ADX indicator for MT4 Trend Direction ADX is part of a series of indicators used to characterize market conditions. Almost any strategy only work under certain market conditions. Therefore it is important to be able to characterize market conditions at any time: trend direction, trend strength, volatility, etc.. Trend Direction ADX is an indicator to be used to characterize trend direction: trending up trending down ranging Trend Direction ADX is based on ADX standard indicator
MYEwo
Ahmet Metin Yilmaz
The MyEwo indicator is a tool that helps you to find the short maturity direction in your chart. Default input values are frequently used values in this indicator. You can find and use your own values according to your own trend detection and pairs you will trade. My advice is to use a moving average in order to understand the long maturity trend on your main graph (200 and higher may be appropriate). The M5 graphics will be simplify Scalping style Trade transactions that you will use . You can
Alpha Trend sign has been a very popular trading tool in our company for a long time. It can verify our trading system and clearly indicate trading signals, and the signals will not drift. Main functions: Based on the market display of active areas, indicators can be used to intuitively determine whether the current market trend belongs to a trend market or a volatile market. And enter the market according to the indicator arrows, with green arrows indicating buy and red arrows indicating se
PipStartex is an indicator for scalping. It draws overbought/oversold price zones on the chart in the form of a channel. It also draws yellow dots on the chart when the price goes beyond the channel. When the price goes beyond this channel, it always tries to return back. Knowing this pattern, every trader can use it for trading. When the price in the oversold zone goes beyond the channel below the red zone, we open a buy deal. When the price in the overbought zone goes beyond the channel above
[ZhiBiCCI] indicators are suitable for all cycle use, and are also suitable for all market varieties. [ZhiBiCCI] Green solid line is a reversal of bullish divergence. The green dotted line is a classic bullish divergence. [ZhiBiCCI] The solid line to the red is a reverse bearish divergence. The red dotted line is a classical bearish divergence. [ZhiBiCCI] can be set in the parameters (Alert, Send mail, Send notification), set to (true) to send instant signals to the alarm window, email, insta
Bollinger Trend Lines – MT4 & MT5 Bollinger Trend Lines   is a professional volatility-based trend indicator designed to clearly identify trend direction and dynamic stop levels using Bollinger Bands. Fuses on one core principle: follow the trend, ignore noise, and let volatility define the stop. How it works The indicator builds   trailing trend lines   using Bollinger Bands: In an   uptrend , the   lower band trails price and can only rise In a   downtrend , the   upper band trails pri
Trend PA
Mikhail Nazarenko
5 (3)
The Trend PA indicator uses   Price Action   and its own filtering algorithm to determine the trend. This approach helps to accurately determine entry points and the current trend on any timeframe. The indicator uses its own algorithm for analyzing price changes and Price Action. Which gives you the advantage of recognizing, without delay, a new nascent trend with fewer false positives. Trend filtering conditions can be selected in the settings individually for your trading style. The indicator
Crosskalp1
Mikhail Bilan
Добрый День уважаемые трейдеры!  Вашему вниманию индикатор созданный и работающий на базе трендовика ADX,  для торговли на смене направления движения который учитывает коррекцию и даёт возможность на ней заработать.  Применяю этот индикатор для скальпинга. Рекомендую таймфреймы от 15 ти минутного(М15) до часового (Н1) периодов.  Красный кружок сигнал на продажу- Sell) Зелёный кружок  сигнал на покупку Buy) Чем меньше ваш таймфрейм тем меньше пунктов вы зарабатываете.   Важно выставлять стопы! !В
Elite Renko
Jermaine Wedderburn
5 (2)
Renko Charts with Heiken Ashi Filter now have the alerts and the    Win-rate . Now you can know which signal will give you that edge your trading needs. Risk to Reward Settings  Wins versus Losses Count There are four alert types to choose from for notification on screen, email or phone notification. The alert types also have buffers for use with automation. This indicator can be incorporated with any system that requires renko charts. The four (4) alert types are: Three-bar Formation ;  Pinbar
Colored trend indicator advanced is a trend indicator that is based on Fast Moving Average and Slow Moving Average and also uses RSI and Momentum to give a trend strength in percent. It is aimed to find more healthy trends with this indicator. This indicator can be used alone as a trend indicator. Colors (Default) Green = Uptrend (Default) Red = Downtrend No color = No trend, no good trend Indicator Parameters WarnPosTrendchange: Warns you when the trend may change. FullColor: See screenshot.
The Intraday Momentum Index ( IMI ) is a technical indicator that combines aspects of Candlestick Analysis with the Relative Strength Index ( RSI ). The Intraday Momentum Index indicator concept remains similar to RSI and includes the consideration for intraday open and close prices. The IMI indicator establishes a relationship between a security open and close price over the duration of a trading day, instead of how the open and close prices vary between different days. As it takes into conside
This indicator is an upgrade of traditional MACD on MT4. Macd Base line cross above Macd signal line the color of histogram change is red color and entry order Sell. Macd Base line cross below Macd signal line the color of histogram change is green color and entry order Buy. For above histogram of Macd can change color to good looking by can change color above zero line and lower line.
Trend Flasher Trend is your friend is the age old saying quote in trading arena, there are though many ways to gauge the trend and its direction, more scientific measure and logically meaningful will be an ATR break outs to identify and spot the trend and its acceleration, so we created this easy to use trend identification panel and optimized super trend based multi time frame panel entry system to aid and help the traders to make their trading decision. Unique Features of Trend Flasher 1. H
Market Vortex
Adolfina Denysenko
Market Vortex.mq4 is a powerful arrow indicator designed to accurately identify reversal points and trend continuations. Built on a smoothed oscillator and adaptive moving averages, it helps traders quickly find market entry and exit points without complex calculations. Key Features: Clear arrow signals: The indicator displays Buy/Sell arrows directly on the chart. Real-time operation: Signals are generated without delays or repainting. Adaptive calculation: The indicator uses a do
Buyers of this product also purchase
Neuro Poseidon MT4
Daria Rezueva
4.94 (35)
Neuro Poseidon is a new indicator by Daria Rezueva. It combines precise trading signals with adaptive TP/SL levels - creating best possible trades as a result! Message me and get  Neuro Poseidon Assistant  as a gift to automize your trading process! What makes it stand out? 1. Proven profitability on all assets and timeframes 2. Only confirmed BUY and SELL signals present on the chart 3. Adaptive TP & SL levels generated by the software for each trade 4. Easy to understand - suitable for all
Gann Made Easy
Oleg Rodin
4.84 (165)
Gann Made Easy is a professional and easy to use Forex trading system which is based on the best principles of trading using the theory of W.D. Gann. The indicator provides accurate BUY and SELL signals including Stop Loss and Take Profit levels. You can trade even on the go using PUSH notifications. PLEASE CONTACT ME AFTER PURCHASE TO GET TRADING  INSTRUCTIONS AND GREAT EXTRA INDICATORS   FOR FREE! Probably you already heard about the Gann trading methods before. Usually the Gann theory is a ve
Trend Catcher ind
Ramil Minniakhmetov
5 (2)
TREND CATCHER INDICATOR Trend Catcher Indicator analyzes market price movements, using a combination of the author’s proprietary and customized adaptive trend-analysis indicators.  It identifies the true market direction by filtering out short-term noise and focusing on underlying momentum strength, volatility expansion, and price structure behavior.  It also uses a combination of smoothing and trend-filtering customized indicators such as moving averages, RSI, and volatility filters.   Real ope
M1 Sniper
Oleg Rodin
5 (24)
M1 SNIPER is an easy to use trading indicator system. It is an arrow indicator which is designed for M1 time frame. The indicator can be used as a standalone system for scalping on M1 time frame and it can be used as a part of your existing trading system. Though this trading system was designed specifically for trading on M1, it still can be used with other time frames too. Originally I designed this method for trading XAUUSD and BTCUSD. But I find this method helpful in trading other markets a
Advanced Supply Demand
Bernhard Schweigert
4.91 (300)
Trading Special – 30% OFF Best Solution for any Newbie or Expert Trader! This indicator is a unique, high quality and affordable trading tool because we have incorporated a number of proprietary features and a new formula. With this update, you will be able to show double timeframe zones. You will not only be able to show a higher TF but to show both, the chart TF, PLUS the higher TF: SHOWING NESTED ZONES. All Supply Demand traders will love it. :) Important Information Revealed Maximize the pot
This indicator is an indicator for automatic wave analysis that is perfect for practical trading! Case... Note:   I am not used to the Western name for wave classification. Influenced by the naming habit of Chaos Theory (Chanzhongshuochan), I named the basic wave as   pen   , the secondary wave band as   segment   , and the segment with trend direction   as main trend segment   (this naming method will be used in future notes, let me tell you in advance), but the algorithm is not closely relate
Scalper Inside PRO
Alexey Minkov
4.74 (68)
Scalper Inside PRO Scalper Inside PRO is an intraday trend and scalping indicator for MetaTrader 4 that uses an exclusive algorithm to quickly detect market direction and key target levels. It automatically calculates entry, exit and multiple profit targets, and shows detailed performance statistics so you can see how different instruments and strategies performed. This helps you choose the most suitable trading instruments for the current market conditions. Additionally, you can easily integrat
Breakout Arrows Mt4
Michael Oko Oboh
5 (1)
Trend Breakout Arrows Indicator The Trend Breakout Arrows Indicator is a momentum-based signal tool designed to identify potential bullish and bearish breakout opportunities. It displays clear arrow signals directly on the price chart, helping traders quickly recognize possible trend changes and continuation setups. Up Arrow (Buy Signal) A magenta up arrow appears below a candle when bullish momentum begins to strengthen. This signal indicates that buying pressure may be overtaking selling press
Current event:  https://c.mql5.com/1/326/A2SR2025_NoMusic.gif A. What is A2SR ?   * It's a leading technical indicator (no repaint, no lagging). -- Guidance : -- at   https://www.mql5.com/en/blogs/post/734748/page4#comment_16532516 -- and  https://www.mql5.com/en/users/yohana/blog A2SR has a special technique in determining the levels of Support ( demand ) and Resistance ( supply ) . Unlike the ordinary way that we seen on the net, A2SR has a original concept in determining actual SR levels.
MetaBands M4
Vahidreza Heidar Gholami
3.5 (6)
MetaBands uses powerful and unique algorithms to draw channels and detect trends so that it can provide traders with potential points for entering and exiting trades. It’s a channel indicator plus a powerful trend indicator. It includes different types of channels which can be merged to create new channels simply by using the input parameters. MetaBands uses all types of alerts to notify users about market events. Features Supports most of the channel algorithms Powerful trend detection algorith
Genesis Matrix Pro is a professional multi-timeframe trend detection indicator designed to help traders identify high-quality market alignment with clarity and structure. It combines 12 different technical indicators into one visual alignment matrix, allowing traders to quickly see when market conditions are bullish, bearish, or neutral. A signal is generated only when the selected strategies are aligned, helping reduce noise and improve decision-making. PLEASE CONTACT ME AFTER PURCHASE TO GET
This product was   updated   for the   2026 market   and   optimized   for the   latest MT5 builds . PRICE UPDATE NOTICE: Smart Trend Trading System   is currently available for $99. The price will   increase to $199   after the next   30 purchases. SPECIAL OFFER:  After purchasing Smart Trend Trading System, send me a private message to claim the Smart Universal EA for FREE and turn your Smart Trend signals into automated trades. Smart Trend Trading System is a complete non-repainting, non-re
Dynamic Forex28 Navigator
Bernhard Schweigert
4.43 (7)
Specials Discount now. The Next Generation Forex Trading Tool. Dynamic Forex28 Navigator is the evolution of our long-time, popular indicators, combining the power of three into one: Advanced Currency Strength28 Indicator (695 reviews) + Advanced Currency IMPULSE with ALERT (520 reviews) + CS28 Combo Signals (recent Bonus) Details about the indicator  https://www.mql5.com/en/blogs/post/758844 What Does The Next-Generation Strength Indicator Offer? Everything you loved about the originals, now
BTMM State Engine Pro is a MetaTrader 4 indicator for traders who use the Beat The Market Maker approach: Asian session context, kill zone timing, level progression, peak formation detection, and a multi-pair scanner from a single chart. It combines cycle state logic with a built-in scanner dashboard so you do not need the same tool on many charts at once. What it does Draws the Asian session range; session times can follow broker server offset or be set in inputs. Tracks level progression (L
IQ FX Gann Levels a precision trading indicator based on W.D. Gann’s square root methods . It plots real-time, non-repainting support and resistance levels to help traders confidently spot intraday and scalping opportunities with high accuracy. William Delbert Gann (W.D. Gann) was an exceptional market analyst, whose trading technique was based on a complex blend of mathematics, geometry, astrology, and ancient mathematics which proved to be extremely accurate. Setup & Guide:  Download  MT5 Ver
PRO Renko System
Oleg Rodin
5 (30)
PRO Renko System is a highly accurate trading system specially designed for trading RENKO charts. The ARROWS and Trend Indicators DO NOT REPAINT! The system effectively neutralizes so called market noise giving you access to accurate reversal signals. The indicator is very easy to use and has only one parameter responsible for signal generation. You can easily adapt the tool to any trading instrument of your choice and the size of the renko bar. I am always ready to provide extra support to help
Neo Wave PRO
Nikolay Raykov
5 (1)
Price & Time Market Structure Indicator A professional market structure tool that analyzes waves through both price and time — not price alone. Main Description NeoWave PRO is a professional market structure indicator for MetaTrader 4 designed for traders who want to move beyond traditional one-dimensional wave tools such as ZigZag, swing indicators, and basic high/low systems. Most wave indicators analyze only one thing: Price. But a real market wave is not only a price movement. A true wave de
GOLD Impulse with Alert
Bernhard Schweigert
4.67 (12)
This indicator is a super combination of our 2 products  Advanced Currency IMPULSE with ALERT  and  Currency Strength Exotics . It works for all time frames and shows graphically impulse of strength or weakness for the 8 main currencies plus one Symbol! This Indicator is specialized to show currency strength acceleration for any symbols like Gold, Exotic Pairs, Commodities, Indexes or Futures. Is first of its kind, any symbol can be added to the 9th line to show  true currency strength accelerat
Market Structure Order Block Dashboard MT4 is a MetaTrader 4 indicator designed for traders who want to read market structure and the main price reaction zones directly on the chart. It combines BOS, ChoCH, Order Blocks, Fair Value Gaps (FVG), Liquidity, Kill Zones, Volume Profile, and a compact dashboard for quick analysis. This indicator is intended for traders who use market structure, ICT and Smart Money concepts as a decision framework. It can help spot trend continuations, possible reversa
An MT5 version is also available https://www.mql5.com/en/market/product/170916 M30/H1/H4 Swing Version Available Want to catch the big moves that M5/M15 can't reach? Gold Signal Swing Pro (M30/H1/H4) is now available. Target $20-$80+ per trade. https://www.mql5.com/en/market/product/177643 KURAMA GOLD SIGNAL PRO (MT4) — Complete XAUUSD Trading System with 7-Layer Filter, Auto TP/SL, and Quality Scoring NON-REPAINTING
PZ 123 Pattern
PZ TRADING SLU
1 (1)
Unlock powerful breakout opportunities The 123 Pattern is one of the most popular, powerful and flexible chart patterns. The pattern is made up of three price points: a bottom, a peak or valley, and a Fibonacci retracement between 38.2% and 71.8%. A pattern is considered valid when the price breaks beyond the last peak or valley, moment at which the indicator plots an arrow, rises an alert, and the trade can be placed. [ Installation Guide | Update Guide | Troubleshooting | FAQ | All Products  ]
Enigmera
Ivan Stefanov
5 (8)
ENIGMERA: The core of the market (This is a manual indicator and contains features that may not supported by the MetaTrader current testing environment) Introduction This indicator and trading system is a remarkable approach to the financial markets . ENIGMERA uses the fractal cycles to accurately calculate support and resistance levels. It shows the authentic accumulation phase and gives direction and targets.  A system that works whether we are in a trend or a correction.   How It Works Most
Introduction Harmonic Patterns are best used to predict potential turning point. Traditionally, Harmonic Pattern was identified manually connecting peaks and troughs points in the chart. Manual harmonic pattern detection is painfully tedious and not suitable for everyone. You are often exposed under subjective pattern identification with manual pattern detection. To avoid these limitations, Harmonic Pattern Plus was designed to automate your harmonic pattern detection process. The functionality
The Seismograph Marketquake Detector . No matter way you trade, you definitely want to avoid entry in the low liquidity market. - The seismograph will help you the right time to enter the market before market rally. However, even though you have made sure to entry at market times that should be busy, the fact is that many people are often trapped in markets with low liquidity. After several hours of waiting, the market suddenly became busy, but... it turned out that many people were now in the
Scalper Vault
Oleg Rodin
5 (37)
Scalper Vault is a professional scalping system which provides you with everything you need for successful scalping. This indicator is a complete trading system which can be used by forex and binary options traders. The recommended time frame is M5. The system provides you with accurate arrow signals in the direction of the trend. It also provides you with top and bottom signals and Gann market levels. The indicator provides all types of alerts including PUSH notifications. PLEASE CONTACT ME AFT
Delta Fusion Pro
Francesco Secchi
5 (2)
Delta Fusion Pro – Advanced Order Flow Analysis for Intraday Trading Delta Fusion Pro is a professional indicator for MetaTrader 4 that reveals aggressive order flow, showing the intensity and direction of institutional pressure in real time. Unlike traditional volume indicators, it analyzes the delta between Ask and Bid volumes to anticipate reversals, confirm trends, and identify professional interest zones. Key Features Intelligent Auto-Tuning System Automatically adjusts all parameters ba
Trend Lines PRO
Roman Podpora
5 (1)
TREND LINES PRO    helps understand where the market is truly changing direction. The indicator shows real trend reversals and points where major players re-enter. You see   BOS lines   Trend changes and key levels on higher timeframes — without complex settings or unnecessary noise. Signals don't repaint and remain on the chart after the bar closes. VERSION MT 5     -     Reveals its maximum potential when paired with the   RFI LEVELS PRO  indicator What the indicator shows: Real shifts   tren
The Propfolio Master Suite is the ultimate all-in-one analytical workstation for professional traders. Combining the power of the Beat The Market Maker (BTMM) methodology, Smart Money Concepts (SND/Liquidity), and Advanced Volume Profile, this suite replaces multiple different indicators with one optimized engine. Monitor up to 14 pairs simultaneously from a single chart, instantly identify market cycles, and seamlessly map institutional footprints with the click of a button. The Command Center
RFI levels PRO
Roman Podpora
5 (1)
The indicator accurately shows the reversal points and price return zones where the   Major players . You see where new trends are forming and make decisions with maximum precision, maintaining control over every trade. VERSION MT5     -     Reveals its maximum potential when combined with the   TREND LINES PRO   indicator What the indicator shows: Reversal structures and reversal levels with activation at the beginning of a new trend. Display of   TAKE PROFIT   and   STOP LOSS   levels with mi
Trading Special – 40% OFF Best Solution for any Newbie or Expert Trader! This indicator is a unique, high quality and affordable trading tool because we have incorporated a number of proprietary features and a secret formula. With only ONE chart it gives Alerts for all 28 currency pairs. Imagine how your trading will improve because you are able to pinpoint the exact trigger point of a new trend or scalping opportunity! Built on new underlying algorithms it makes it even easier to identify and c
More from author
Очень точный индикатор, с  его помощью очень легко определять барные паттерны. Это очередная разновидность ЗигЗага, за исключением, он не рисует текущую линию, которая может перерисоваться,если нарисовал конечную точку, по закрытому бару, то больше ее не изменяет - это означает смену направления и следующая точка будет другого цвета. Может быть применен как для определения основного движения, при использовании увеличенных параметров, так и непосредственно для входа с минимальным риском. Очень х
The indicator is based on MA with additional processing of all the current prices, as well as all Highs and Lows for an appropriate period. The product efficiently displays trend changes and tracks a trend line and color if conditions remain unchanged. The indicator has only three parameters making it easy to configure. Parameters PeriodTrend  - amount of bars used for a trend calculation PeriodAverage - indicator line averaging period Method - averaging method
The indicator shows the exact price position in the current market on any symbol. It shows the trend direction on the current chart as well as on the two subsequent higher timeframes at the same time (from top to bottom). For example, you can observe the trend direction on M5 and M15 without leaving the M1 chart. The indicator switches all trend depending on the market conditions preventing you from entering against a trend or allowing you to exit a position in a timely manner. The indicator is
This indicator shows the current market situation relative to the price volatility channel, its external and internal boundaries, displays the last direction of the price movement. The main purpose of the indicator is to identify the trend movement and its boundaries. With a wide channel, it can be used for determining the initial price movement waves. It works on any instrument and any time frame of the chart. It works in 2 different modes: The first mode shows any changes in the channel when t
The oscillator shows reversal points and the movement strength very well. It can be used on any symbol and any timeframe. It has a parameter of the level when the signal reaches the required power. The indicator is very easy to setup. Indicator bars are not redrawn. Description of the Parameters PeriodPower - signal power calculation period LevelPower - the required level of the signal power
Индикатор очень своевременно показывает изменение направления рынка на любом инструменте.   Более того, этот индикатор мультитаймфреймовый, что позволяет увидеть на текущем периоде графика смену направления движения рынка с более старшего таймфрейма. Стрелка вверх сигнализирует о восходящем движении, стрелка вниз - о нисходящем. Каждая стрелка имеет свою ценовую составляющую, равную(как правило) значению экстремума на используемом таймфрейме, что можно использовать в качестве установки стоповых
Индикатор очень своевременно показывает входы в рынок на любом инструменте.  Каждая стрелка имеет свою ценовую составляющую, равную(как правило) значению экстремума на используемом таймфрейме, что можно использовать в качестве установки стоповых ордеров или других действий при применении индикатора в советниках. Индикатор имеет минимальное количество параметров, позволяющих без особого труда настроить его работу. Параметр Level_Open  отвечает за скорость выдачи сигнала. Чем больше этот параметр
Новая серия индикаторов Veles Dynamic.   Индикаторы не перерисовывают своих значений. Эти индикаторы работают быстрее и точнее аналогичных по названию. Индикатор Veles_dMA_Plus представляет собой динамическую МА, рассчитанную по текущим ценам инструмента. Имеется возможность динамического сглаживания линии. Есть возможность отображения текущего трендового канала с изменением его волатильности. Параметры: period - период динамической МА price - применяемая цена shift - сдвиг МА влево от текущи
Новая серия индикаторов Veles Dynamic.     Индикаторы не перерисовывают своих значений. Эти индикаторы работают быстрее и точнее аналогичных по названию. Индикатор Veles_dMACD представляет собой разницу показаний между двух динамических МА, рассчитанных по текущим ценам инструмента. Хорошо показывает разворотные моменты, позволяет точно определять дивергенции. Имеет цветовое сопровождение изменения показаний. Параметры: period_Fast - период быстрой динамической МА period_Slow  - период медлен
Новая серия индикаторов Veles Dynamic.     Индикаторы не перерисовывают своих значений. Эти индикаторы работают быстрее и точнее аналогичных по названию. Индикатор Veles_dChannel представляет собой динамическую МА с расчетным каналом по текущим ценам инструмента. Индикатор показывает полностью законченное движение в цикле. Данный индикатор может использоваться в качестве установки и траллирования стопов при скальпинге.  Параметры: period - период динамической МА price - применяемая цена shif
Новая серия индикаторов Veles Dynamic.     Индикаторы не перерисовывают своих значений. Эти индикаторы работают быстрее и точнее аналогичных по названию. Индикатор Veles_dTrend представляет собой гистограмму, рассчитанную на основе нескольких динамических алгоритмов, использующих текущие цены инструмента. Пока индикатор не покажет смену тренда, будьте уверены, что тренд продолжит свое направление. Кроме этого, есть зоны принятия решения, которые ограниченны уровнями.В этих зонах будет самый
Этот индикатор - очередная разновидность ЗигЗага, за исключением, он не рисует текущую линию, которая может перерисоваться. Этот индикатор, если нарисовал конечную точку, по закрытому бару, то больше ее не изменяет - это означает смену направления и следующая точка будет другого цвета. Может быть применен как для определения основного движения, при использовании увеличенных параметров, так и непосредственно для входа с минимальным риском.Очень хорошо показывает все волны. Работает с любым инстру
Индикатор iVeles_Channel_Extremum_II_MTF вычисляет точки слома направлений движения цены на установленном в параметрах ТФ, на основе этих точек и выбранного их количества строится основной канал цены, который можно использовать в качестве уровней поддержки и сопротивления для меньшего ТФ, на котором установлен индикатор. В зависимости от направления движения основного тренда рассчитывается средняя линия канала по уровню Фибоначи, от которой, как правило, идет отскок в сторону тренда. Также по ур
Veles RSI
Gennady Mazur
Индикатор iVeles_RSI представляет собой  обычный  RSI, привязанный к нулевой отметке . В отличии от обычного RSI, наложены уровни сигнала в виде облака, что заметно расширяет области применения данного индикатора. Очень хорошо показывает разворотные моменты, так же позволяет точно определять дивергенции. Параметры: period - период RSI price - применяемая цена level - уровень облака
Veles RVI
Gennady Mazur
Индикатор iVeles_RVI представляет собой  обычный  RVI, с пересчитанными и приведенными значениями . В отличии от обычного RVI, наложены уровни сигнала в виде облака, что заметно расширяет области применения данного индикатора. Очень хорошо показывает разворотные моменты и циклы тенденций, так же позволяет определять дивергенции. Параметры: period - период RVI price - применяемая цена level - уровень облака
Индикатор iVeles_DeMarker представляет собой  обычный  DeMarker, с пересчитанными и приведенными к нулю значениями . В отличии от обычного DeMarker, наложены уровни сигнала в виде облака, что заметно расширяет области применения данного индикатора. Очень хорошо показывает разворотные моменты и циклы тенденций, так же позволяет определять дивергенции. Параметры: period - период DeMarker level - уровень облака
Veles CCI
Gennady Mazur
Индикатор iVeles_CCI представляет собой  обычный  CCI . В отличии от обычного CCI, наложены уровни сигнала в виде облака, что заметно расширяет области применения данного индикатора. Очень хорошо показывает окончание трендов, разворотные моменты и циклы тенденций, так же позволяет определять дивергенции. Параметры: period - период CCI price - применяемая цена level - уровень облака
Индикатор iVeles_Moment представляет собой  обычный  Momentum, с пересчитанными и приведенными к нулю значениями . В отличии от обычного Momentum, наложены уровни сигнала в виде облака, что заметно расширяет области применения данного индикатора. Очень хорошо показывает разворотные моменты и циклы тенденций, может применяться как основной сигнал для входа в позицию. Параметры: period - период Momentum price - применяемая цена level - уровень облака
Индикатор iVeles_Trend_X_II - использует специализированный расчет текущих цен графика. Очень качественно и своевременно показывает смену направления, более того, отображаемая цена индикатора может быть использован в качестве уровня принятия решения. Работает качественно на любом ТФ и с любым инструментом. Параметры: period - период расчетов average   - усреднение  МА method - применяемый метод shift - сдвиг показаний
Индикатор iVeles_Perfect_Oscilator является опережающим и одним из самых лучших осциляторов на сегодняшний день,  использует специализированный расчет текущих цен графика.  Очень качественно и своевременно показывает смену направления, очень точный подход к уровням перекупленности и перепроданности, что позволяет своевременно принять решение по сделке.  Работает качественно на любом ТФ и с любым инструментом. Параметры: period_Osc - период расчетов average_Osc  - усреднение  МА method_Osc - прим
Индикатор iVeles_Perfect_Oscilator является опережающим и одним из самых лучших осциляторов на сегодняшний день,  использует специализированный расчет текущих цен графика.  Очень качественно и своевременно показывает смену направления, очень точный подход к уровням перекупленности и перепроданности, что позволяет своевременно принять решение по сделке.  Работает качественно на любом ТФ и с любым инструментом. Параметры: Period - период расчетов Average  - усреднение  МА Method - применяемый мето
Представлен принципиально новый индикатор ZigZag, который отличается от стандартного абсолютной легкостью, быстродействием расчетов и очень высокой точностью. В основе индикатора заложен принцип цикличности рынка с совокупностью анализа количества текущих баров и их основных ценовых уровней. Чем меньше баров для определения расчетов, тем более агрессивная постройка линий индикатора. Как и в  стандартном индикаторе перерисовывается только последняя линия, при изменении достигнутого экстремума. П
Данная утилита позволяет осуществлять полноценную торговлю в ручном режиме в тестере. Это особенно необходимо для тестирования своих стратегий торговли, без открытия счета и совершенно без риска. Кроме этого утилитой можно пользоваться и при обычной торговле на счете. Открытие любого количества позиций (при условии достаточности маржи) в любом направлении. Закрытие всех позиций по направлению или вообще всех открытых позиций счета с данным магическим числом. Параметры: Volume - объем сделки Mag
Советник-утилита "Veles Custom Chart" создает выбранный один из 3-ех персональный график движения цены в режиме реального времени. Возможно создание временного графика с длительностью свечи не минуты, а равного заданному числу секунд, тикового графика, где размер и длительность бара определяется количеством тиков в баре или тикового объема, и ренко графика по размеру кирпичика бара, при чем этот график полностью повторяет структуру движения цены, отрисовывая противоположные тени цены. Графики о
Filter:
No reviews
Reply to review