Veles Perfect Oscilator
- Indicators
-
Gennady Mazur
 Практикующий трейдер, программист MQL4, MQL5.
С 2000 года на рынке Форекс, c 2005 года программист на языке MQL4.
В 2006 году написал свои первые индикаторы и советники Форекс на заказ.
Общую известность мне принес мультивалютный советник MultiIlan, написанный в 2011 году. - Version: 1.50
- Updated: 6 April 2023
- Activations: 5
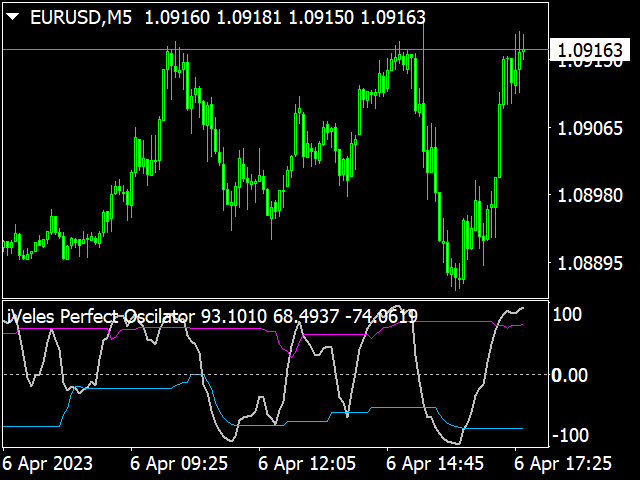
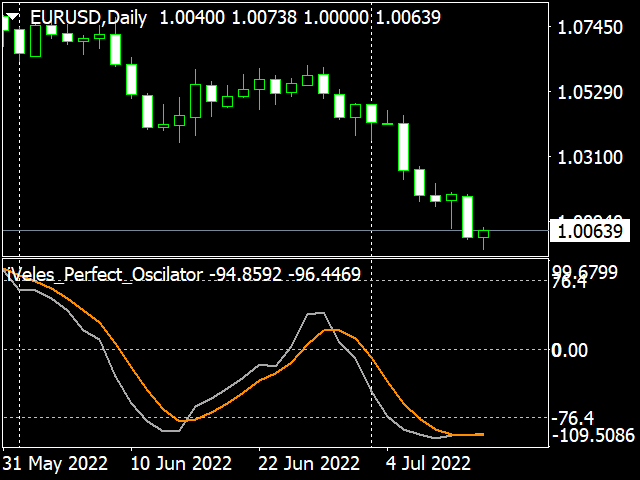
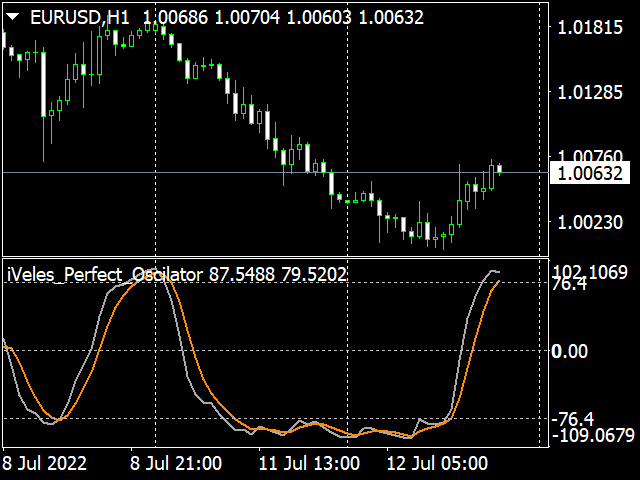
Индикатор iVeles_Perfect_Oscilator является опережающим и одним из самых лучших осциляторов на сегодняшний день, использует специализированный расчет текущих цен графика. Очень качественно и своевременно показывает смену направления, очень точный подход к уровням перекупленности и перепроданности, что позволяет своевременно принять решение по сделке. Работает качественно на любом ТФ и с любым инструментом.
Параметры:
- period_Osc - период расчетов
- average_Osc - усреднение МА
- method_Osc - применяемый метод
- shift - сдвиг показаний
Версия для мт5 здесь
https://www.mql5.com/ru/market/product/85438