Support Resistance screnner
- 指标
-
STE S.S.COMPANY
 Hello,
my name is Ashraf a fintech Software Engineer.
I create amazing forex indicators and expert advisors for Metatrader 4 and Metatrader 5, the best trading platforms.
Use my service and let me build your trading strategies ( Indicator coding or EA coding ) by click on bellow link - 版本: 13.20
- 更新: 13 十二月 2023
- 激活: 10
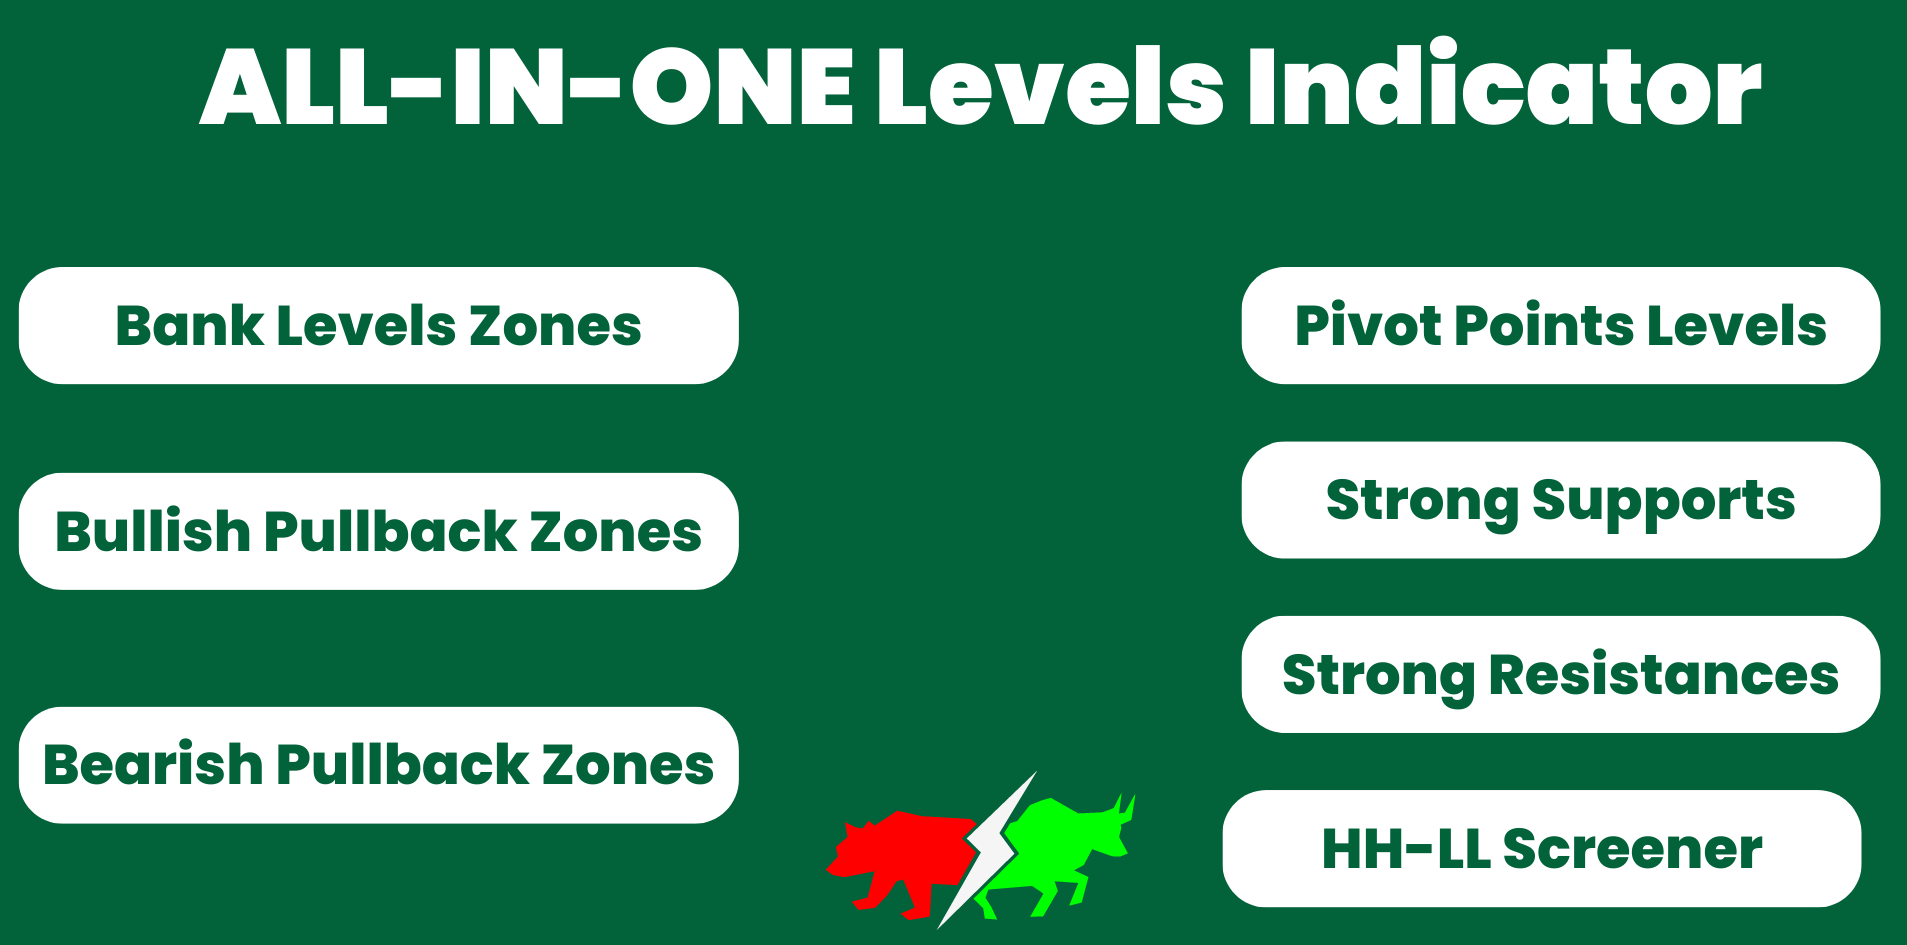
支撑和阻力筛选器是 MetaTrader 的一个级别指标,它在一个指标内提供多种工具。 可用的工具有:
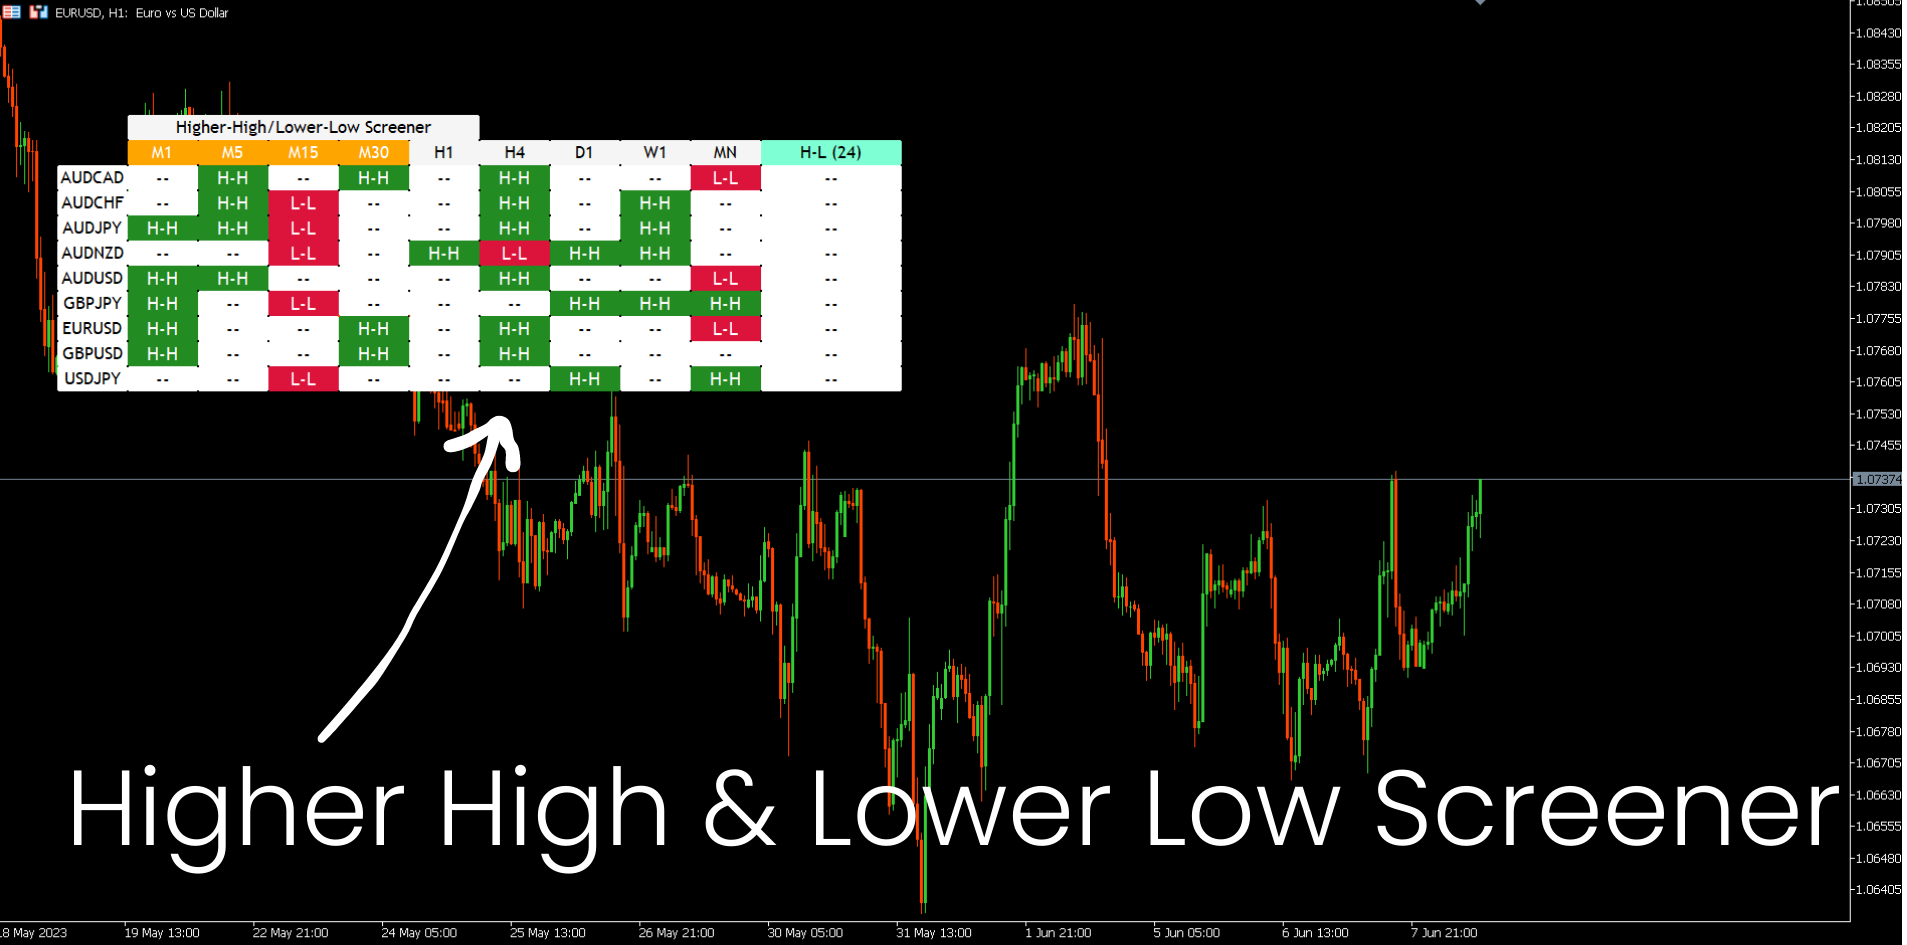
1. 市场结构筛选器。
2. 看涨回调区。
3. 看跌回调区。
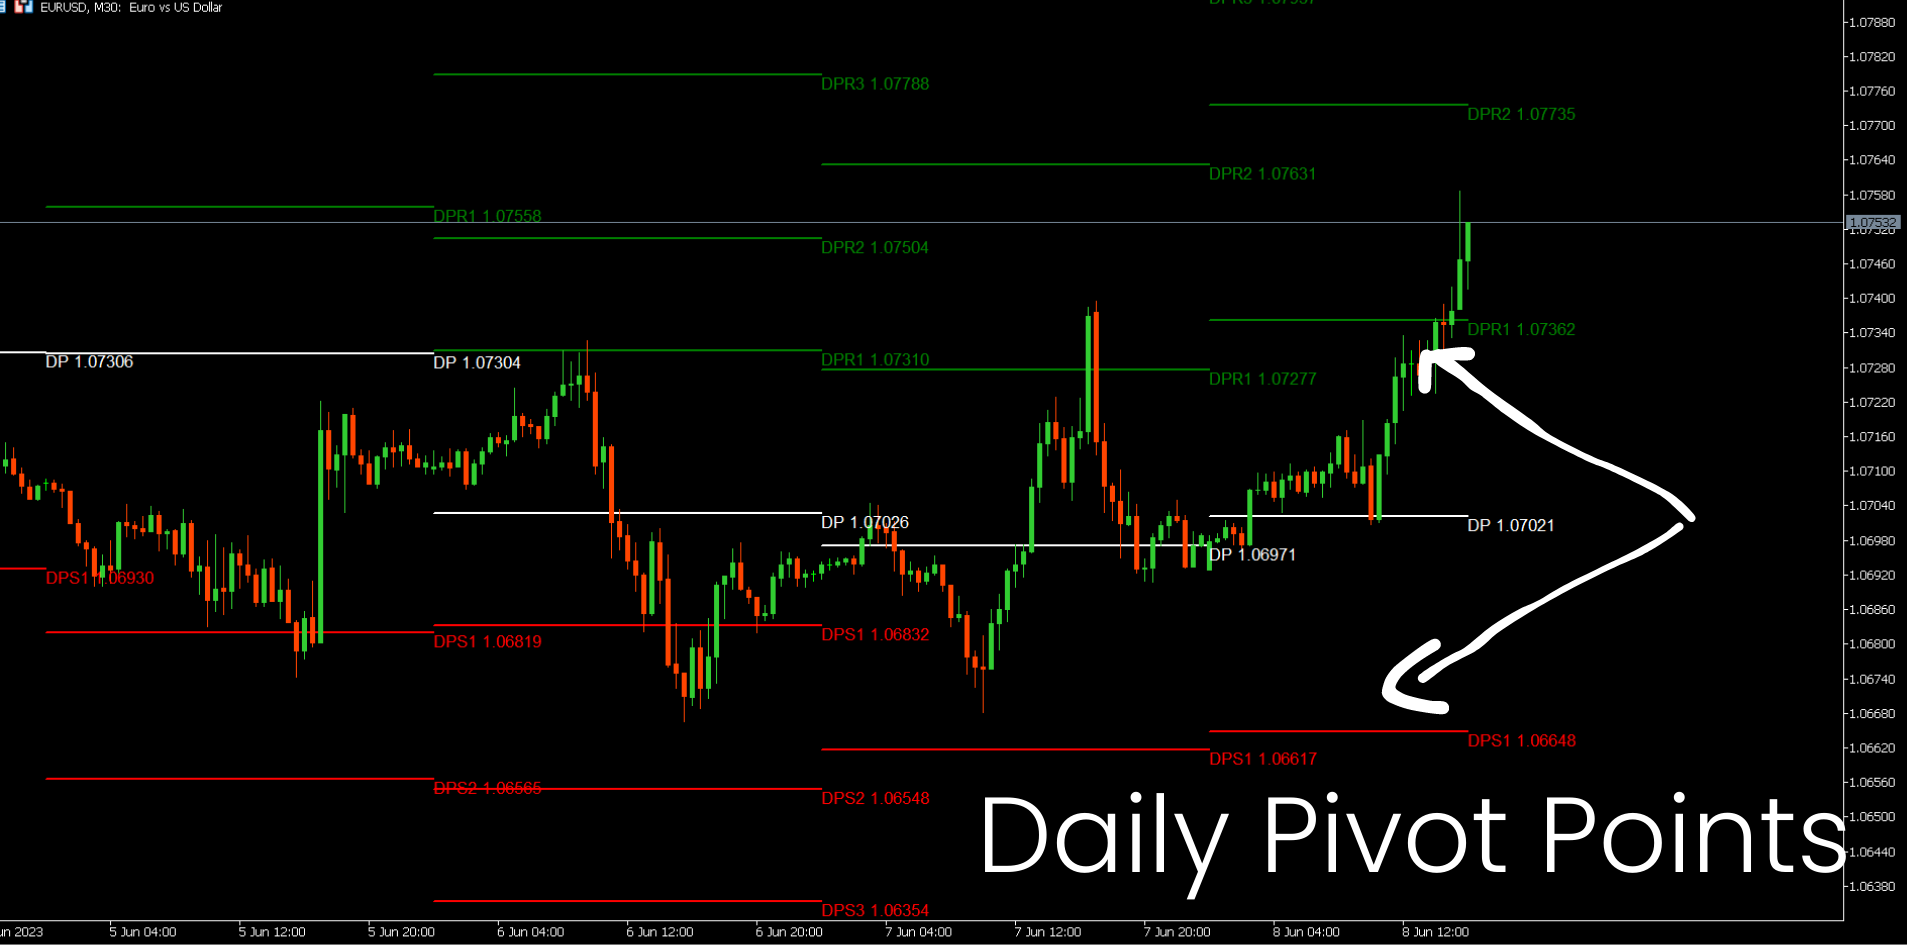
4.每日枢轴点
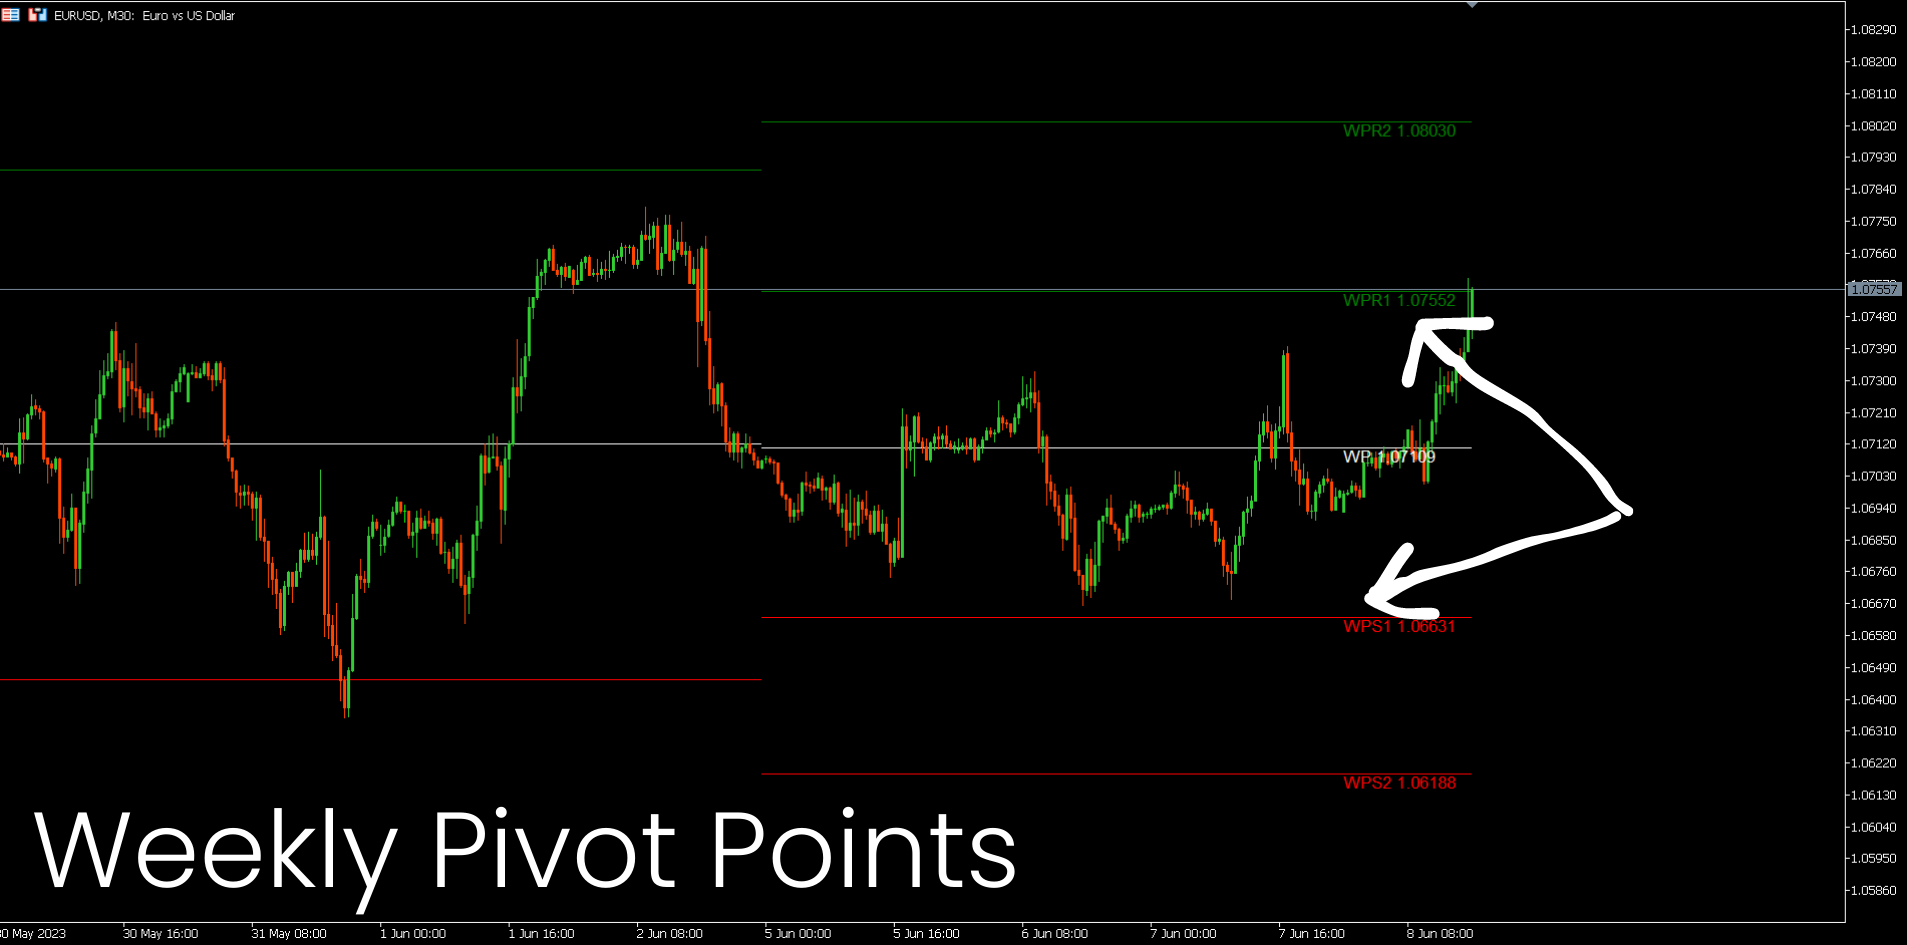
5.每周枢轴点
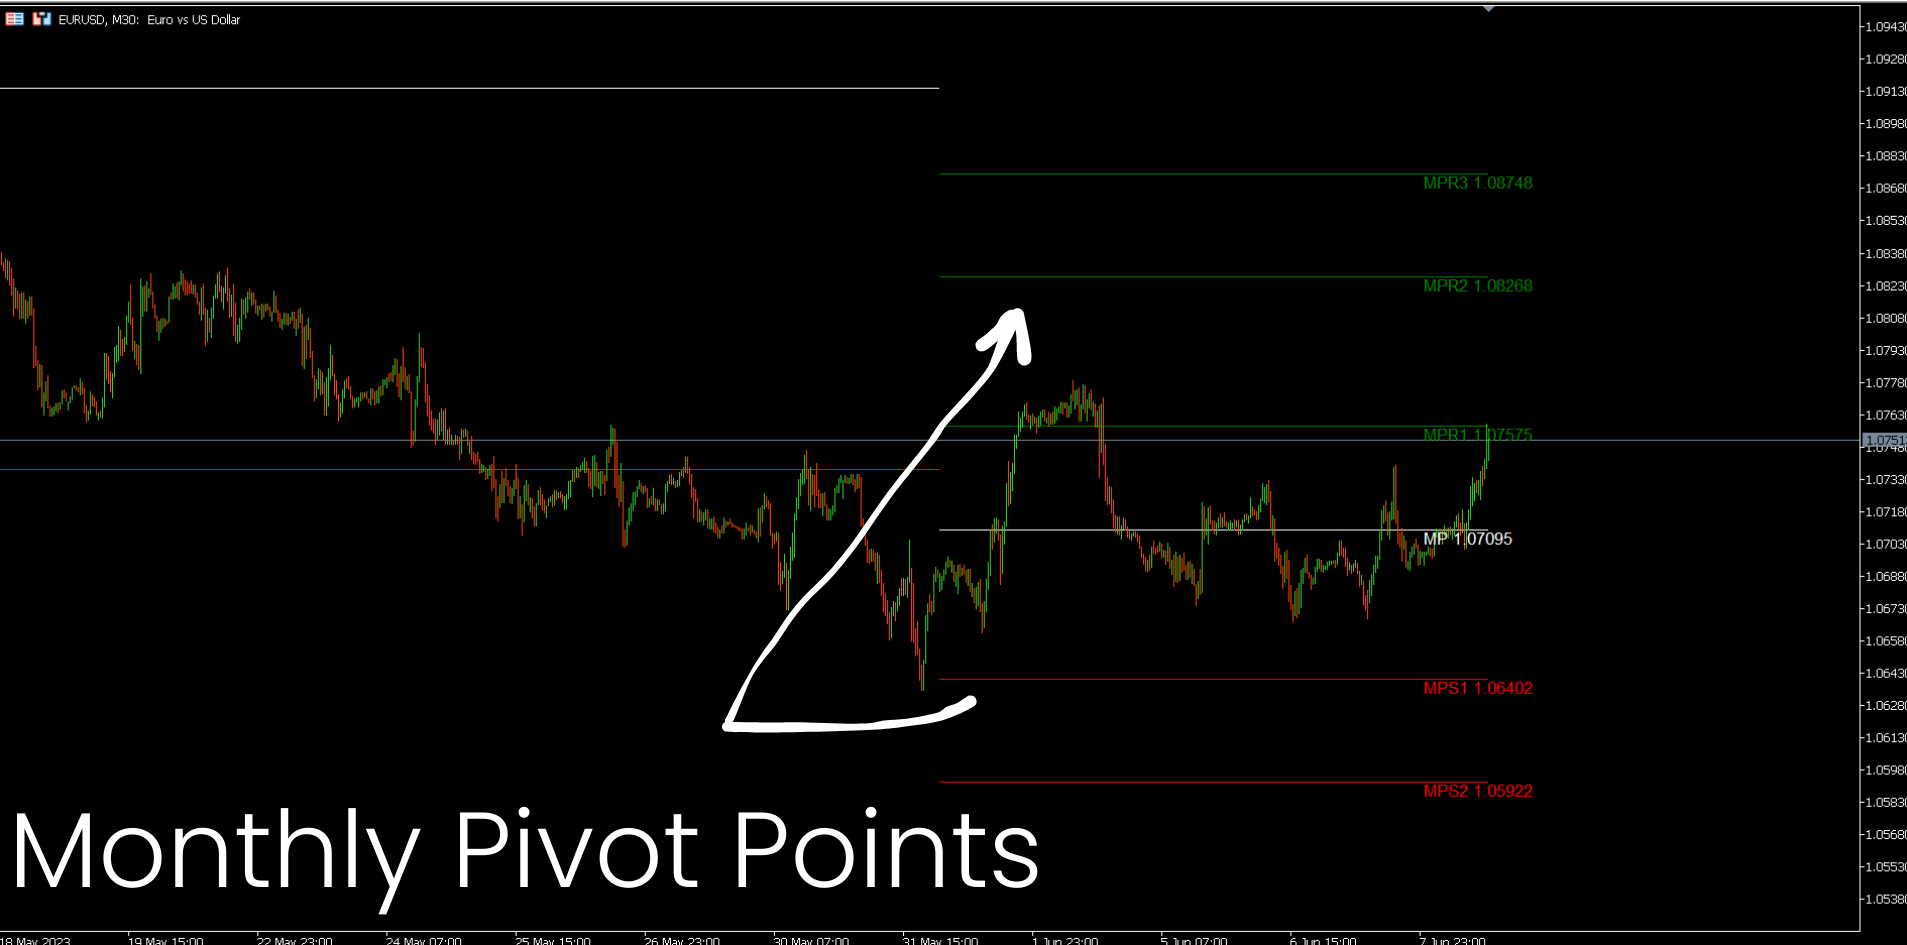
6. 每月枢轴点
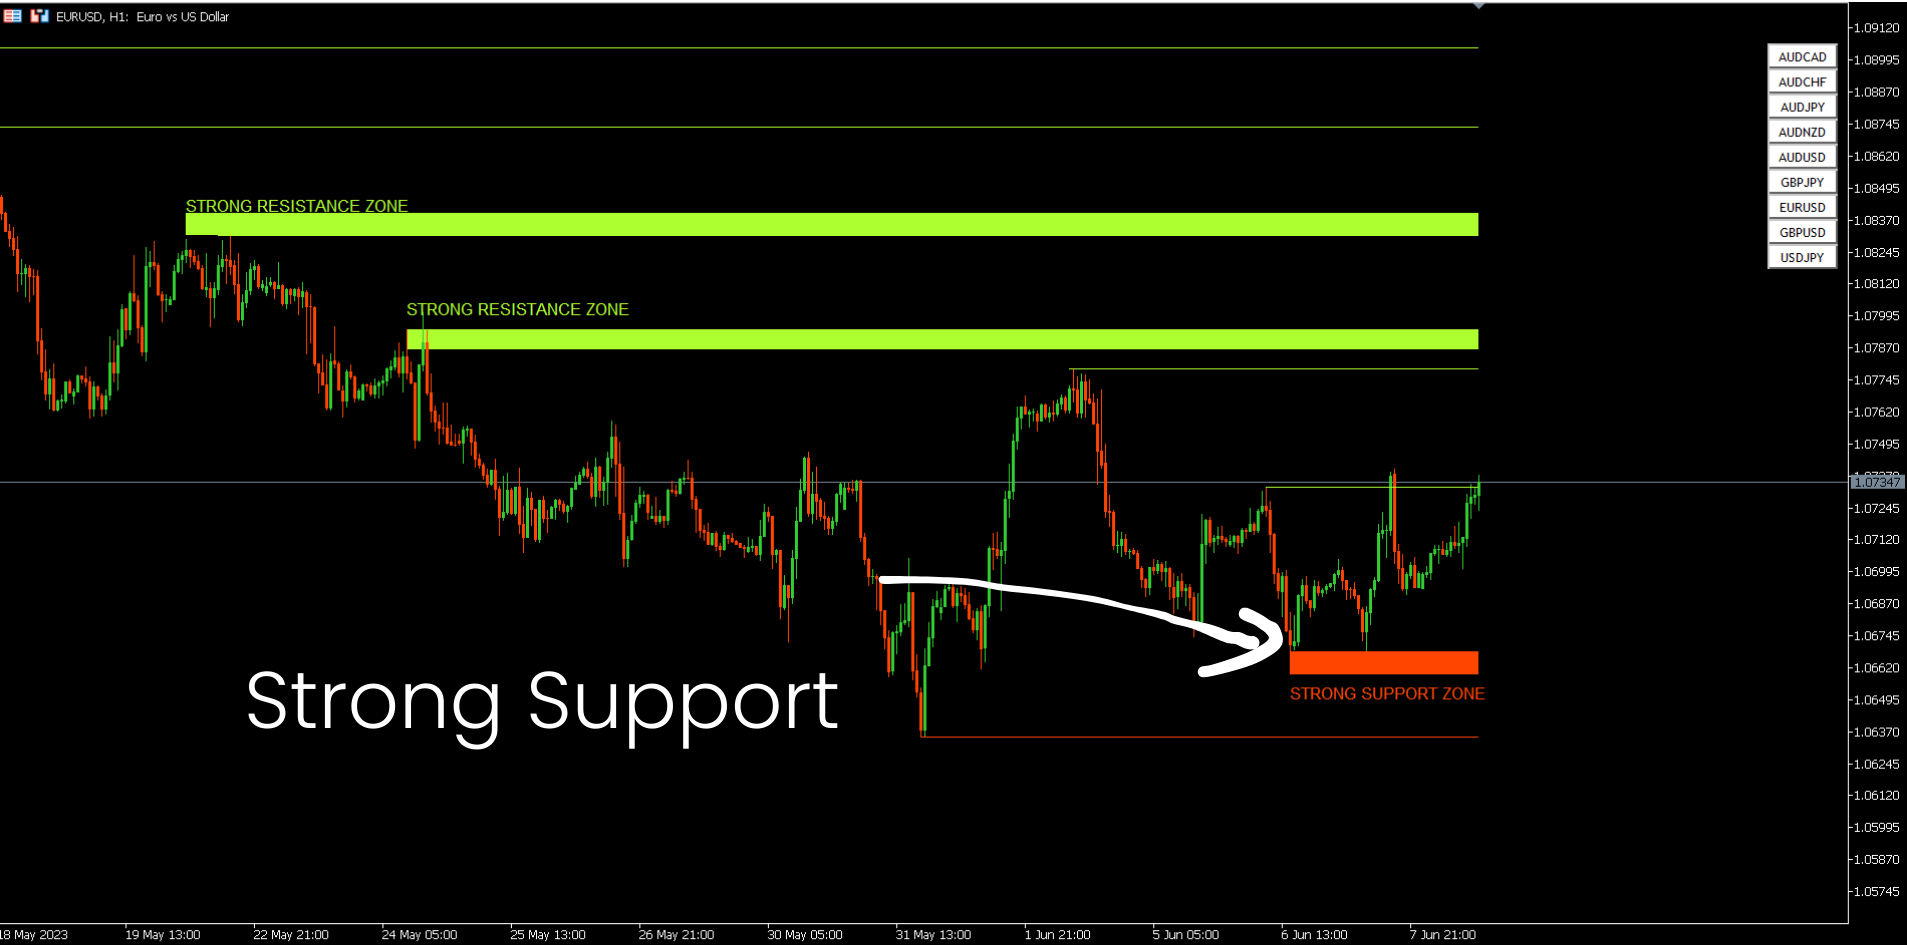
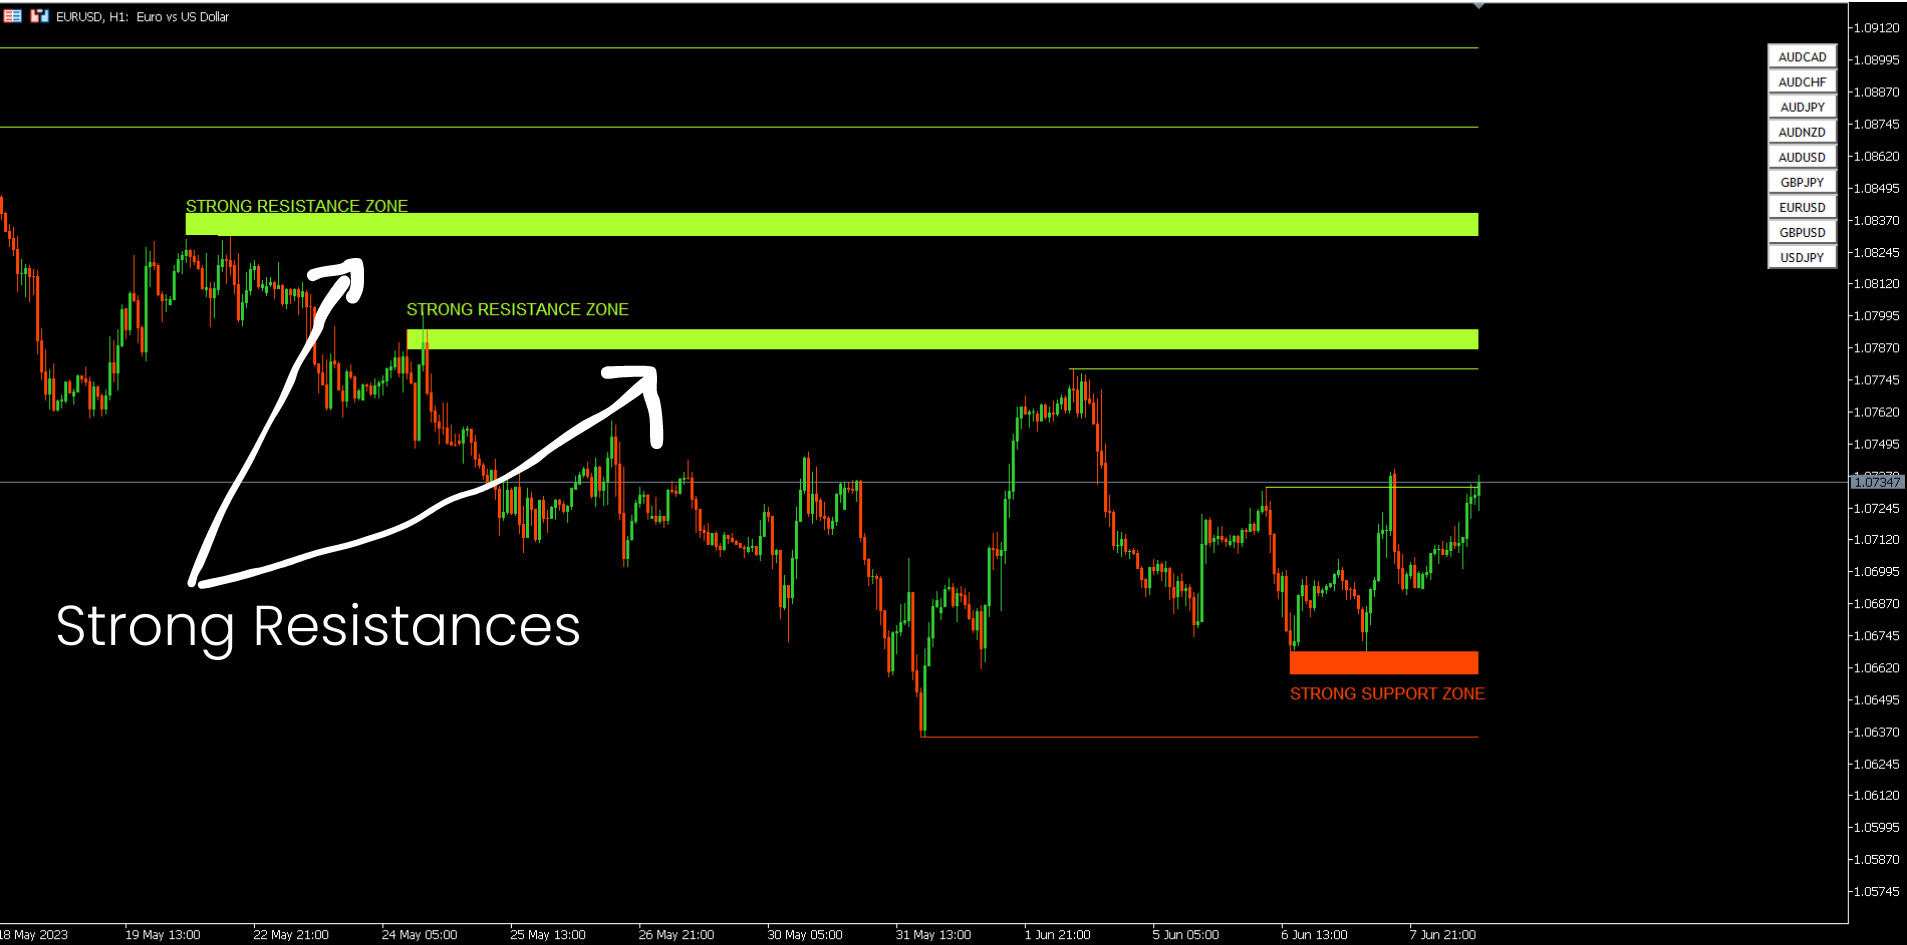
7. 基于谐波形态和成交量的强大支撑和阻力。
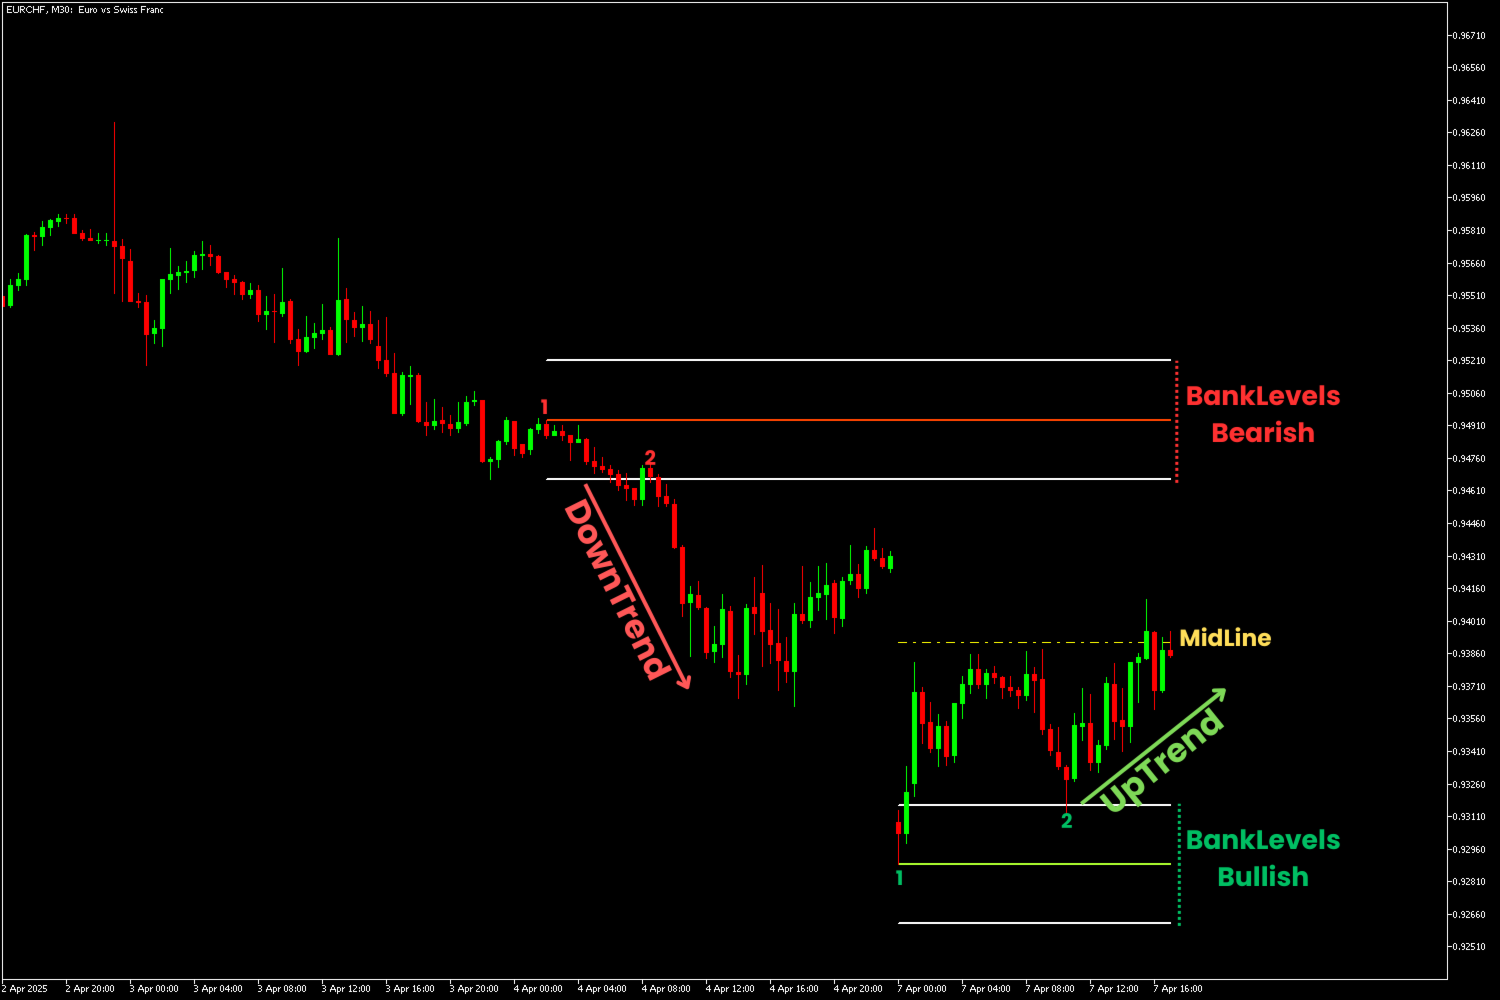
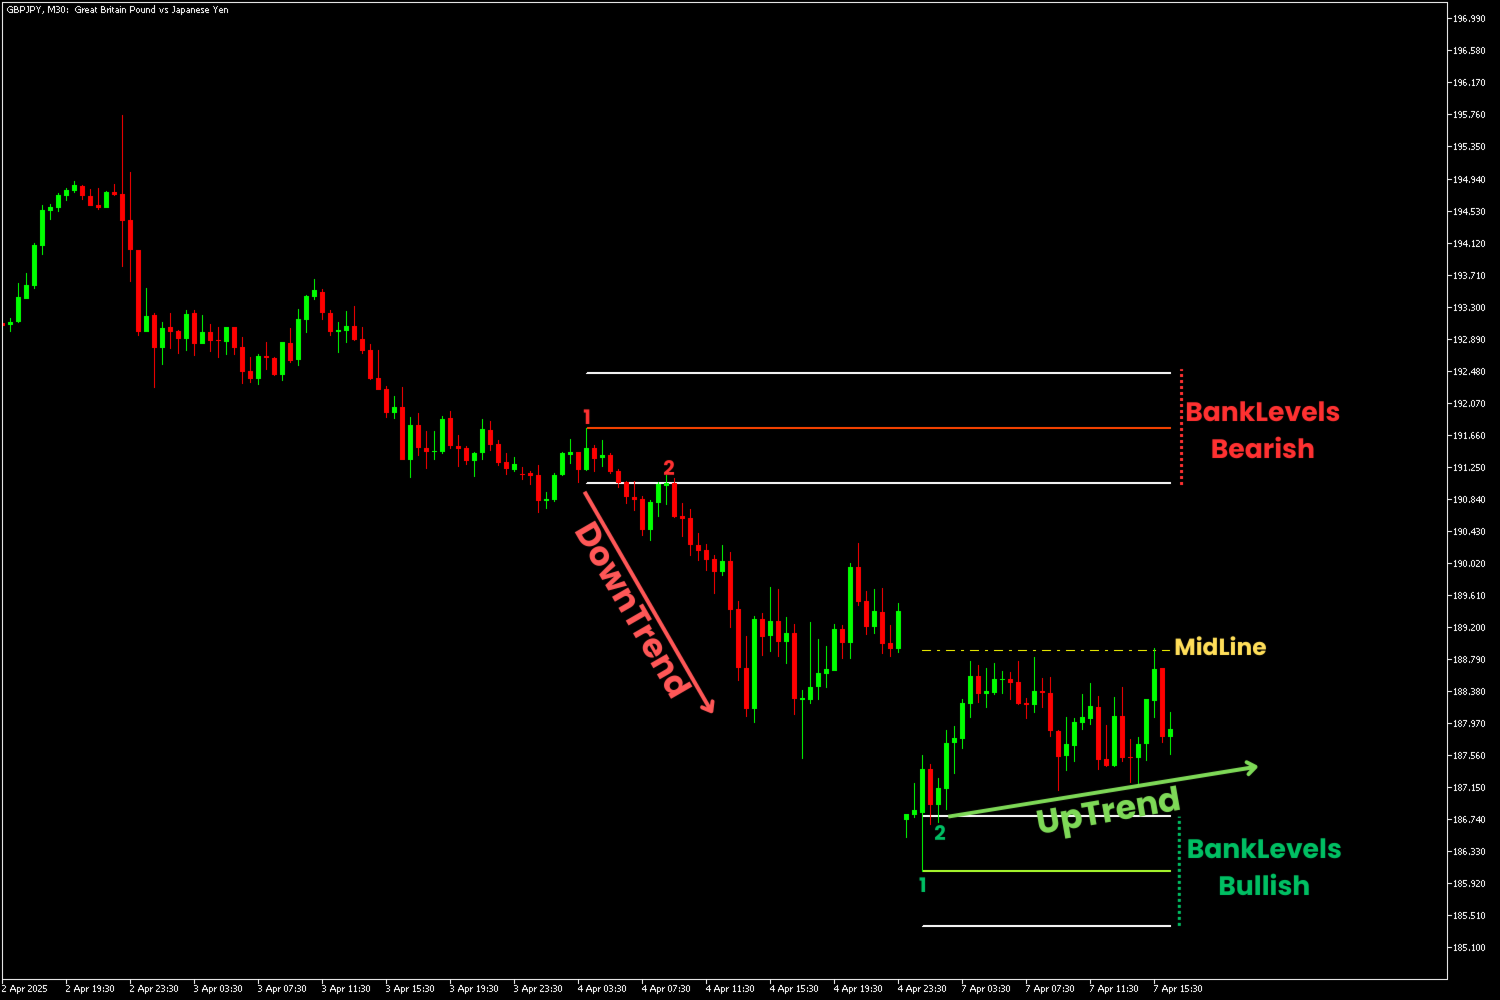
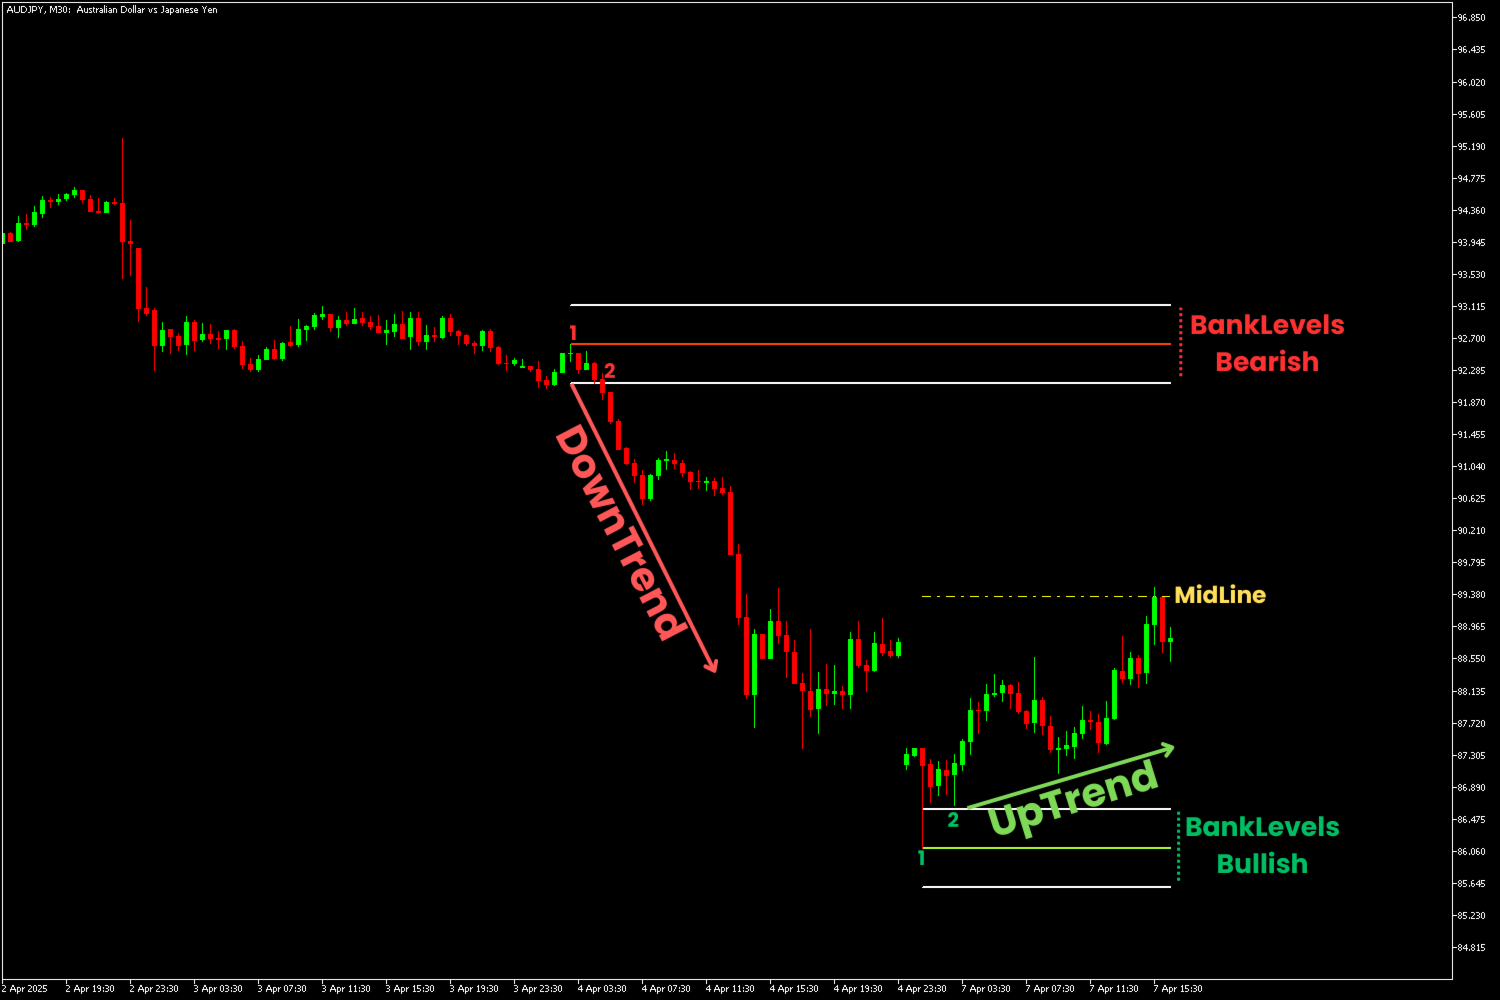
8. 银行级区域。
限时优惠:HV 支撑和阻力指示器仅售 50 美元且终生可用。 (原价 125$)
您想尝试不受 Metatrader Backtester 限制的指标吗? 单击此处下载演示版本。
主要特点
- 基于谐波和音量算法的强大支撑和阻力区域。
- 基于谐波和成交量算法的看涨和看跌回调区域。
- 市场结构筛选器
- 每日、每周和每月的枢轴点。
文档
所有支持和阻力筛选器文档(说明)和策略详细信息均可在我们 MQL5 博客的这篇文章中找到:单击此处。 接触
作者
SAYADI ACHREF,金融科技软件工程师,Finansya 创始人。 
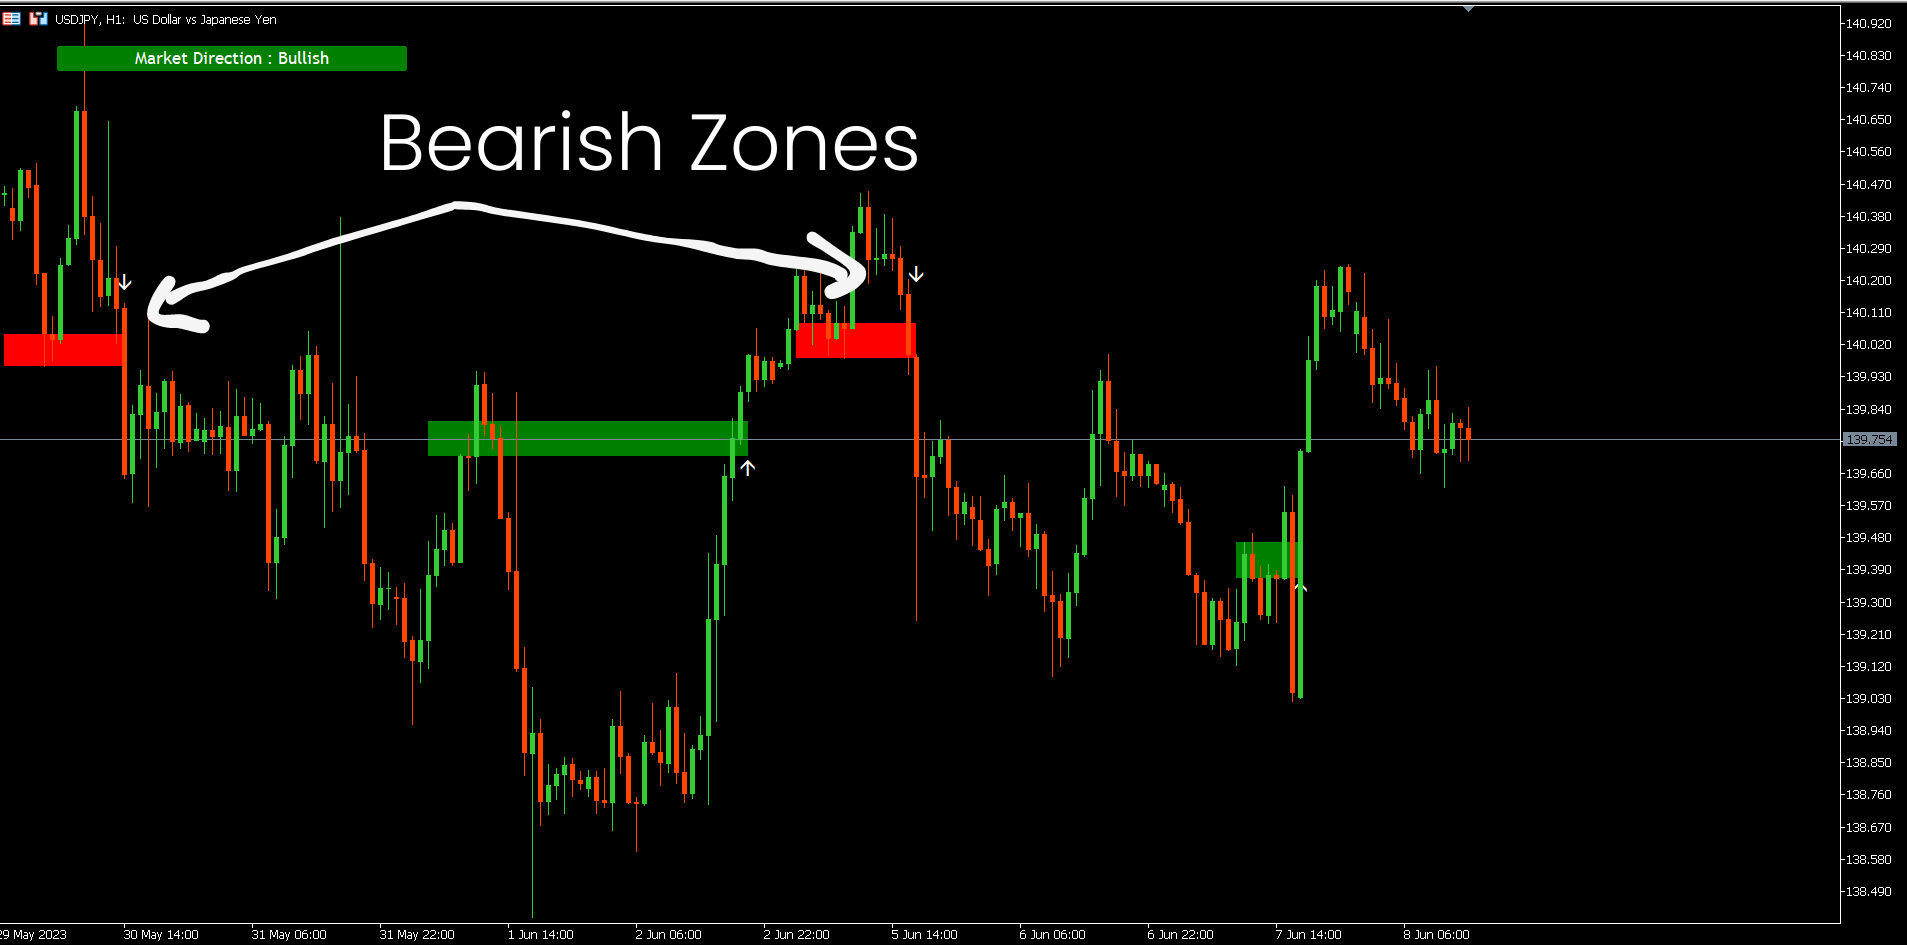
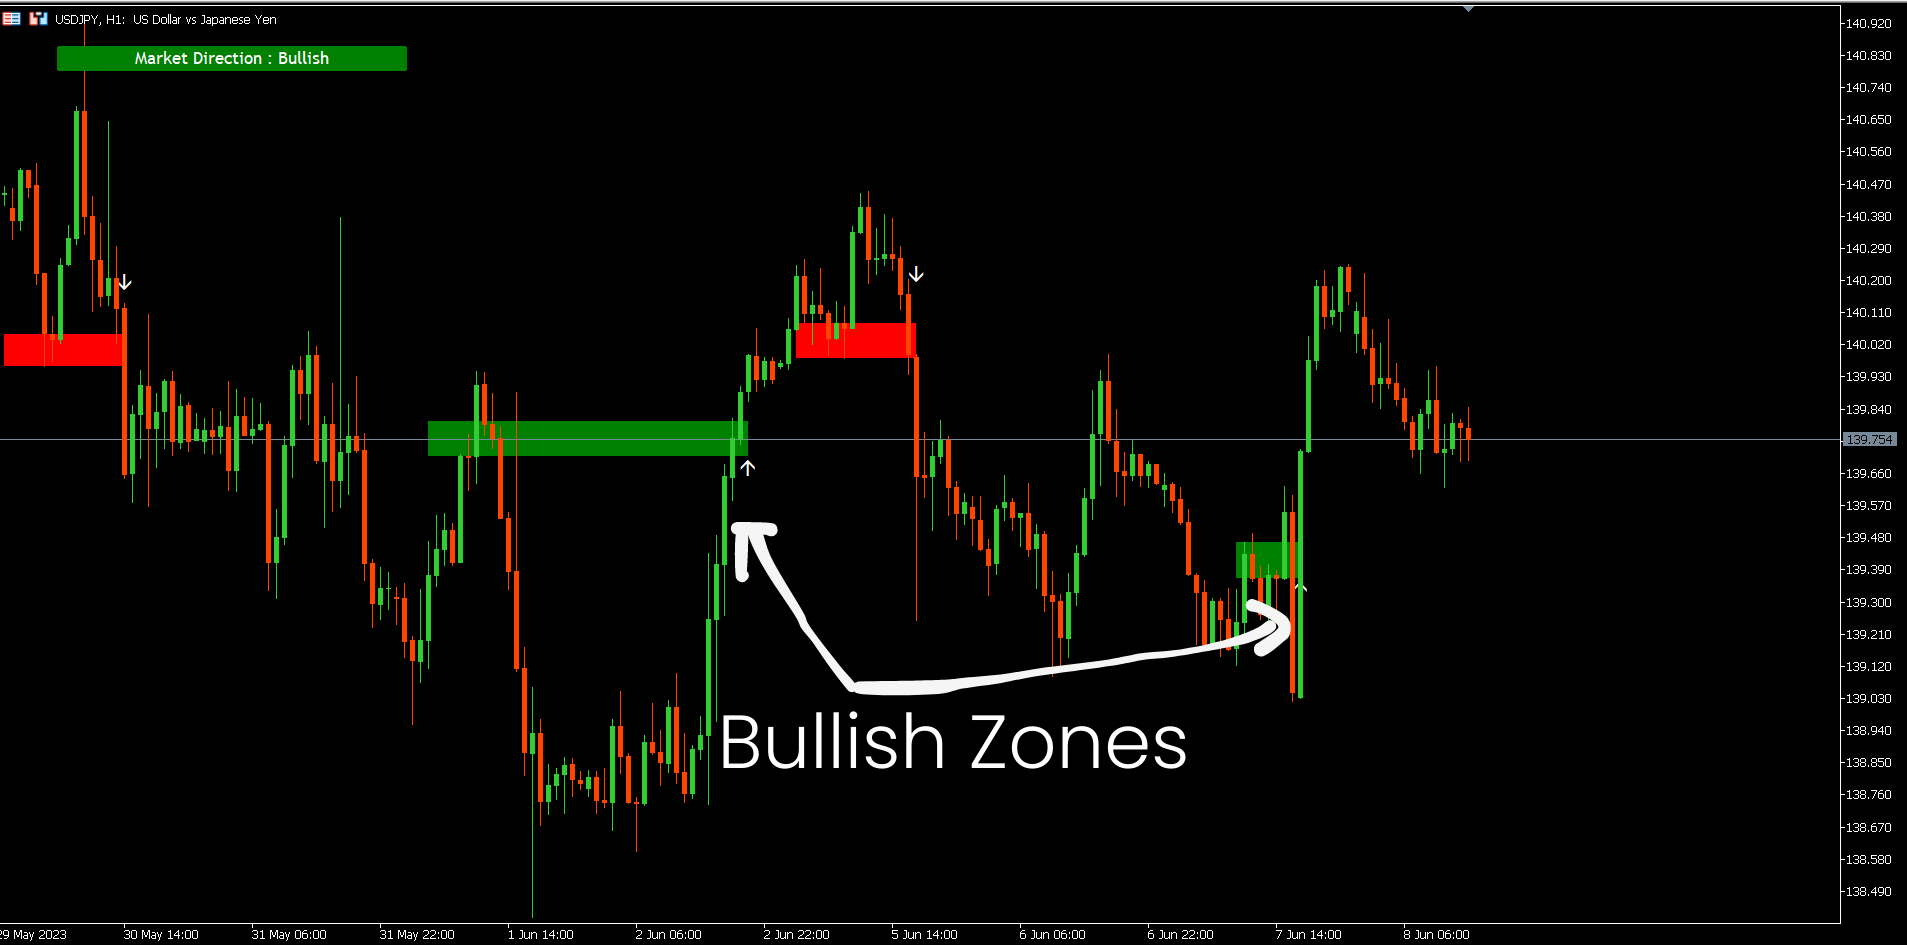


I have been using this trading system for three years. I've found that having all three indicators is significantly more effective, as they create a complete and comprehensive system.