Support Resistance screnner
- Indicatori
-
STE S.S.COMPANY
 Hello,
my name is Ashraf a fintech Software Engineer.
I create amazing forex indicators and expert advisors for Metatrader 4 and Metatrader 5, the best trading platforms.
Use my service and let me build your trading strategies ( Indicator coding or EA coding ) by click on bellow link - Versione: 13.20
- Aggiornato: 13 dicembre 2023
- Attivazioni: 10
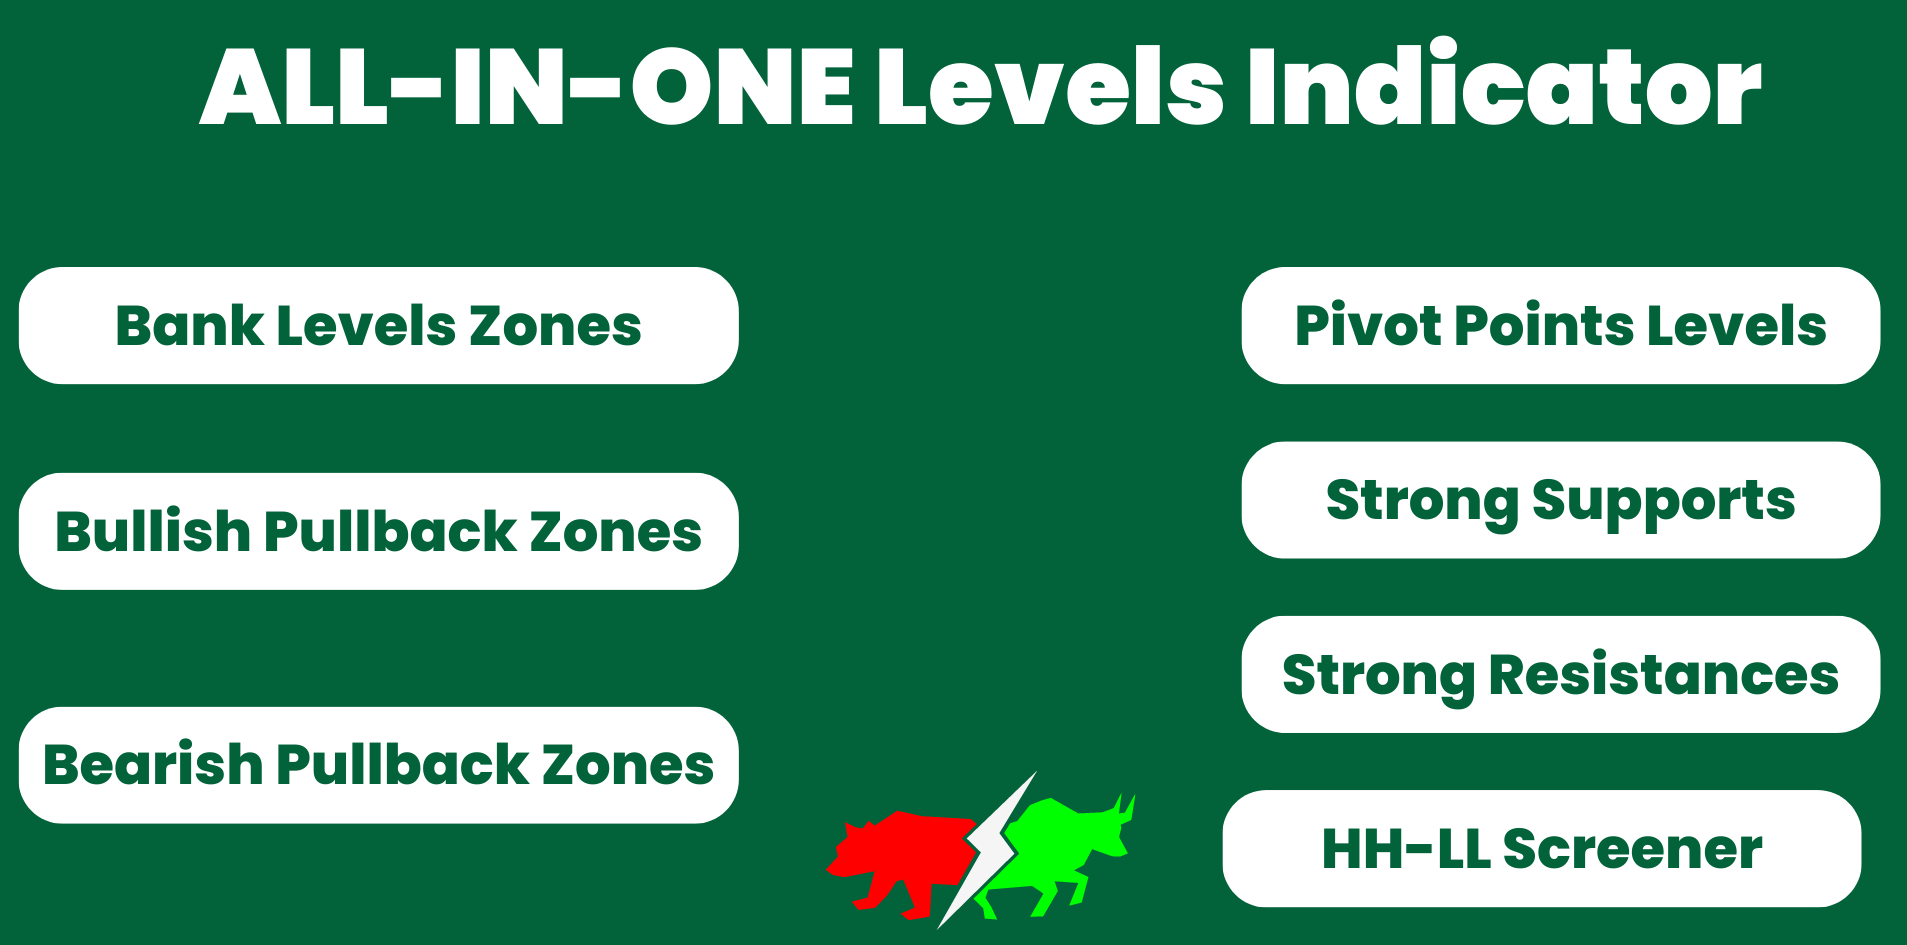
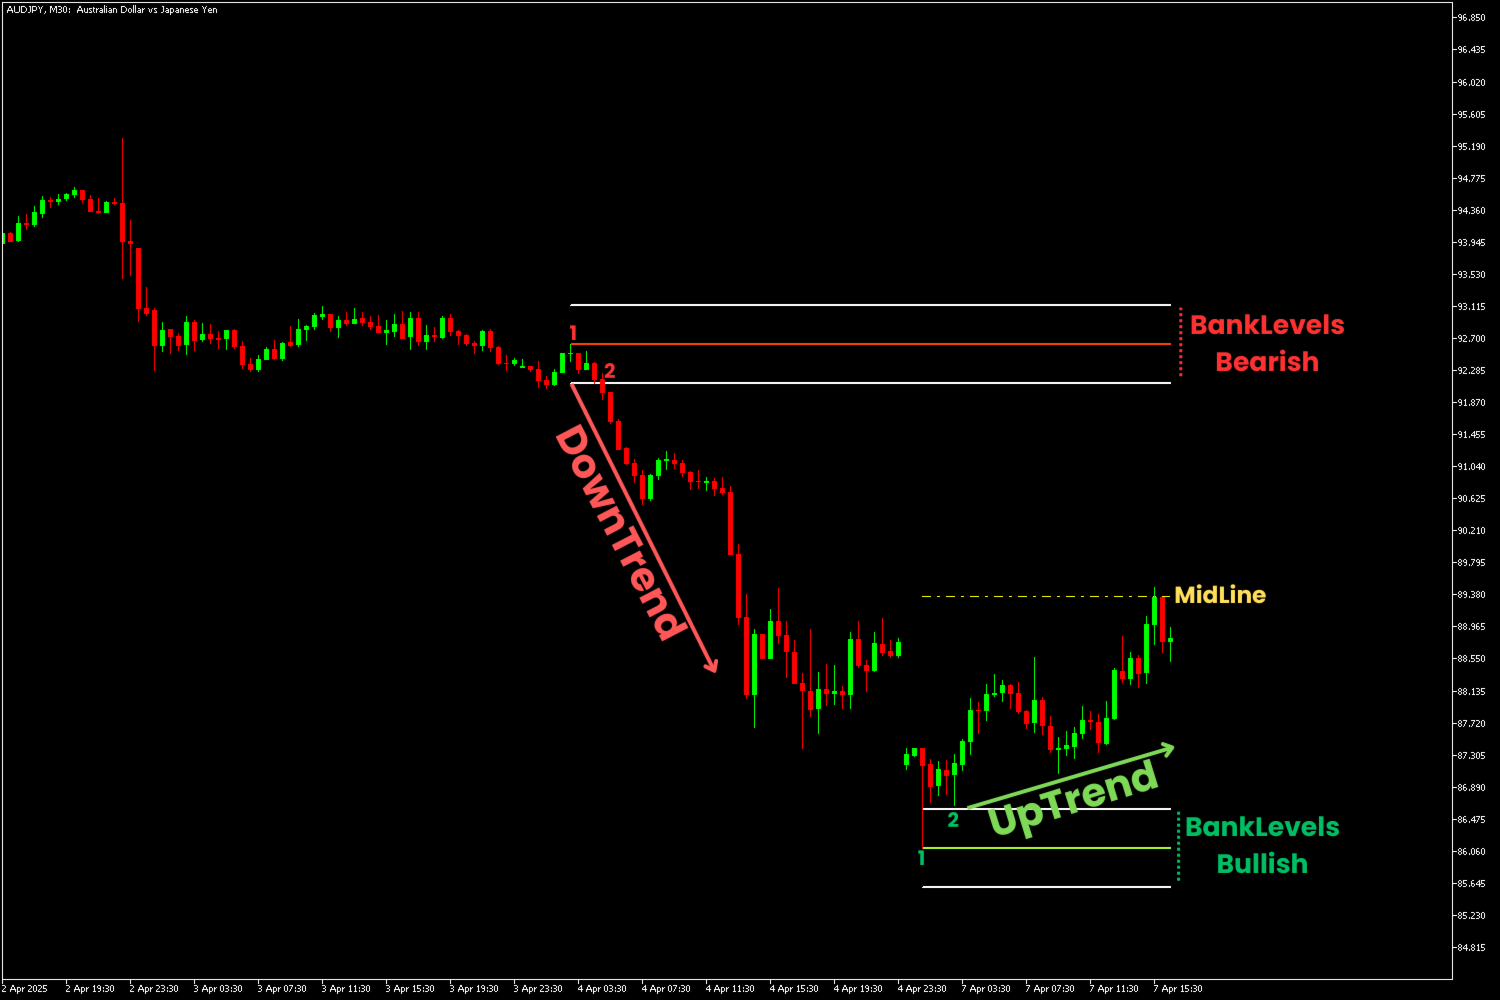
Support And Resistance Screener è in un indicatore di livello per MetaTrader che fornisce più strumenti all'interno di un indicatore. Gli strumenti disponibili sono:
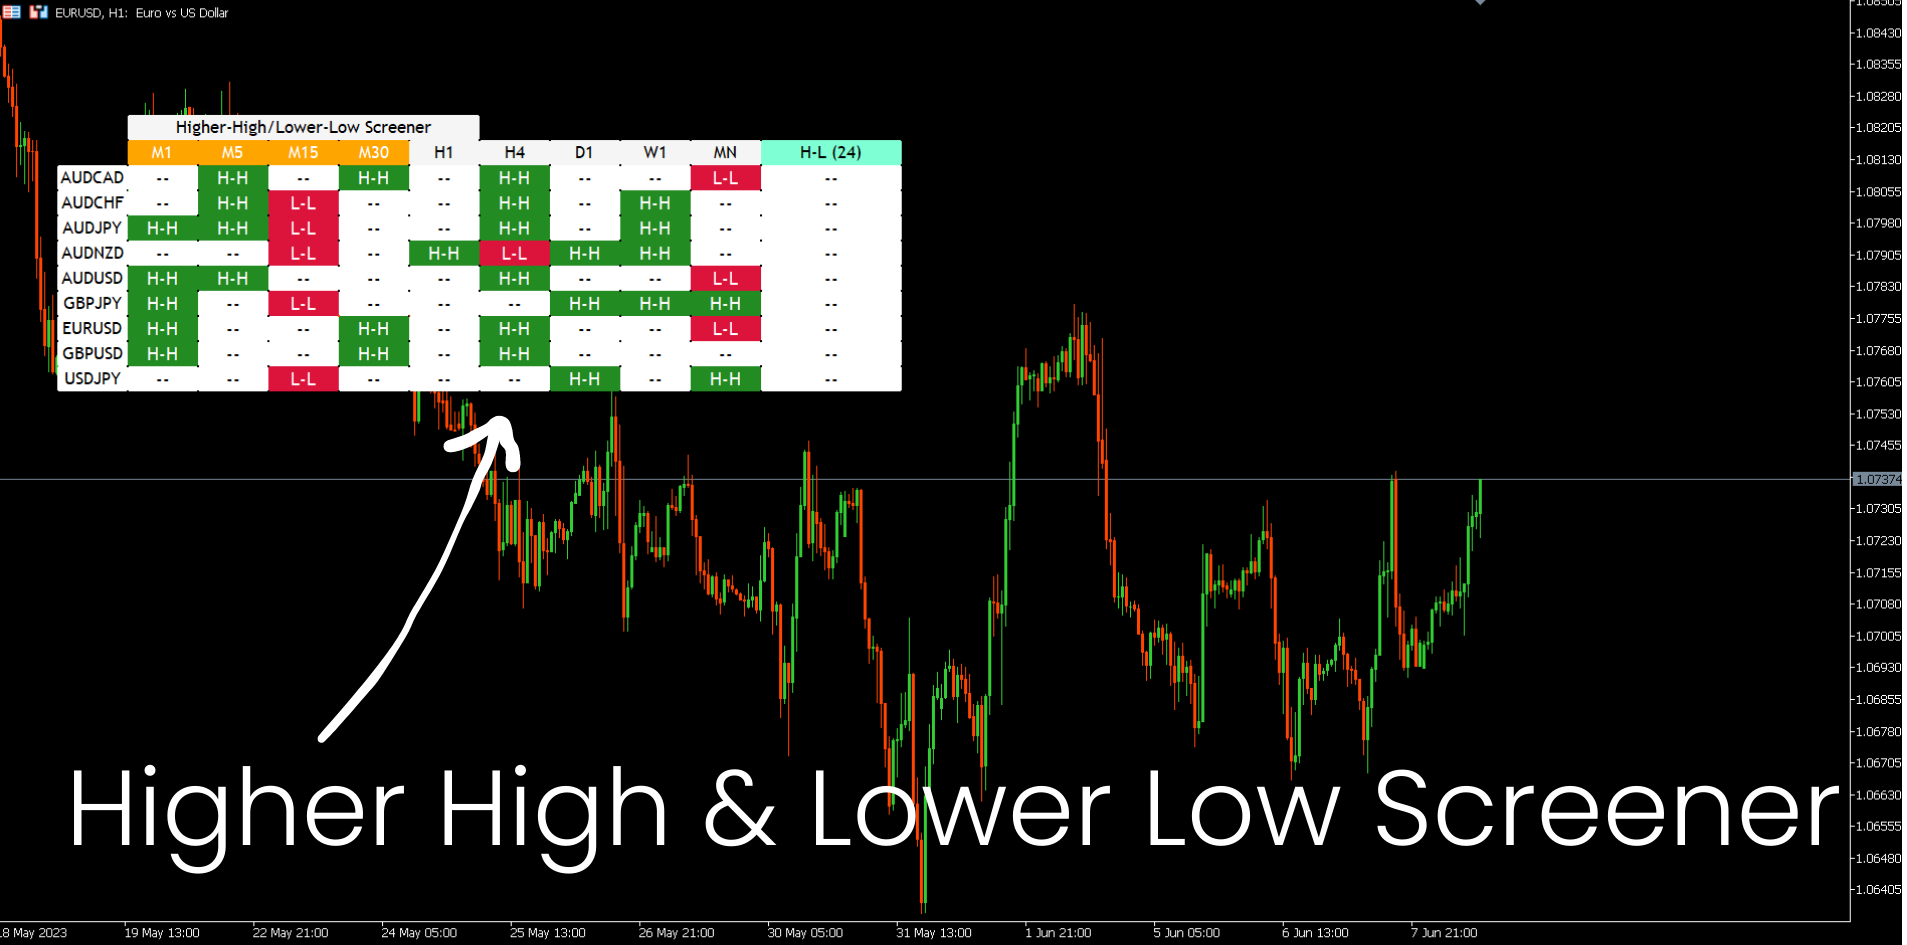
1. Screener della struttura del mercato.
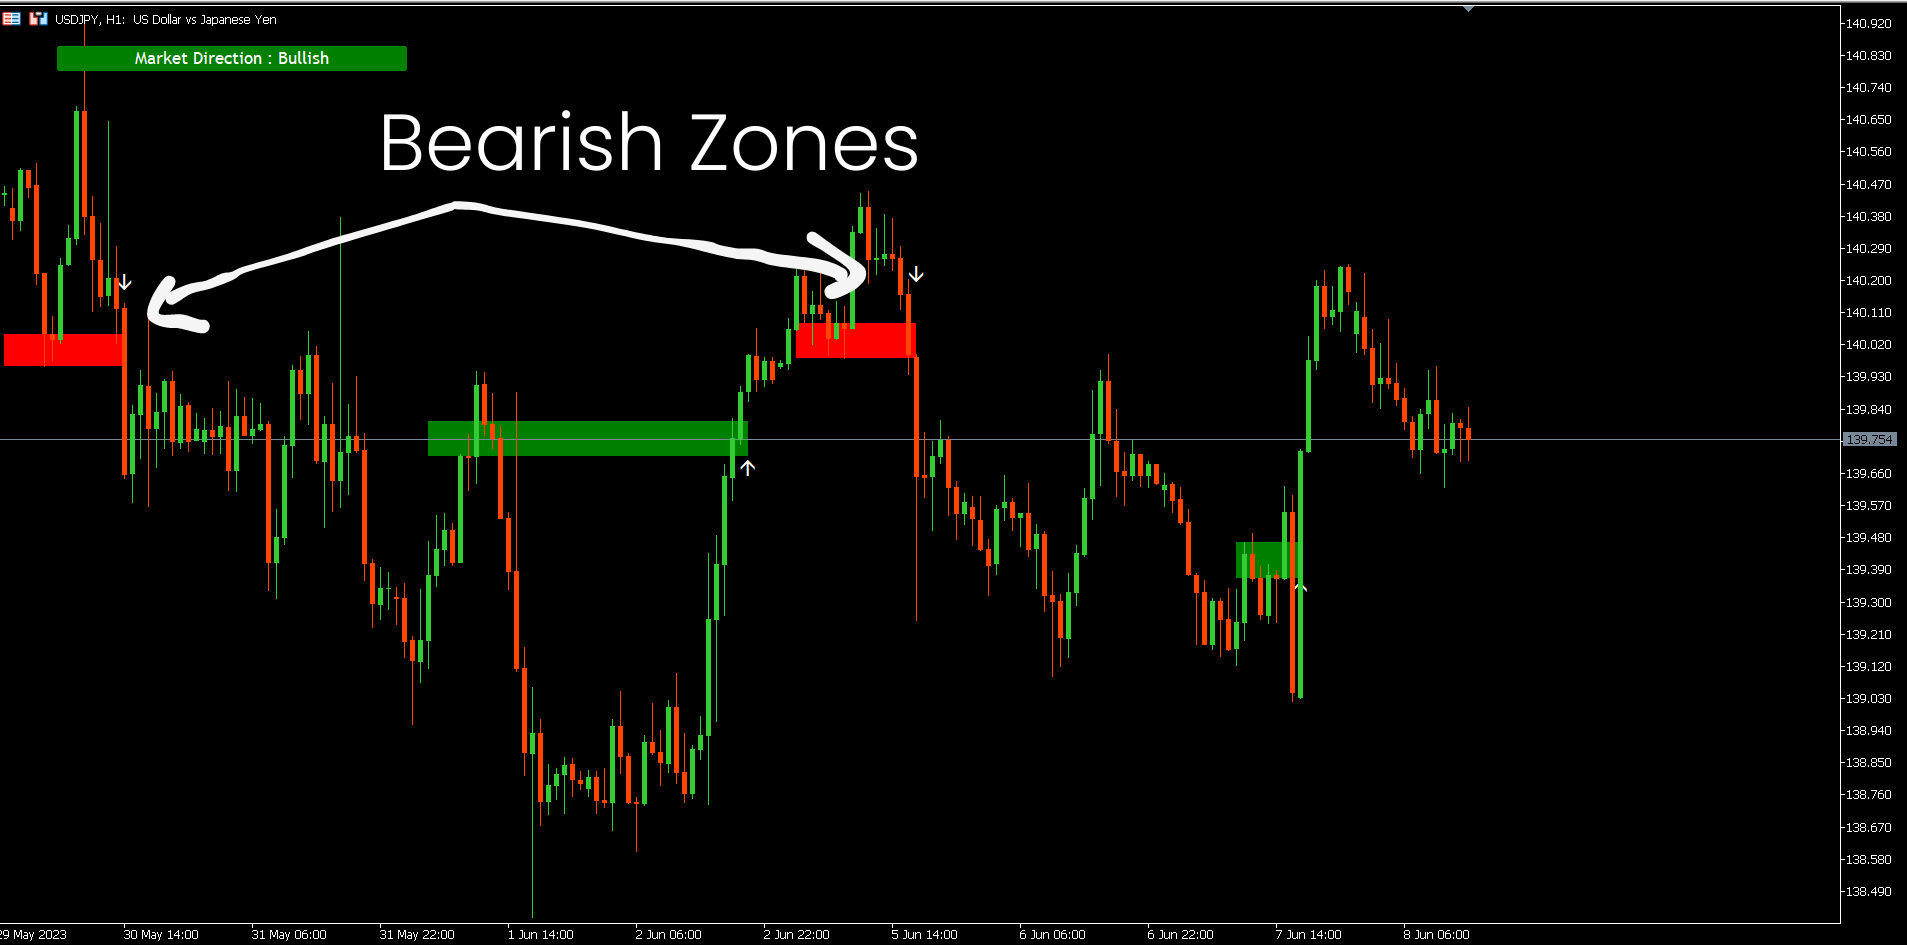
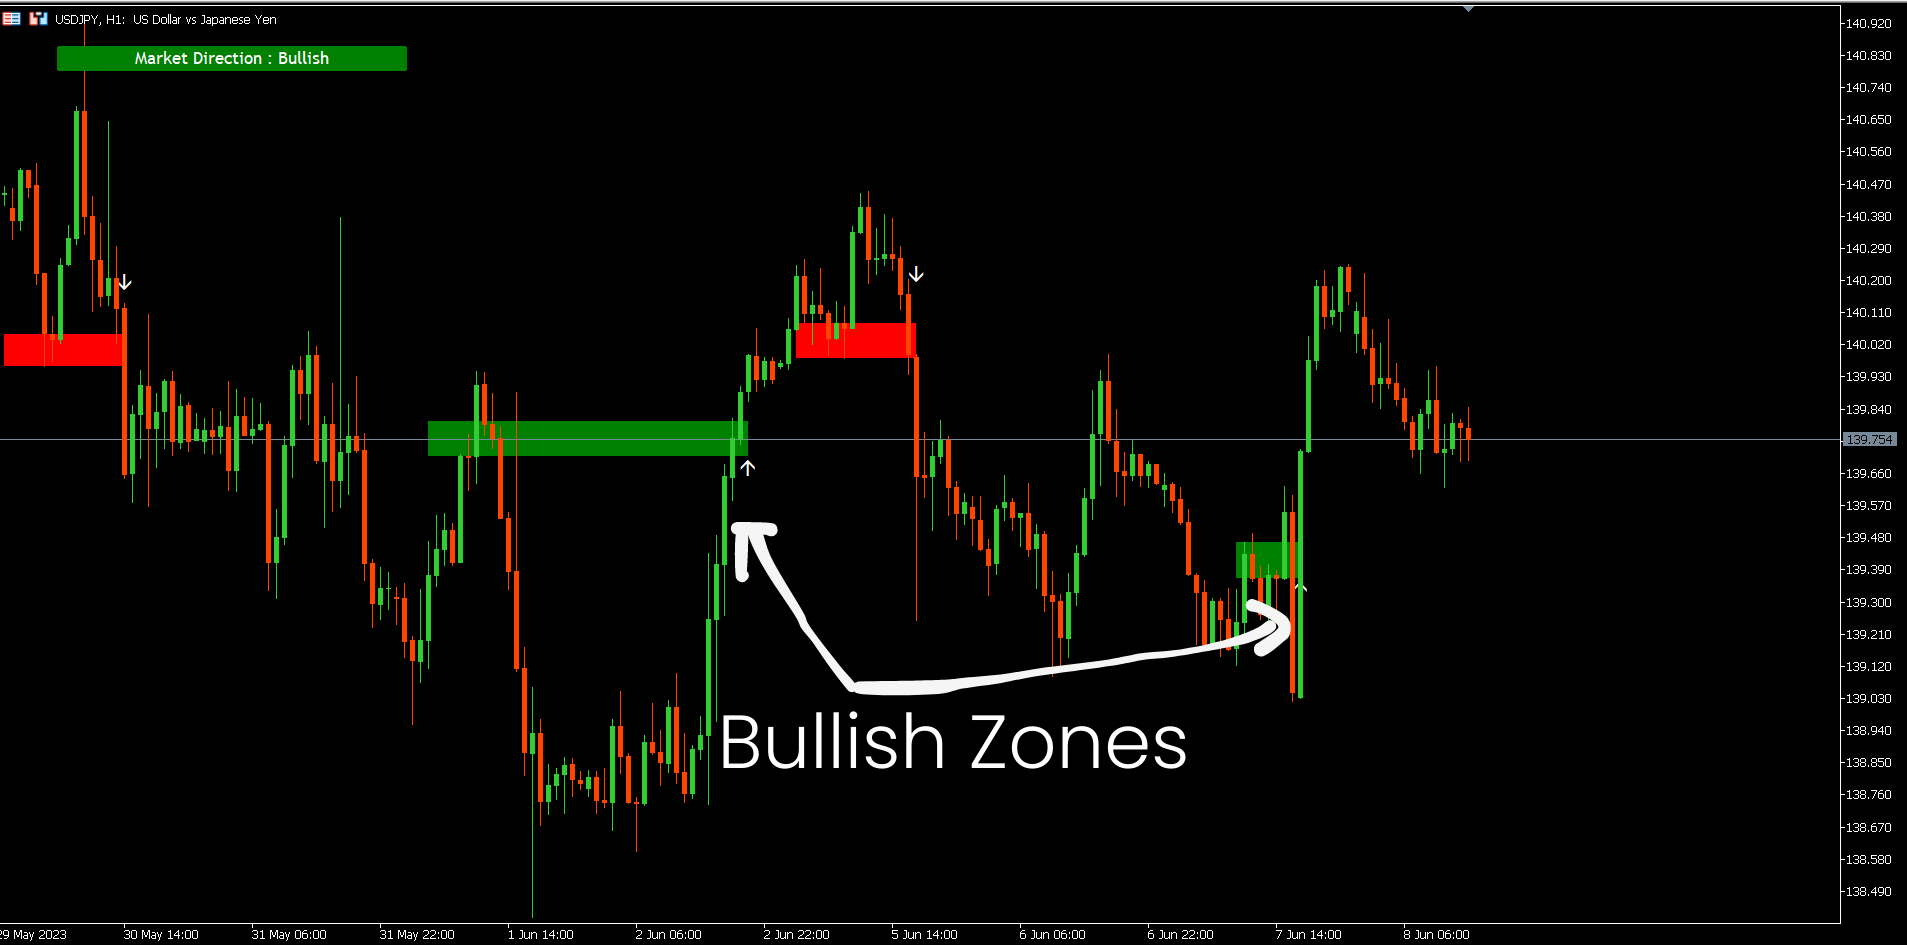
2. Zona di ritiro rialzista.
3. Zona di ritiro ribassista.
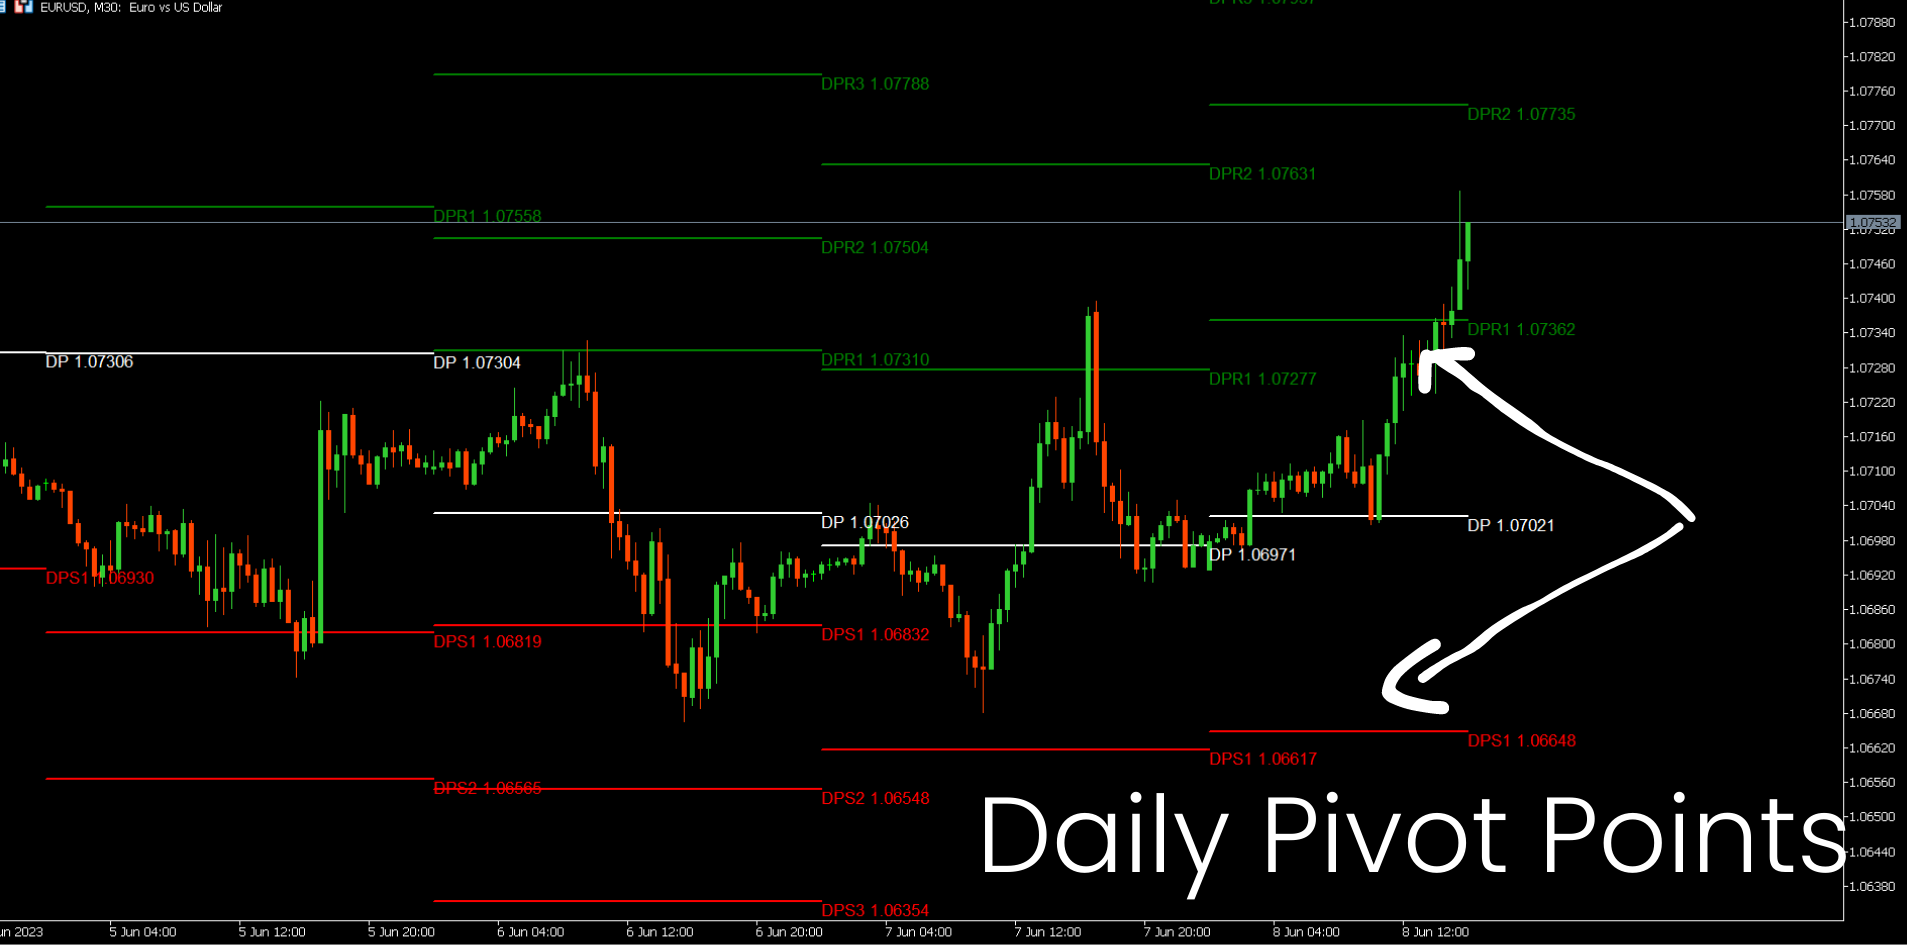
4. Punti pivot giornalieri
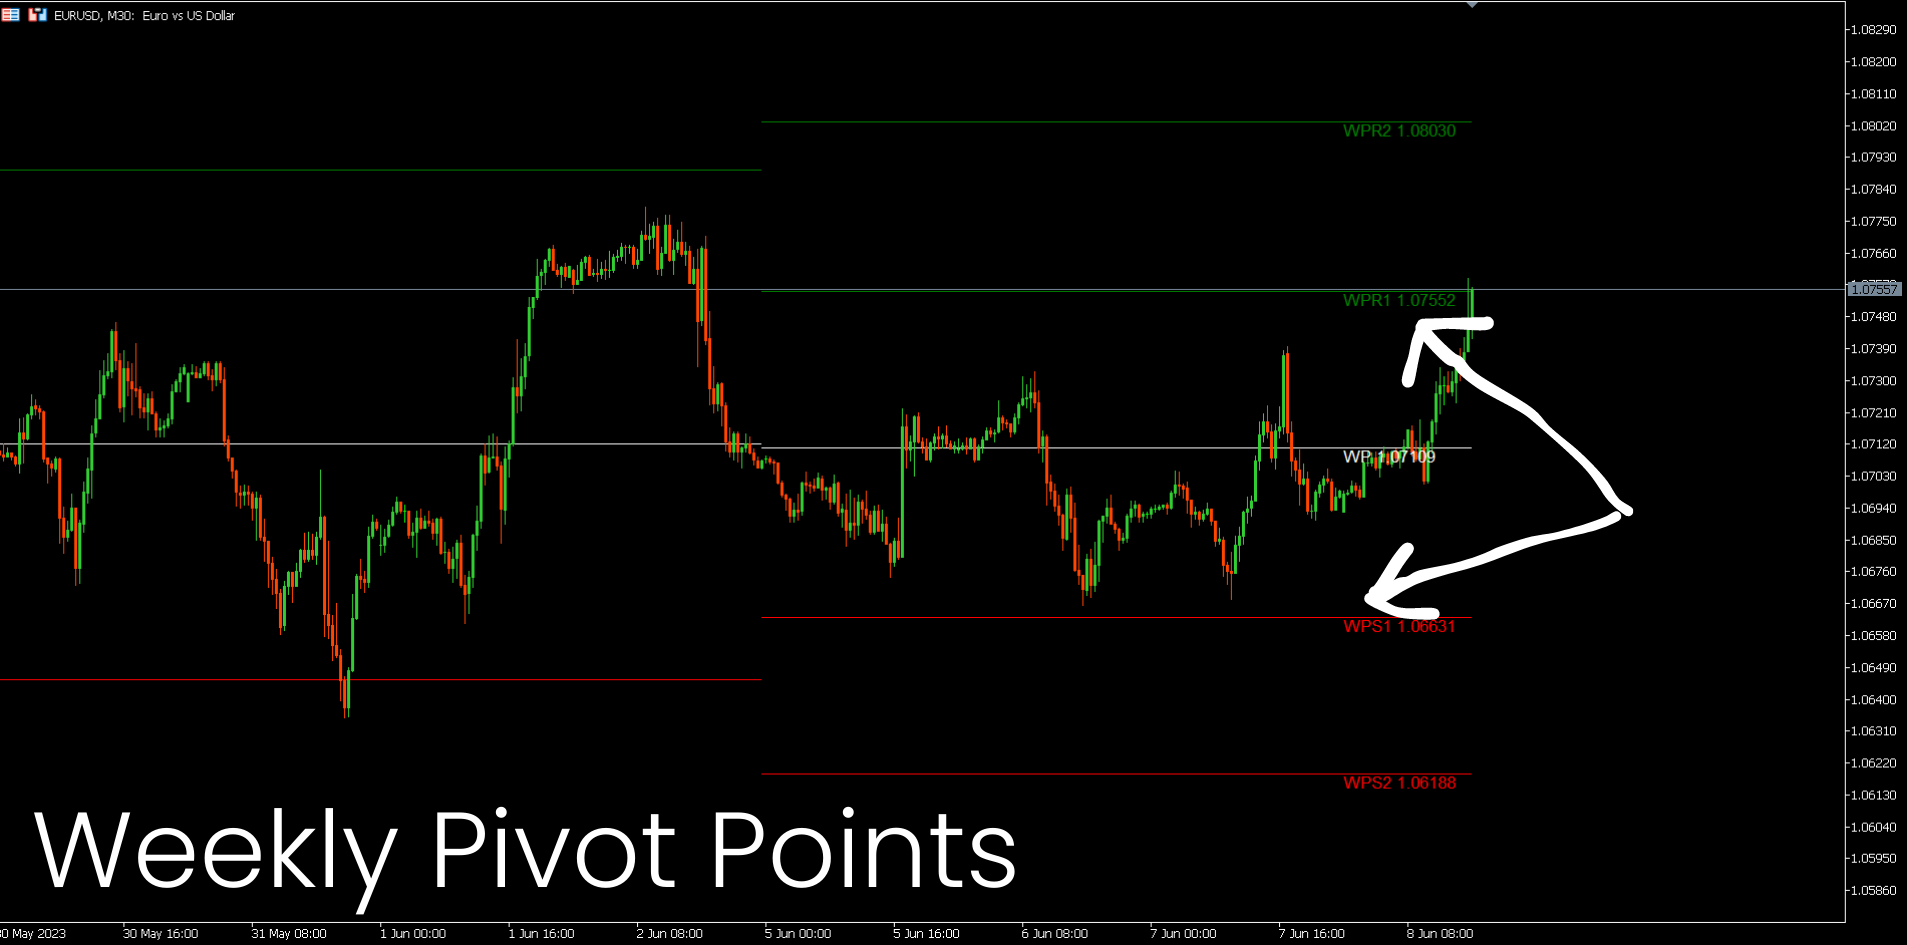
5. Punti pivot settimanali
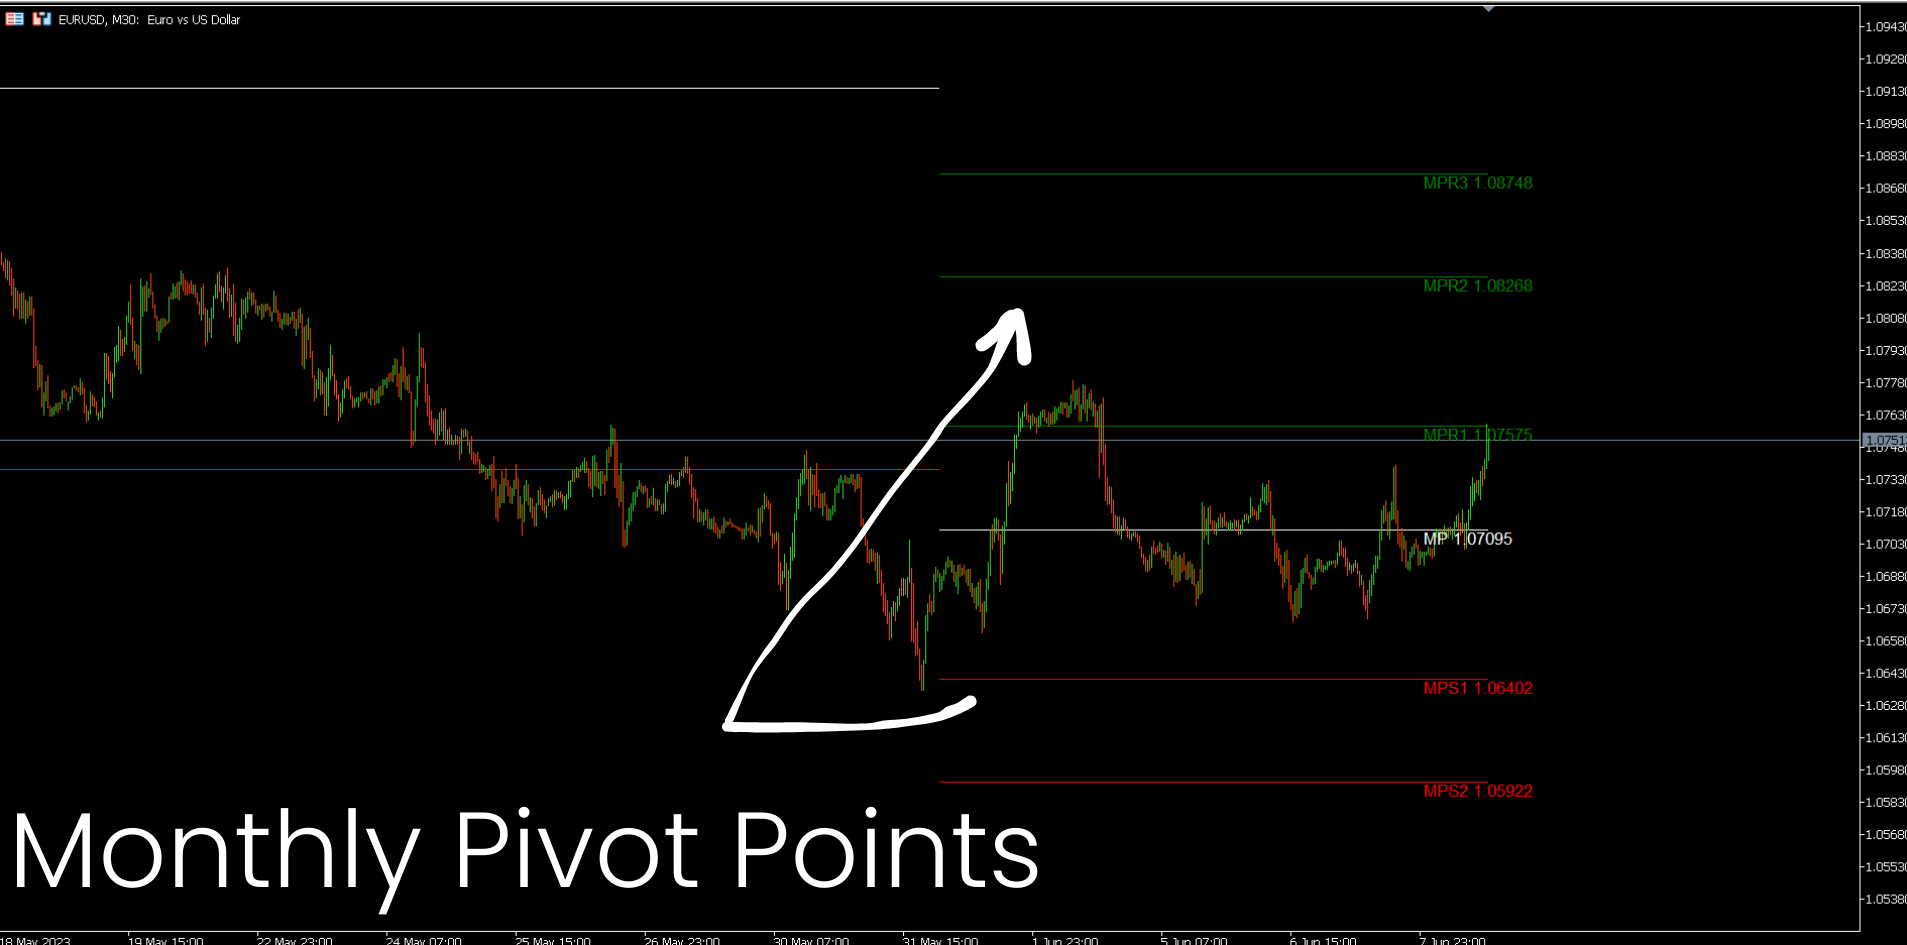
6. Punti pivot mensili
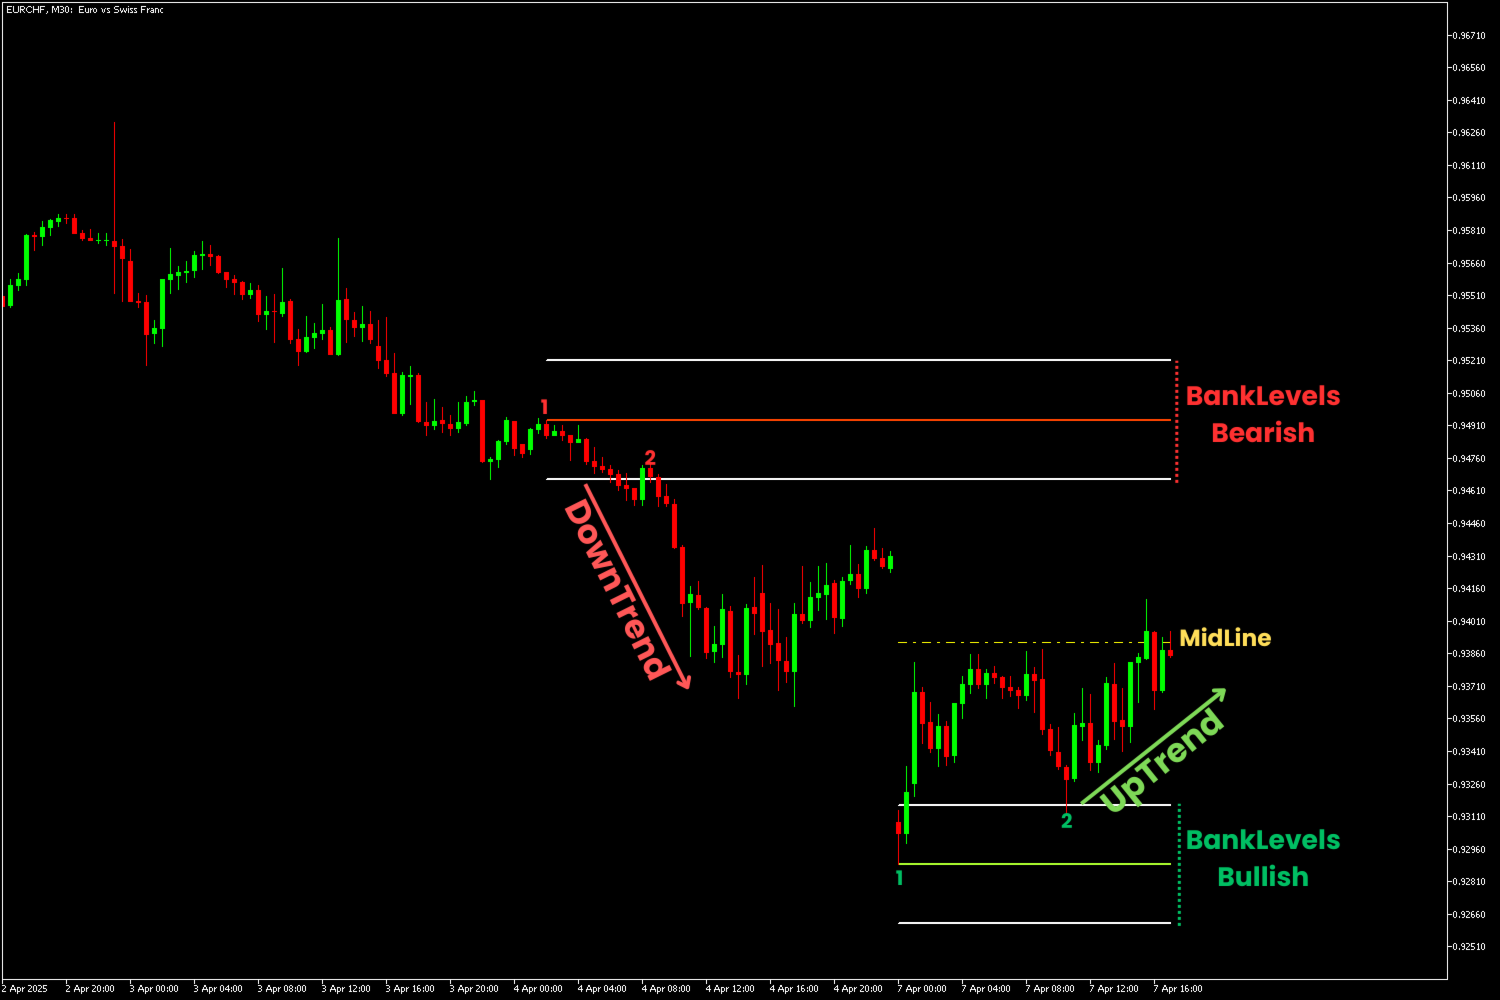
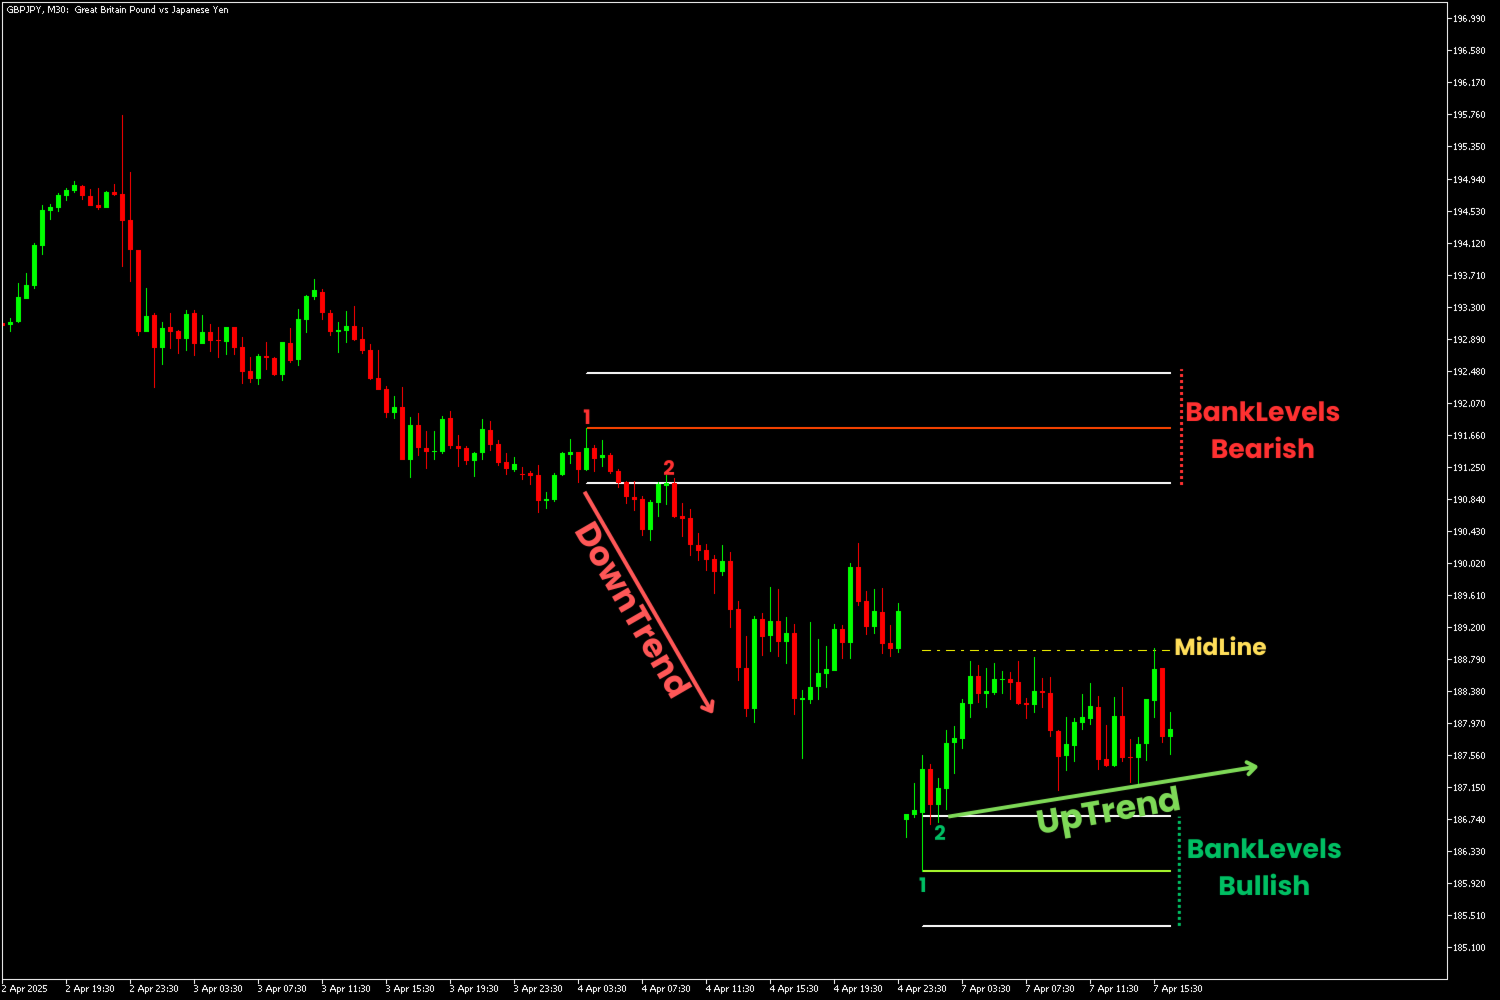
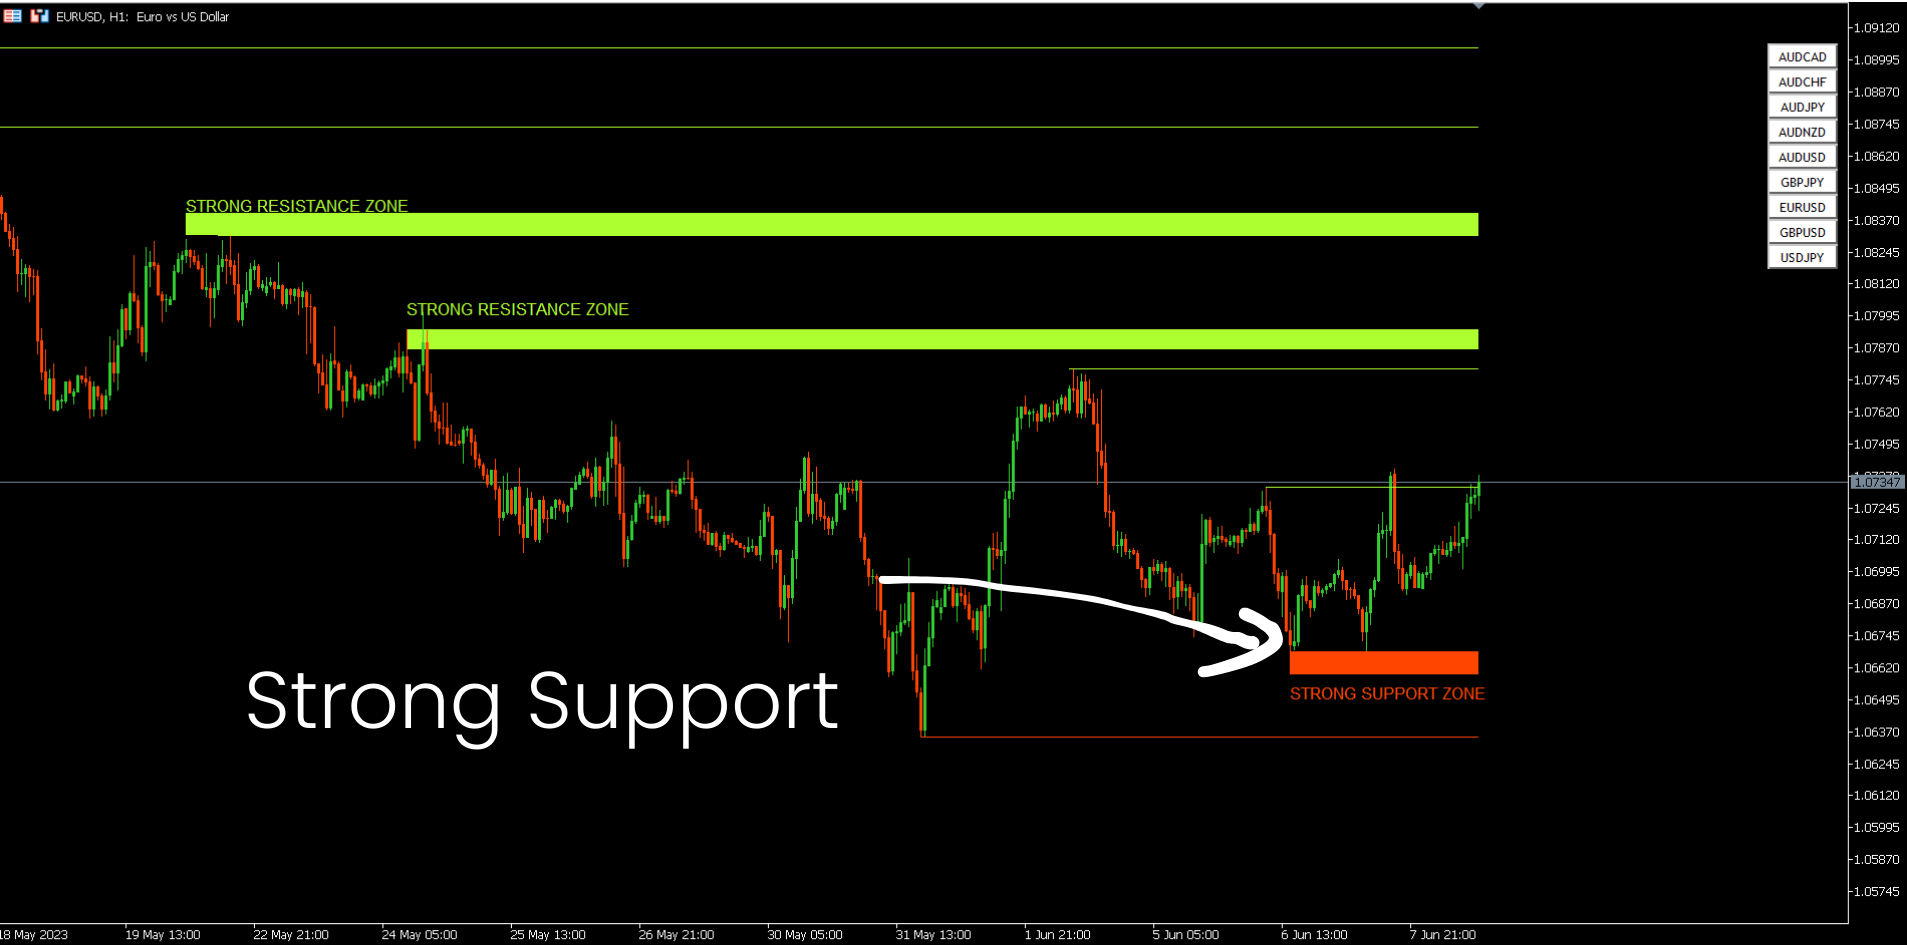
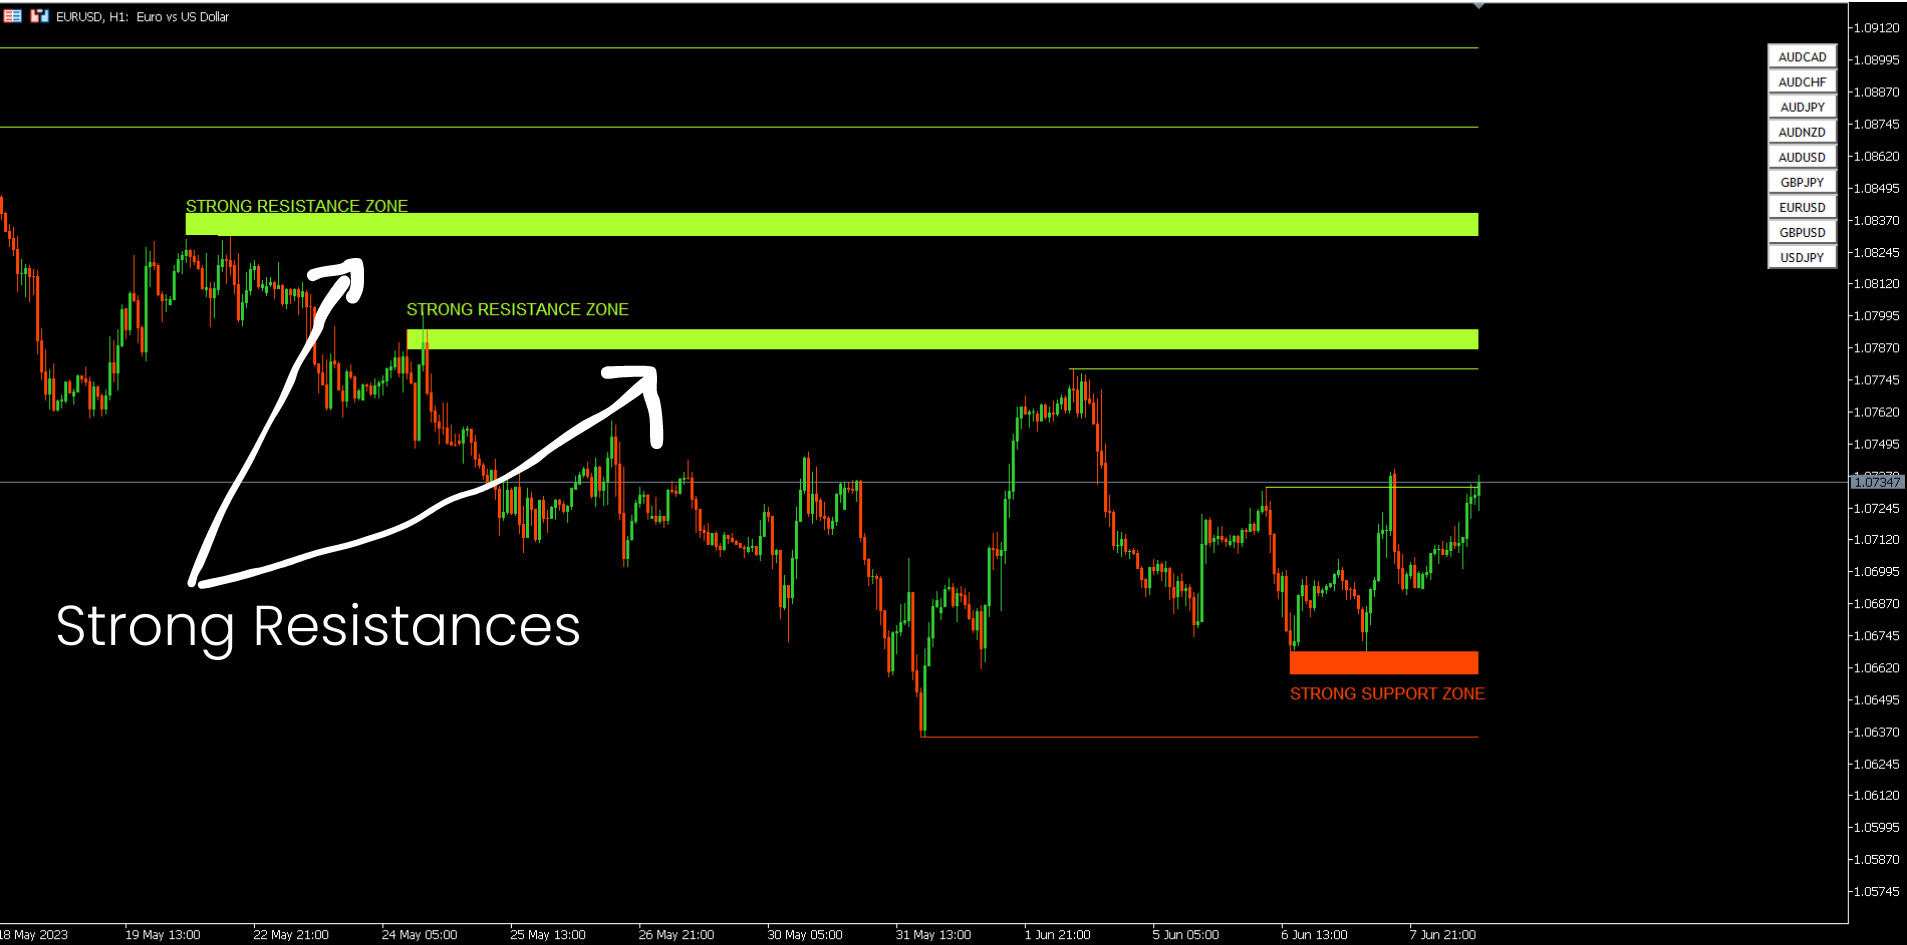
7. Forte supporto e resistenza basati sul modello e sul volume armonici.
8. Zone a livello di banca.
OFFERTA A TEMPO LIMITATO: il supporto HV e l'indicatore di resistenza sono disponibili per soli 50 $ e a vita. ( Prezzo originale 125 $ )
Vuoi provare l'indicatore senza la limitazione di Metatrader Backtester? Clicca qui per scaricare la versione Demo.Caratteristiche principali
- Forte supporto e zone di resistenza basate su algoritmi di armoniche e volume.
- Zone di pullback rialzista e ribassista basate su algoritmi Harmonic e Volume.
- Screener della struttura del mercato.
- Punti Pivot giornalieri, settimanali e mensili.
Documentazioni
Tutta la documentazione di Support and Resistance Screener (Istruzioni) e i dettagli sulla strategia sono disponibili in questo post nel nostro blog MQL5: Clicca qui. Contatto
Se hai qualche domanda o se hai bisogno di aiuto, contattami tramite messaggio privato.
Autore
SAYADI ACHREF, ingegnere del software fintech e fondatore di Finansya 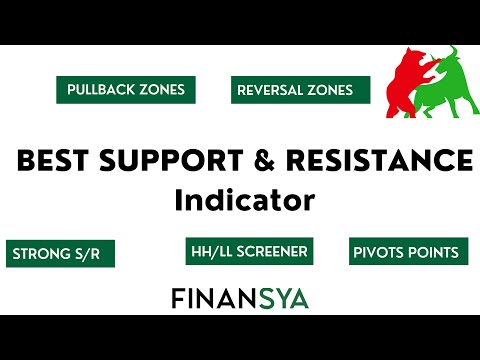


I have been using this trading system for three years. I've found that having all three indicators is significantly more effective, as they create a complete and comprehensive system.