TSO Moving Average Slope
- Indicators
-
Dionisis Nikolopoulos
 We are a small team of individuals with a strong passion for trading.
Our research is focused in the area of trading methods and mechanical trading systems
developed on the MT4 and MT5 trading platforms.
Many more features will be coming in the future, so stay with us! - Version: 1.0
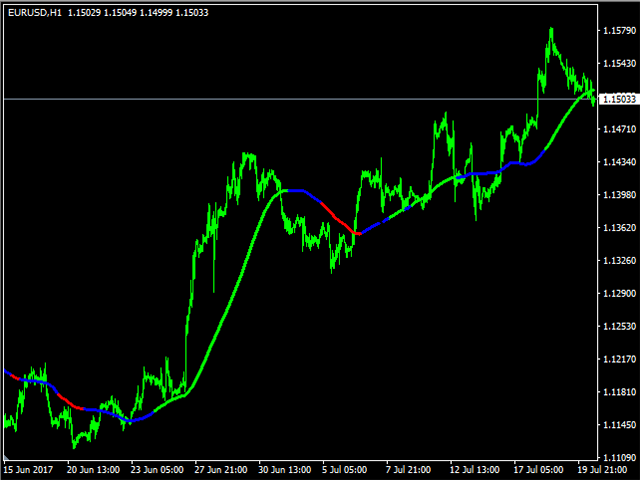
The Moving Average Slope (MAS) subtracts the moving average level n-periods ago from the current moving average level. This way, the trend of the moving average can be drawn on the moving average line.
Features
- Observe uptrends and downtrends at a glance.
- The indicator is non-repainting.
- Returns buffer values for the trend of the moving average to be used as part of an EA. (see below)
Inputs
- Moving Average Period: The period of the moving average (MA).
- Slope Period: Number of periods between the current MA level and the previous MA level.
- Include Last Bar: Include the bar being drawn in the MA calculation.
- UpTrend: Positive trend colour.
- DownTrend: Negative trend colour.
- NonTrend: No trend colour.
For EA Developers
The indicator can be easily used as part of an EA. Buffer for trend type = 3.
- Buffer value = 0: uptrend
- Buffer value = 1: downtrend
- Buffer value = 2: no trend
Good indicators