TSO Moving Average Slope
- 指标
- 版本: 1.0

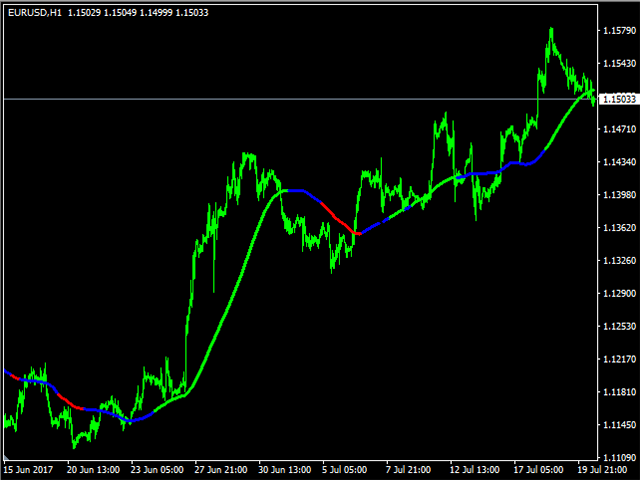
The Moving Average Slope (MAS) subtracts the moving average level n-periods ago from the current moving average level. This way, the trend of the moving average can be drawn on the moving average line.
Features
- Observe uptrends and downtrends at a glance.
- The indicator is non-repainting.
- Returns buffer values for the trend of the moving average to be used as part of an EA. (see below)
Inputs
- Moving Average Period: The period of the moving average (MA).
- Slope Period: Number of periods between the current MA level and the previous MA level.
- Include Last Bar: Include the bar being drawn in the MA calculation.
- UpTrend: Positive trend colour.
- DownTrend: Negative trend colour.
- NonTrend: No trend colour.
For EA Developers
The indicator can be easily used as part of an EA. Buffer for trend type = 3.
- Buffer value = 0: uptrend
- Buffer value = 1: downtrend
- Buffer value = 2: no trend
Good indicators