ACB Breakout Arrows
- Indicators
- KEENBASE SOFTWARE SOLUTIONS
- Version: 5.5
- Updated: 11 March 2022
- Activations: 10
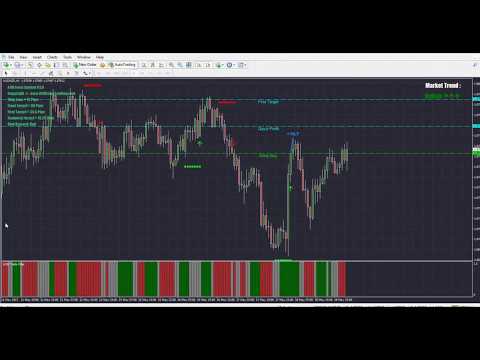
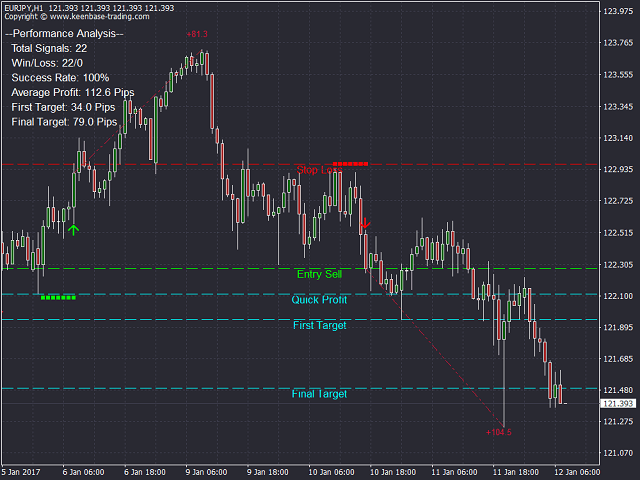
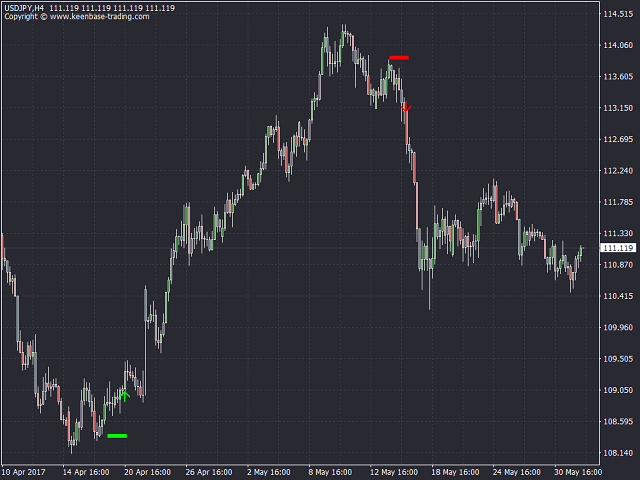
The ACB Breakout Arrows indicator provides a crucial entry signal in the market by detecting a special breakout pattern. The indicator constantly scans the chart for a settling momentum in one direction and provide the accurate entry signal right before the major move.
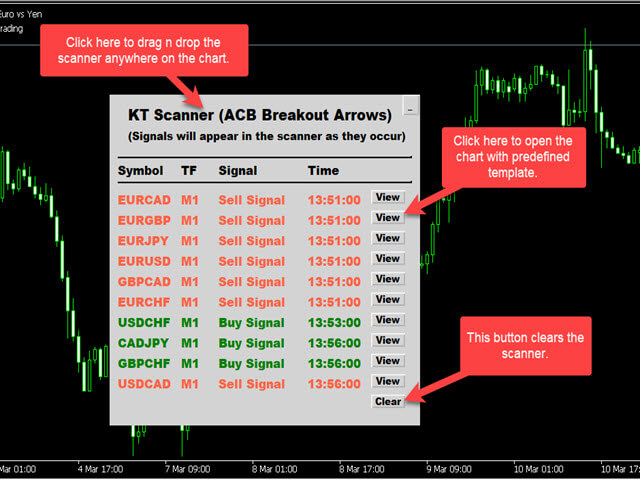
Get multi-symbol and multi-timeframe scanner from here - Scanner for ACB Breakout Arrows MT4
Key features
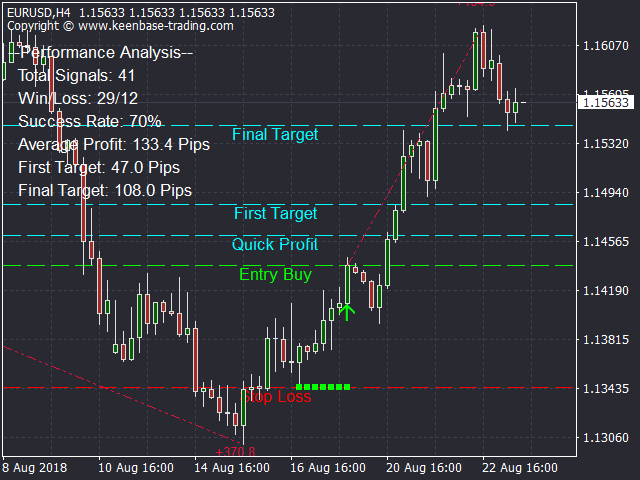
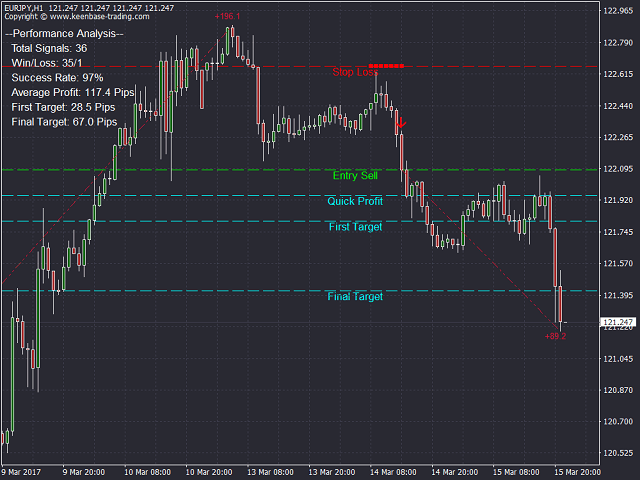
- Stoploss and Take Profit levels are provided by the indicator.
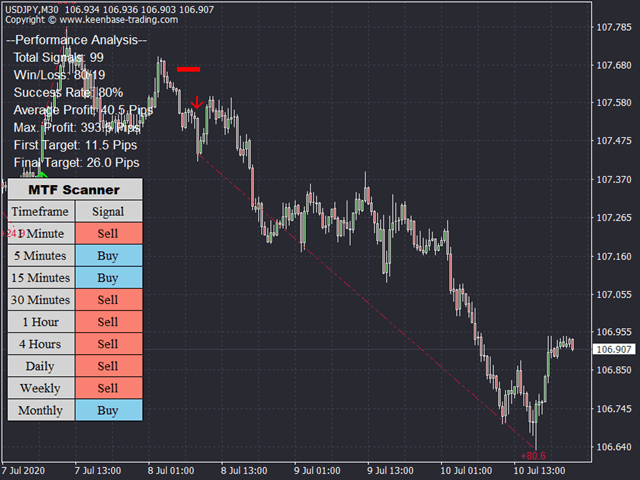
- Comes with a MTF Scanner dashboard which tracks the breakout signals across all the time-frames.
- Suitable for Day Traders, Swing Traders, and Scalpers.
- Optimized algorithm to increase the accuracy of signals.
- Special level to facilitate the Breakeven move or scalping target(Quick Profit Line).
- Performance analysis metrics such as win/loss, success rate, avg. profit etc.
- No Repaint.
Trades Confirmation
- Use ACB Trade Filter indicator to filter out the low probability trades.
- Strong Buy: Up Arrow + Green Histogram + Bullish Trend.
- Strong Sell: Down Arrow + Red Histogram + Bearish Trend.
- Avoid a trade if the histogram is Gray and Trend is Sideways.
(optional) - Use KT Support and Resistance Levels to avoid trade entry around a significant support/resistance level. Such trade entries can immediately turn negative and lead to unnecessary losses.
“The goal of a successful trader is to make the best trades. Money is secondary.” – Alexander Elder
Input Parameters
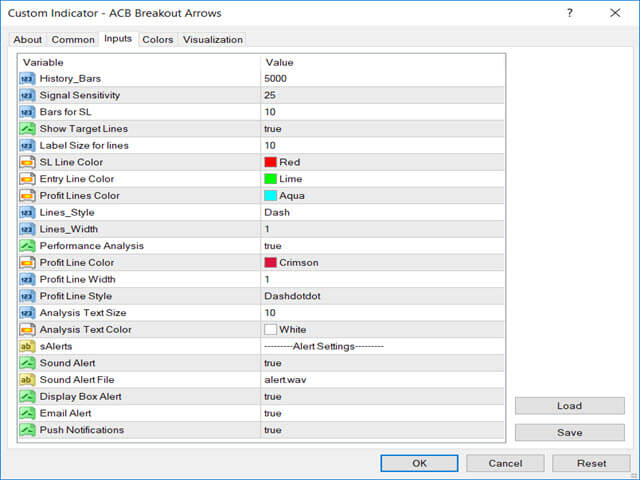
- History Bars: Number of bars to consider for Indicator's calculation.
- Signal Sensitivity: Choose the Arrow's Sensitivity (signal strength).
- Bars for SL: Numbers of bars to consider for Stop loss calculation.
- Show Target Lines: Show/hide the SL, TP and Quick profit levels on the chart.
- Performance Analysis: Show/hide the performance analysis elements included the profit trend line for each signal.
- Alert Settings: Display box, Email, Push notifications and Sound alerts are available.
EA developers
double Buy_Signal = iCustom(NULL,0,"Market/ACB Breakout Arrows", 0,1);
double Sell_Signal = iCustom(NULL,0,"Market/ACB Breakout Arrows", 1,1);
Buy_Stoploss:
if(iCustom(NULL,0,"Market/ACB Breakout Arrows", 2,1)!=0)Buy_Stoploss = iCustom(NULL,0,"Market/ACB Breakout Arrows", 2,1);
Sell_Stoploss:
if(iCustom(NULL,0,"Market/ACB Breakout Arrows", 3,1)!=0)Sell_Stoploss = iCustom(NULL,0,"Market/ACB Breakout Arrows", 3,1);
// Fetching targets from the chart
Quick Profit = NormalizeDouble(ObjectGetDouble(0,"FirstTarget",OBJPROP_PRICE),Digits);
First Target = NormalizeDouble(ObjectGetDouble(0,"Target1",OBJPROP_PRICE),Digits);
Final Target = NormalizeDouble(ObjectGetDouble(0,"Target2",OBJPROP_PRICE),Digits);


Excellent indicator