KT Momentum Arrows MT5
- Indicators
-
KEENBASE SOFTWARE SOLUTIONS
 Keenbase Trading develops professional MetaTrader 4 and MetaTrader 5 indicators and Expert Advisors designed to help traders make more informed trading decisions.
 - Version: 3.0
- Updated: 19 July 2022
- Activations: 10
KT Momentum Arrows marks bullish and bearish momentum breakouts with arrows when a candle closes beyond its adaptive price bands.
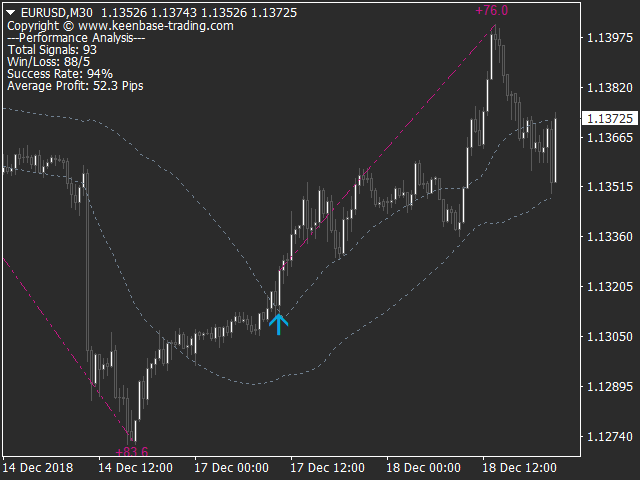
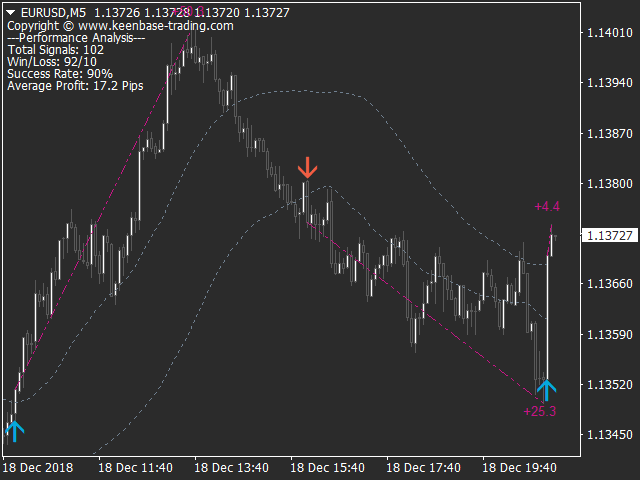
The bands respond to price deviation and changing volatility. A blue upward arrow confirms a close above the upper band, while a red downward arrow confirms a close below the lower band. The signal is fixed after the candle closes, so the arrow does not shift to another bar when you review the chart later.
What the arrow is showing
The arrow identifies the candle where momentum pushed price beyond the band. You can use it as an entry trigger or as confirmation alongside your own trend, support and resistance, or price action method. The bands remain visible around price, making it easier to judge whether the breakout is extending or losing follow-through.
Compare signals on the same chart
The optional performance panel summarizes the arrows found within the selected history. It displays total signals, wins and losses, success rate, and average movement in pips. Profit lines can also connect the measured moves between signals. This view is most useful for comparing settings on the same symbol and timeframe under the same chart conditions.
Settings that shape the result
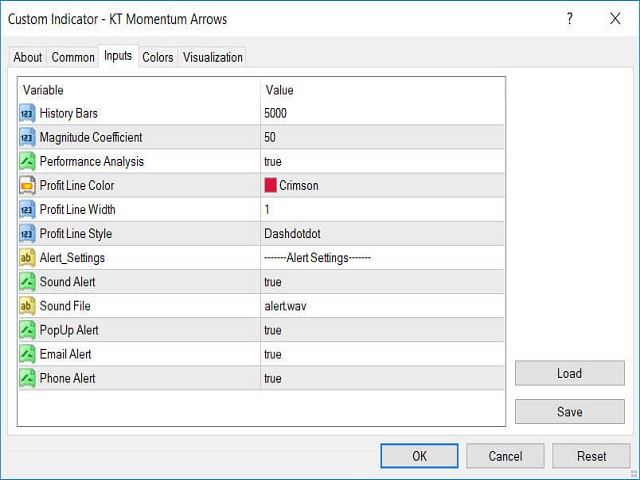
- History Bars: chooses how much chart history is calculated and included in the performance view.
- Magnitude Coefficient: adjusts how band deviation and volatility are combined. Test it for the symbol and timeframe you trade.
- Performance Analysis: shows or hides the statistics, with separate controls for profit-line colour, width, and style.
- Alerts: enable sound, popup, email, or mobile push notifications for new confirmed signals.
































































Best indicator I've ever bought.
Also, the author is very involved.