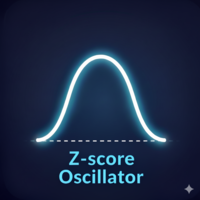
Haven ZScore Oscillator
- Indicators
-
Maksim Tarutin
 🔷 MQL5 Developer | Haven
------------------------------------------------------------
I develop trading tools for MetaTrader 5, including indicators, utilities, and Expert Advisors.
My main areas of interest are market structure, liquidity, price action, volatility, and systematic trading. - Version: 1.0
- Activations: 10
Haven ZScore Oscillator is a powerful statistical oscillator designed to identify anomalous price deviations from its average value. The indicator doesn't just follow the price, but measures how statistically significant the current price is, allowing for high-precision identification of overbought/oversold zones and potential trend reversal points.
This tool will become an indispensable assistant for traders who prefer a data-driven approach and aim to enter the market at moments when the probability of a correction or trend change is at its maximum.
Other products -> HERE.
Key Features:
-
Statistical Approach to Analysis: Unlike classic oscillators that use fixed levels (e.g., 70/30 for RSI), the Haven ZScore Oscillator uses standard deviation. This allows for an objective assessment of how extreme the current price position is relative to its recent behavior.
-
Clear Extremum Zones: The indicator automatically shades the areas above and below the set threshold values. These colored zones instantly draw attention to situations where the market is in a state of strong overbought (red zone) or oversold (green zone).
-
Precise Reversal Signals: A special algorithm generates buy and sell arrows at the exact moment when the Z-Score forms a local peak in an extreme zone. The signals appear on a closed bar, which eliminates repainting and increases their reliability.
-
Flexible Notification System: Never miss a trading opportunity. The indicator is equipped with a full set of alerts: pop-up alerts in the terminal (Alerts), push notifications to a mobile phone, and sound signals.
-
Full Customization to Your Trading Style: You can configure everything: the calculation period, threshold levels for signals, colors of lines and zones, as well as the transparency of the fill to perfectly fit the indicator into your workspace.
The Statistical Basis of Z-Score:
The effectiveness of the indicator is based on the law of normal distribution. The table below shows how rare an event is when the price deviates by a certain number of standard deviations (sigma) from its average value.
| Z-Score Value (level of deviation) | Probability of the price being BEYOND this level |
|---|---|
| ±1.0 (One sigma) | ~31.7% |
| ±2.0 (Two sigmas) | ~4.55% |
| ±2.5 (Default level) | ~1.24% |
| ±3.0 (Three sigmas) | ~0.27% |
| ±4.0 (Four sigmas) | ~0.0063% (extremely rare event) |
As can be seen from the table, a Z-Score value above 2.5 means that the price has entered a zone where it statistically stays only about 1% of the time. Such anomalous deviations often precede a correction or reversal, providing the trader with a high-probability entry point.
Practical Application Scenarios:
This indicator is particularly useful in the following trading situations:
-
Mean Reversion Trading: This is the primary strategy for the Z-Score. When the indicator line goes deep into the red zone (>2.5) and a sell arrow appears, it is a strong signal of a likely price decrease towards its average value (the zero line). The same applies to buys in the green zone.
-
Identifying Trend Exhaustion: Z-Score values reaching extreme levels (e.g., +/- 4) often signal the emotional exhaustion of the current trend. This can be an excellent moment to take profit on current positions or prepare for a counter-trend trade.
-
Filtering Trades with the Trend: Use the Haven ZScore Oscillator as a filter. For example, if your main strategy has given a buy signal, but the Z-Score is already in the red overbought zone, it would be wiser to skip such an entry, as the growth potential is already limited.
In conclusion, the Haven ZScore Oscillator is not just another oscillator. It is a professional statistical tool that replaces subjective assessments with objective data, helping you to filter out market noise and make informed trading decisions based on real market anomalies.