BoxChart MT5
- Indicators
-
Evgeny Shevtsov
 Indicators for volume trading :
Volume profile,
Classic profile,
Clusters chart,
Demand and supply levels,
Demand and supply diagram,
Cumulative delta.
Indicators for probabilistic analysis :
Monte Carlo predictor,
Neural predictor. - Version: 4.4
- Updated: 30 April 2026
- Activations: 10
The market is unfair if only because 10% of participants manage 90% of funds. An ordinary trader has slim changes to stand against these "vultures". This problem can be solved. You just need to be among these 10%, learn to predict their intentions and move with them.
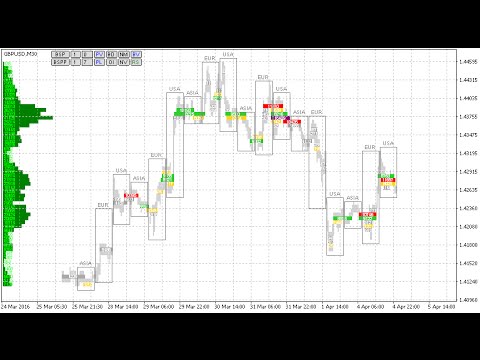
Volume is the only preemptive factor that faultlessly works on any timeframe and symbol. First, the volume appears and is accumulated, and only then the price moves. The price moves from one volume to another. Areas of volume accumulation form reliable support/resistance levels and are regularly "tested" by the price providing the best market entry opportunity. The method of trading using this indicator comes down to trading from one strong area to another.
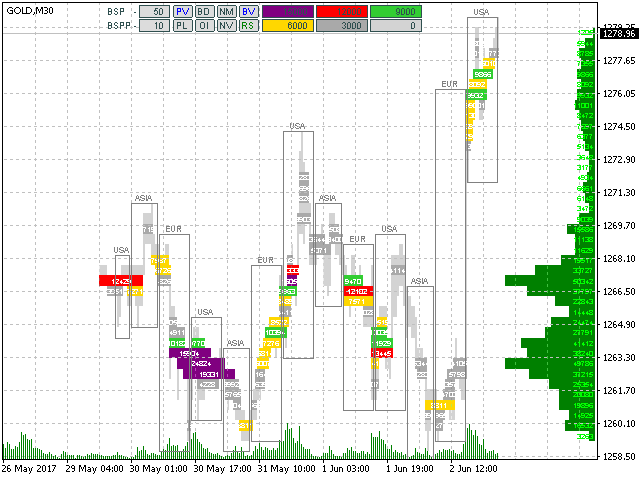
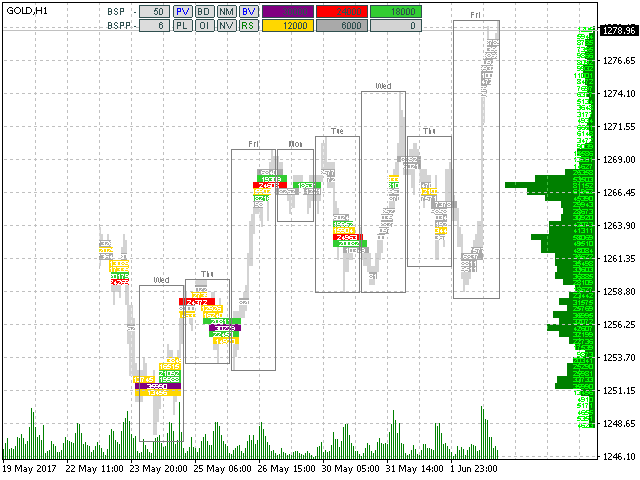
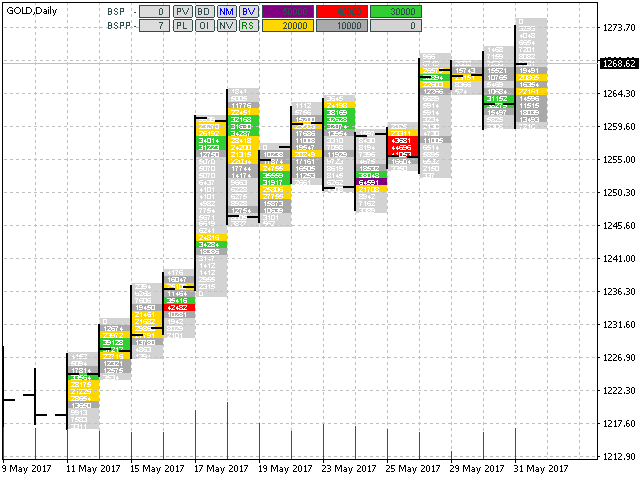
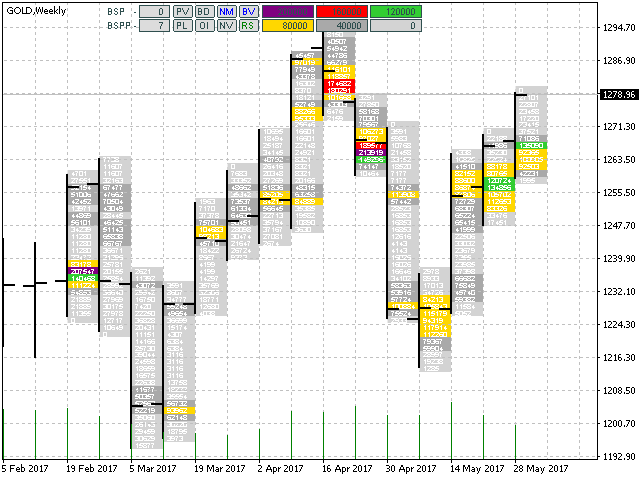
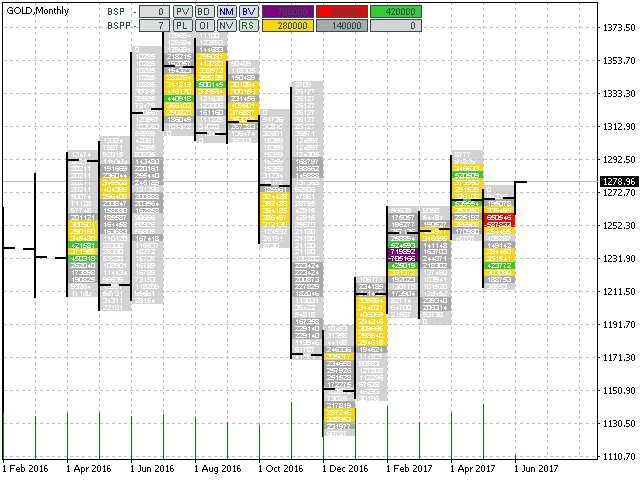
Indicator operation principle
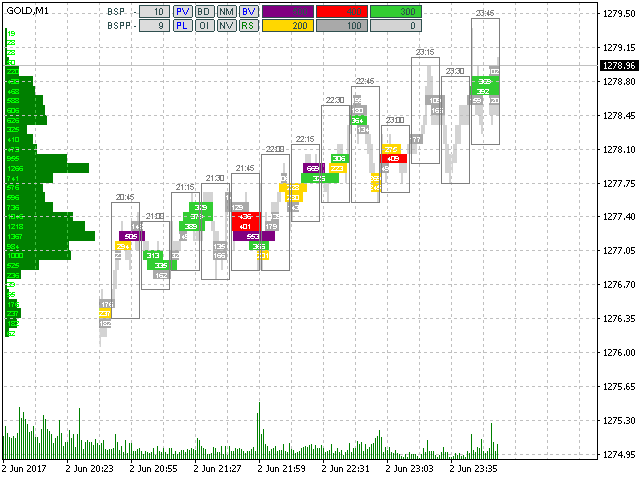
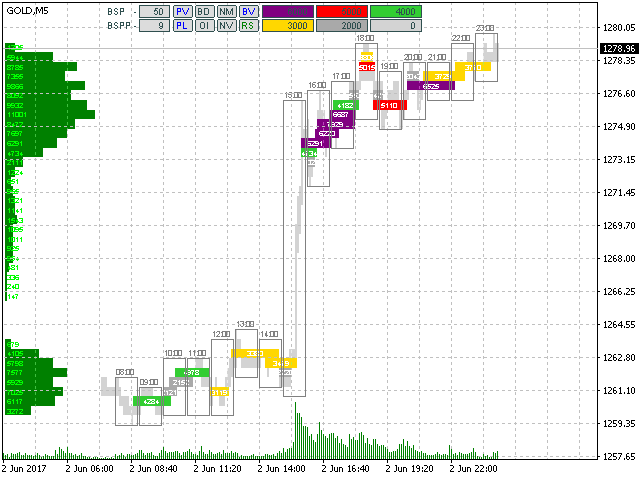
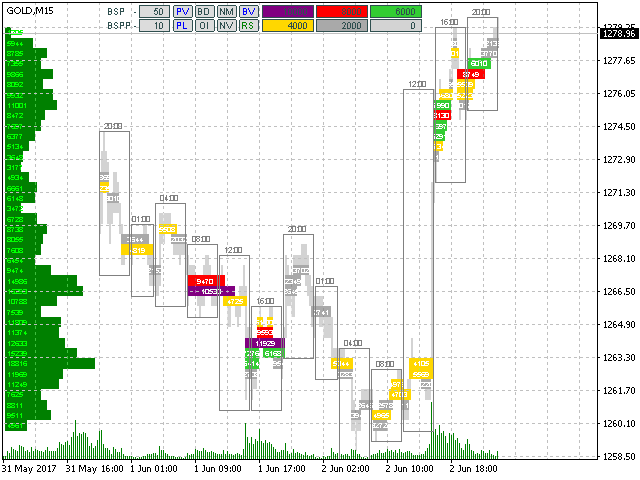
The BoxChart indicator calculates volume clusters, sorts them according to their completeness and marks them in appropriate colors. In addition, the indicator sums all clusters and displays the result on the price axis as a horizontal volume scale (the market profile).
The indicator works on all timeframes available in the terminal, but uses historical data of smaller periods (relative to the current one) M1, M5, H1, H4 and D1 for calculations. Before launching the indicator, download the history of these timeframes by scrolling the chart to the left. If there are no data, the indicator displays the appropriate message and perform drawings only where the data are available.
The indicator performs all drawings only in the chart view area but you can scroll the chart to the history. The clusters may "blink" when scrolling the chart. This is a normal behavior since they are being re-sorted.
Clusters having the same color but different length (within a single price line) are approximately similar by their volume.
Indicator buttons
- BSP – increase/decrease a fixed step of a price grid. Set in "old" points. If 0, the calculation step is taken from the parameter set by the BSPP button.
- BSPP - increase/decrease a dynamic step of a price grid. Set in monitor pixels.
- PV – enable/disable the volume profile.
- PL – volume profile to the left/right.
- BD - in this mode, each cluster contains the volume concentration rather than the volume itself. The cluster volume may be relatively small or even imperceptible, but its high concentration per time unit indicates high activity on this candle (candles) and on the given price level.
- OI - enable/disable the open interest mode obtained mathematically by consecutive zeroing of mutually absorbing volumes. Only the volumes unaffected by the operation are left to be displayed in the clusters and the profile.
- NM – enable/disable the mode of line-by-line splicing of adjacent clusters.
- VT – volume scale:
- VT – tick volumes
- VR – real volumes
- VN – without volumes (volumes are emulated according to the TPO principle).
- BV – enable/disable period frames.
- RS – reset to default settings.
Inputs
- DigitsFontSize – font size of labels on clusters.
- BordersFontSize – font size of labels above the period frames.
- Auto sorting of clusters is performed in increments of 1/6. As a result, we have six color graduations. The color matching of these cluster graduations can be adjusted with color variables: LowestBoxColor - up to 1/6, LowBoxColor - up to 2/6, MiddleBoxColor - up to 3/6, MediumBoxColor - up to 4/6, HighBoxColor - up to 5/6, HighestBoxColor - up to 6/6 of the maximum accumulation in the visible area.
- The manual sorting of clusters is set by users via the following inputs: HighestBoxValue, HighBoxValue, MediumBoxValue, MiddleBoxValue, LowBoxValue and LowestBoxValue that set the upper cluster volume level, above which the cluster receives the appropriate color.
The remaining inputs refer to other color settings, and their purpose is clear from their name.


Thank you for a great indicator, it gives a lot of information.