Scalping Lines System
- 지표
- 버전: 2.0
- 업데이트됨: 24 2월 2026
- 활성화: 10

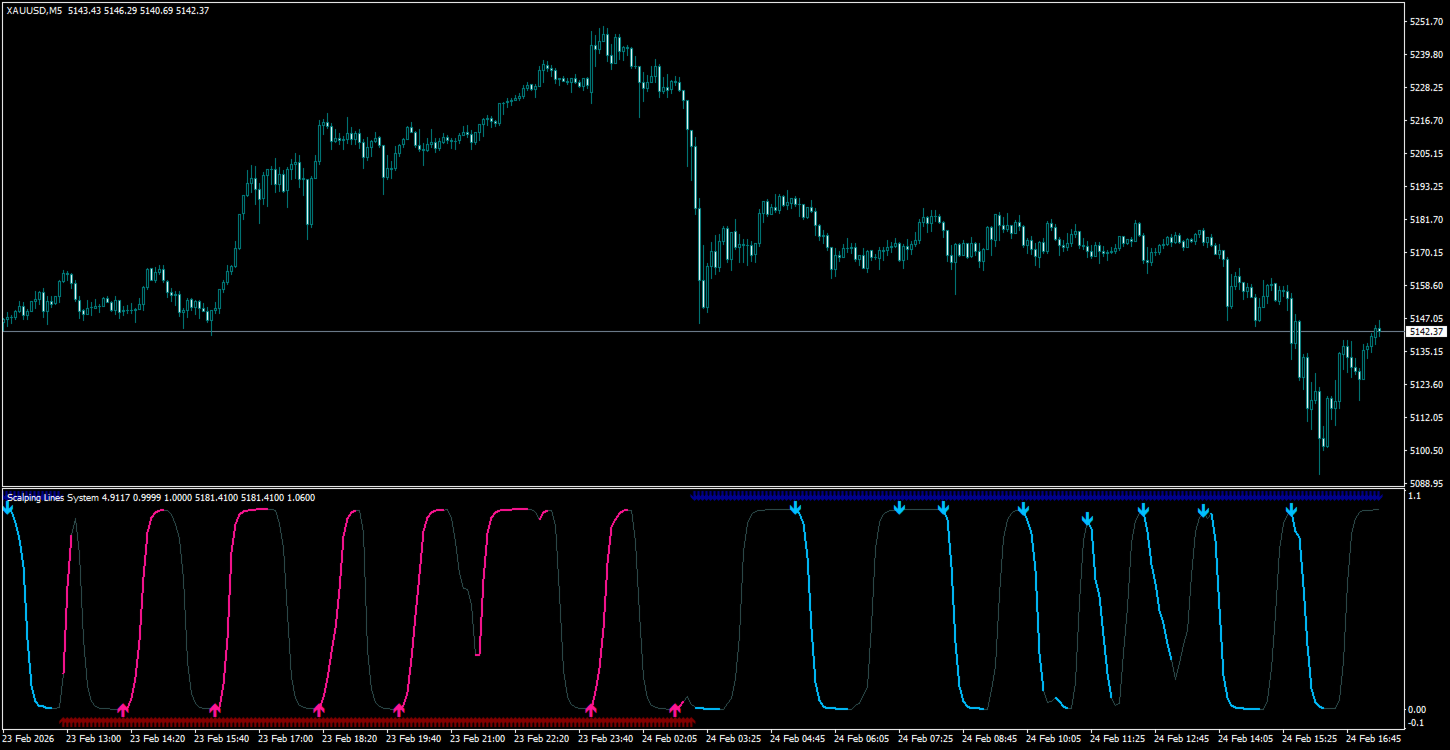
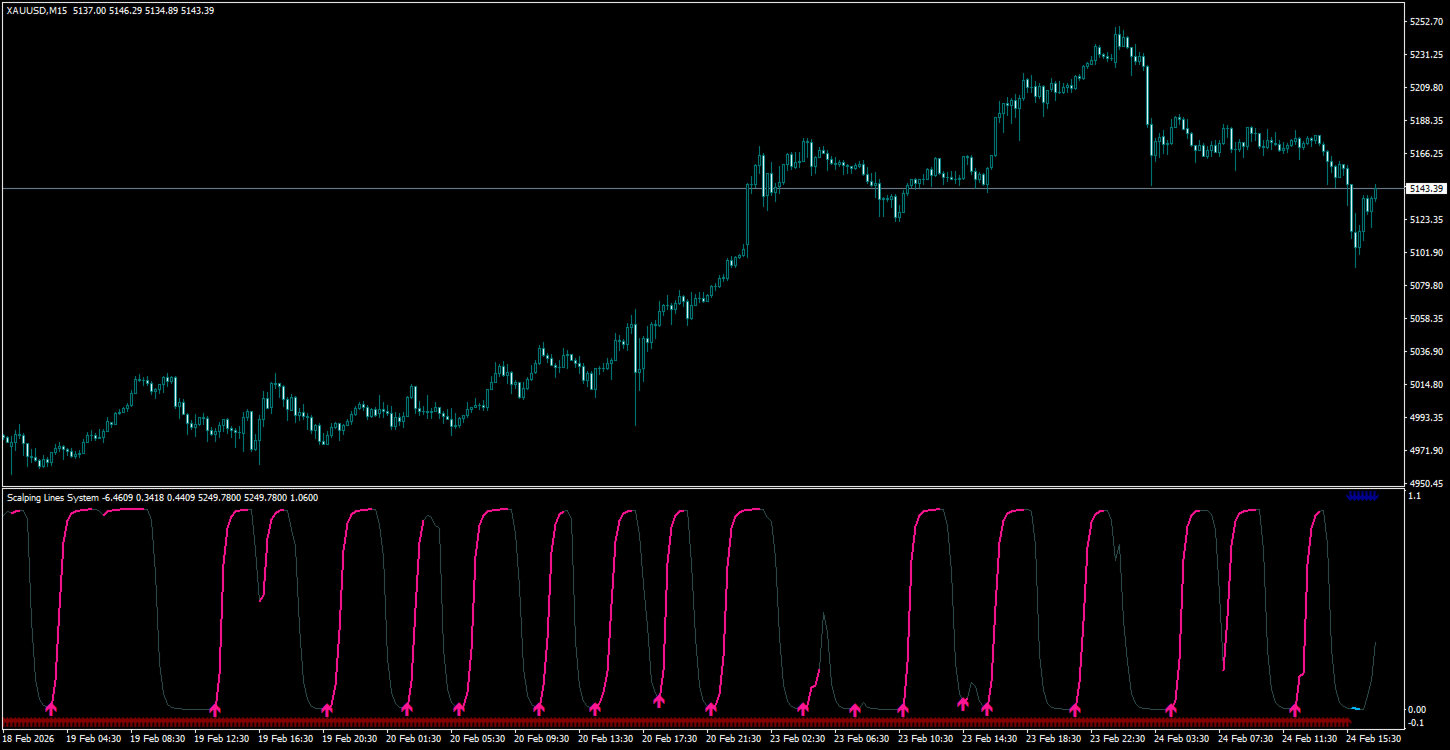
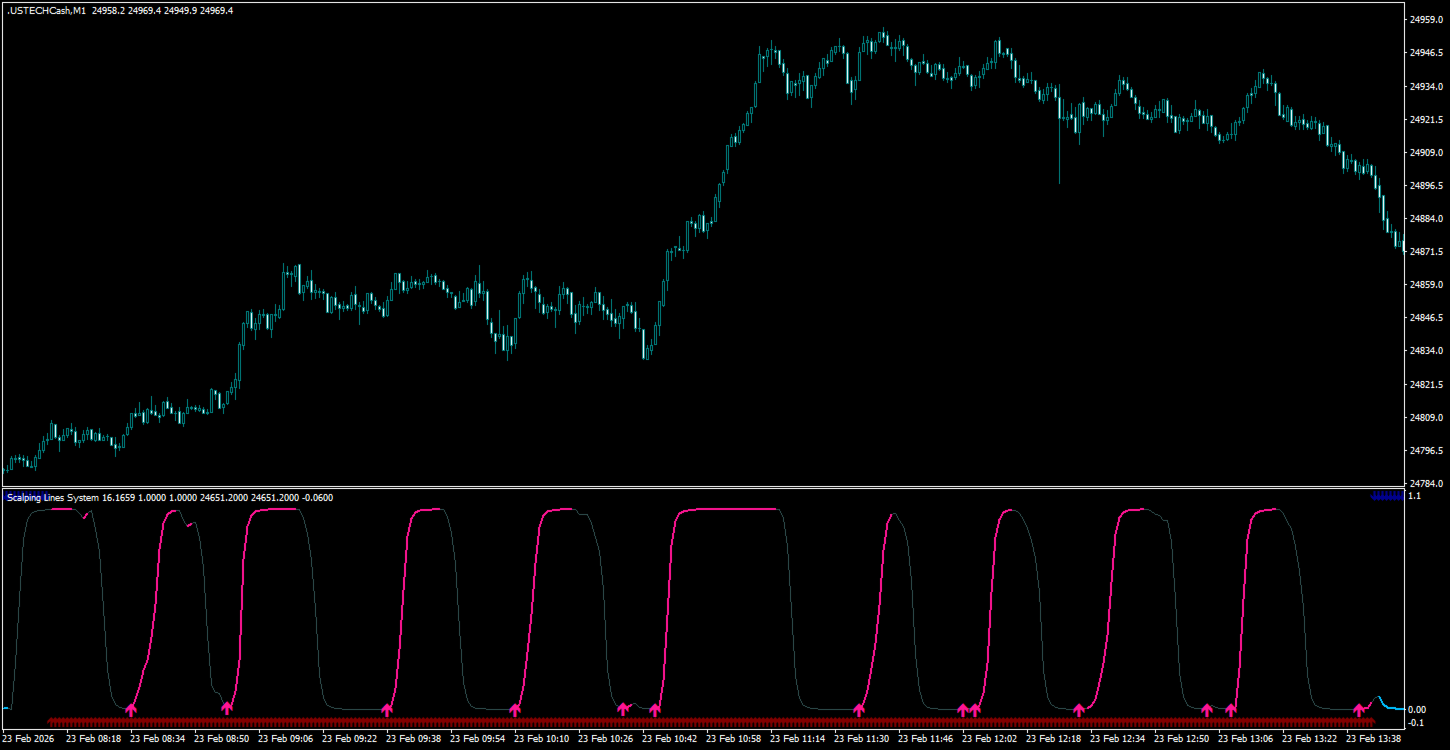
Scalping Lines System - 은 M1-H1 시간 프레임에서 금(XAUUSD) 자산을 거래하기 위해 특별히 설계된 스캘핑 트레이딩 시스템입니다.
추세, 변동성, 과매수/과매도 시장 분석 지표를 하나의 오실레이터로 통합하여 단기 신호를 식별합니다.
신호선의 주요 내부 매개변수는 사전 설정되어 있습니다.
"Trend Wave Duration"은 이동평균선 추세를 사용하여 추세 방향으로 일련의 신호 지속 시간을 조절하고, "Apply Smoothing to Signal Line"은 신호선 생성 방식을 조정하는 매개변수로, 수동으로 조정할 수 있습니다.
시가에서 신호선을 계산할 때는 차트가 다시 그려지지 않습니다. 다른 가격대에서는 신호 화살표가 깜빡일 수 있습니다.
신호는 캔들 마감 후에 나타나며, 다양한 알림 유형을 사용할 수 있습니다.
권장 시간 프레임: M1, M5, M15, M30, H1.
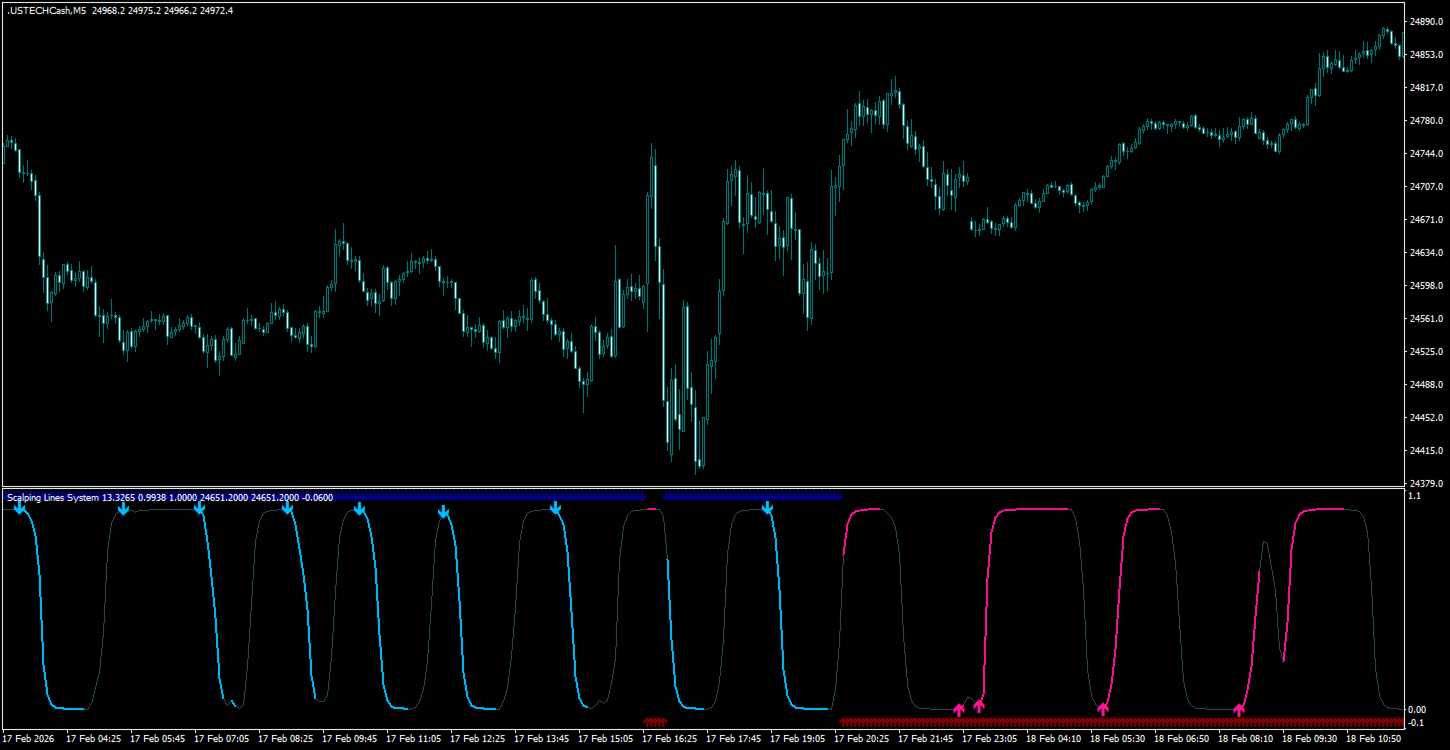
이 지표는 원래 금 거래를 위해 설계되었지만, 스프레드가 낮은 변동성이 큰 자산(BTC 및 암호화폐, 은, 나스닥 100 등의 주식 지수 CFD) 거래에도 적합합니다.
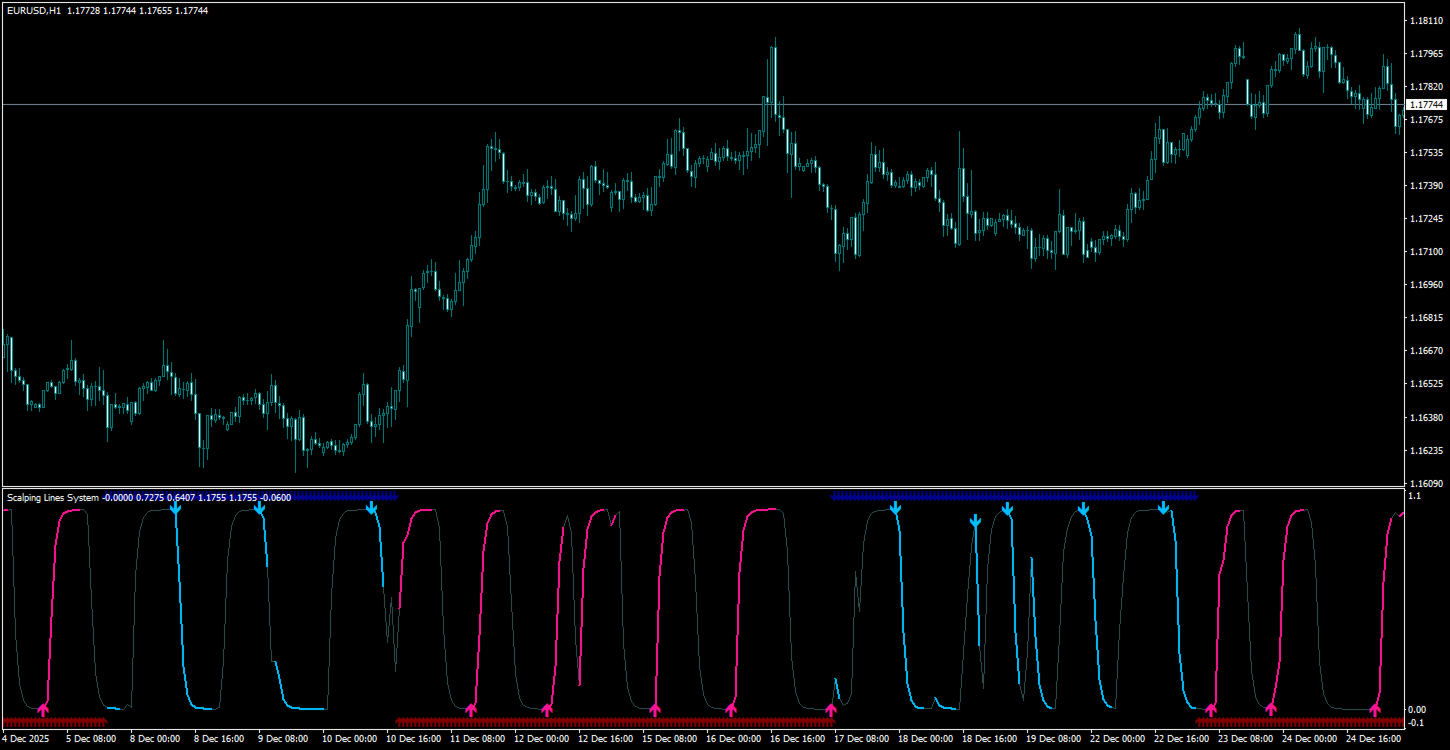
EURUSD, GBPUSD와 같은 일부 다른 거래 상품의 경우, 이 지표는 15분봉 이상의 시간 프레임에서 사용할 수 있습니다.
거래에 이 지표를 사용하는 방법:
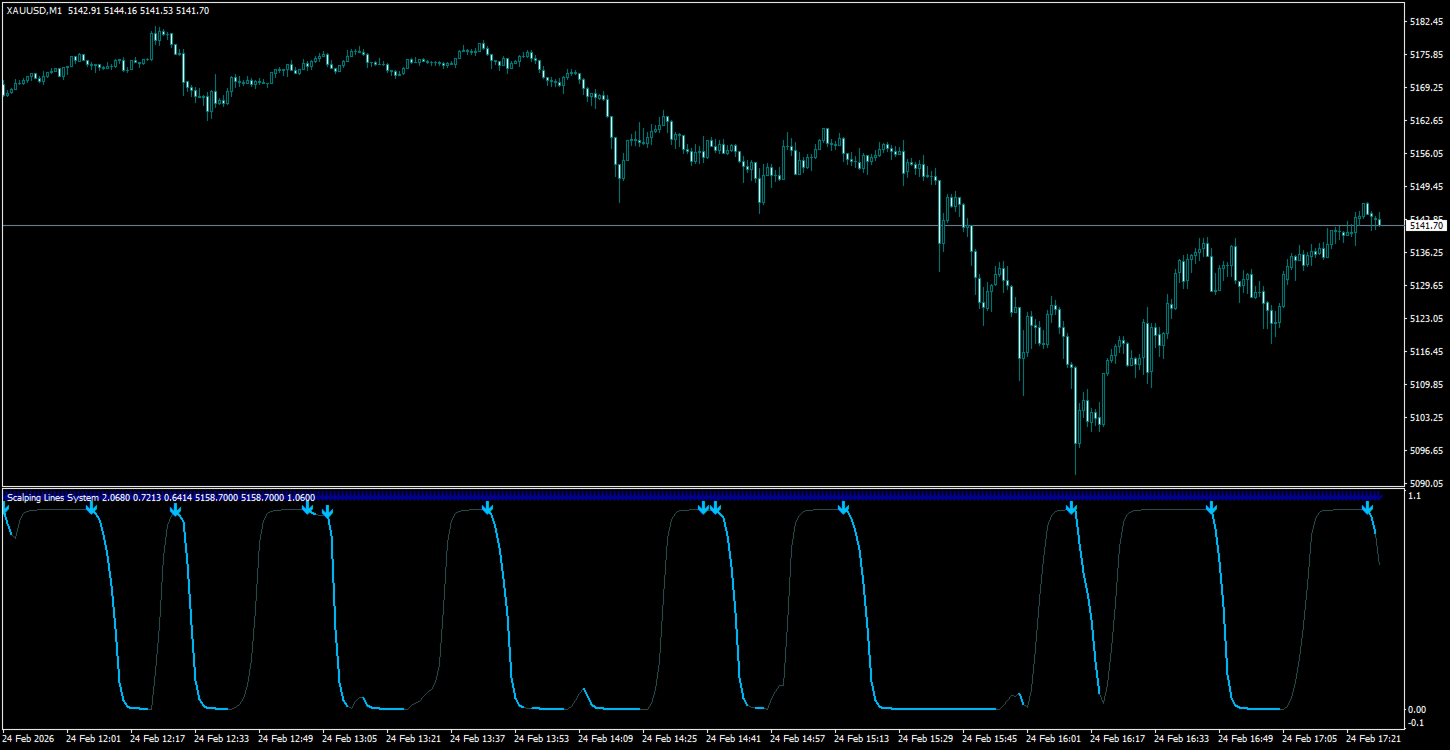
"매도" 신호의 경우:
파란색 하락 추세 화살표가 상단에 나타납니다.
오실레이터 상단에 파란색 화살표가 나타나고, 화살표 뒤의 파란색 선은 신호의 지지 기간을 나타냅니다. 이 선을 따라가세요.
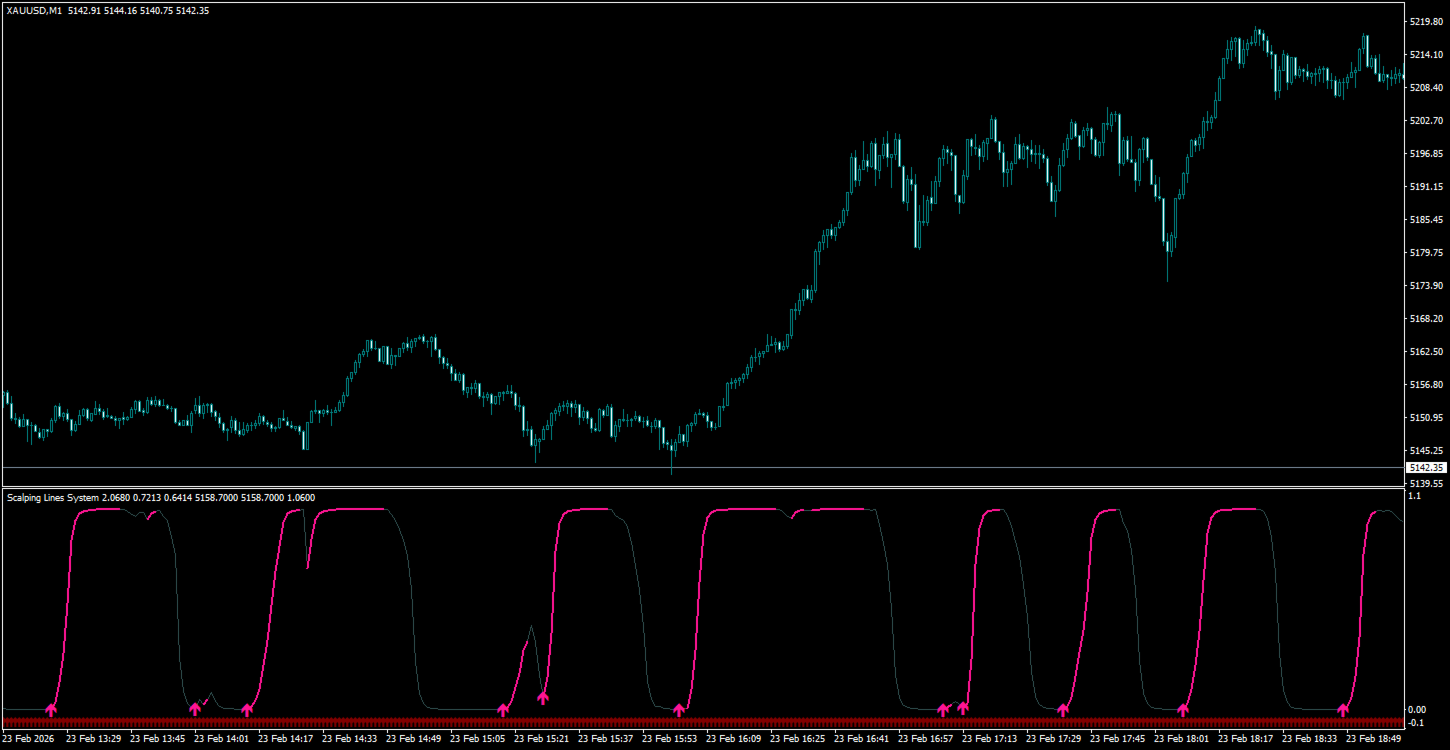
"매수" 신호의 경우:
빨간색 상승 추세 화살표가 하단에 나타납니다.
오실레이터 하단에 분홍색 화살표가 나타나고, 화살표 뒤의 분홍색 선은 신호의 지지 기간을 나타냅니다. 이 선을 따라가세요.
"내부 이동평균을 사용하여 추세 생성" 옵션을 비활성화하면 다른 추세 지표와 함께 신호선을 사용할 수 있습니다.
신호에 따라 가격이 움직이는 동안 몇 개의 캔들 동안 개방 포지션을 유지하십시오.
변동성이 낮은 상황에서는 이 지표를 사용하지 마십시오.
추세, 변동성, 과매수/과매도 시장 분석 지표를 하나의 오실레이터로 통합하여 단기 신호를 식별합니다.
신호선의 주요 내부 매개변수는 사전 설정되어 있습니다.
"Trend Wave Duration"은 이동평균선 추세를 사용하여 추세 방향으로 일련의 신호 지속 시간을 조절하고, "Apply Smoothing to Signal Line"은 신호선 생성 방식을 조정하는 매개변수로, 수동으로 조정할 수 있습니다.
시가에서 신호선을 계산할 때는 차트가 다시 그려지지 않습니다. 다른 가격대에서는 신호 화살표가 깜빡일 수 있습니다.
신호는 캔들 마감 후에 나타나며, 다양한 알림 유형을 사용할 수 있습니다.
권장 시간 프레임: M1, M5, M15, M30, H1.
이 지표는 원래 금 거래를 위해 설계되었지만, 스프레드가 낮은 변동성이 큰 자산(BTC 및 암호화폐, 은, 나스닥 100 등의 주식 지수 CFD) 거래에도 적합합니다.
EURUSD, GBPUSD와 같은 일부 다른 거래 상품의 경우, 이 지표는 15분봉 이상의 시간 프레임에서 사용할 수 있습니다.
거래에 이 지표를 사용하는 방법:
"매도" 신호의 경우:
파란색 하락 추세 화살표가 상단에 나타납니다.
오실레이터 상단에 파란색 화살표가 나타나고, 화살표 뒤의 파란색 선은 신호의 지지 기간을 나타냅니다. 이 선을 따라가세요.
"매수" 신호의 경우:
빨간색 상승 추세 화살표가 하단에 나타납니다.
오실레이터 하단에 분홍색 화살표가 나타나고, 화살표 뒤의 분홍색 선은 신호의 지지 기간을 나타냅니다. 이 선을 따라가세요.
"내부 이동평균을 사용하여 추세 생성" 옵션을 비활성화하면 다른 추세 지표와 함께 신호선을 사용할 수 있습니다.
신호에 따라 가격이 움직이는 동안 몇 개의 캔들 동안 개방 포지션을 유지하십시오.
변동성이 낮은 상황에서는 이 지표를 사용하지 마십시오.