FractalBreakoutLevels
- Indicators
- Version: 1.0

FractalBreakoutLevels
Overview:
This indicator plots dynamic price levels based on the analysis of price movements. It combines historical price data to identify key levels that can serve as references for trading.
How it works:
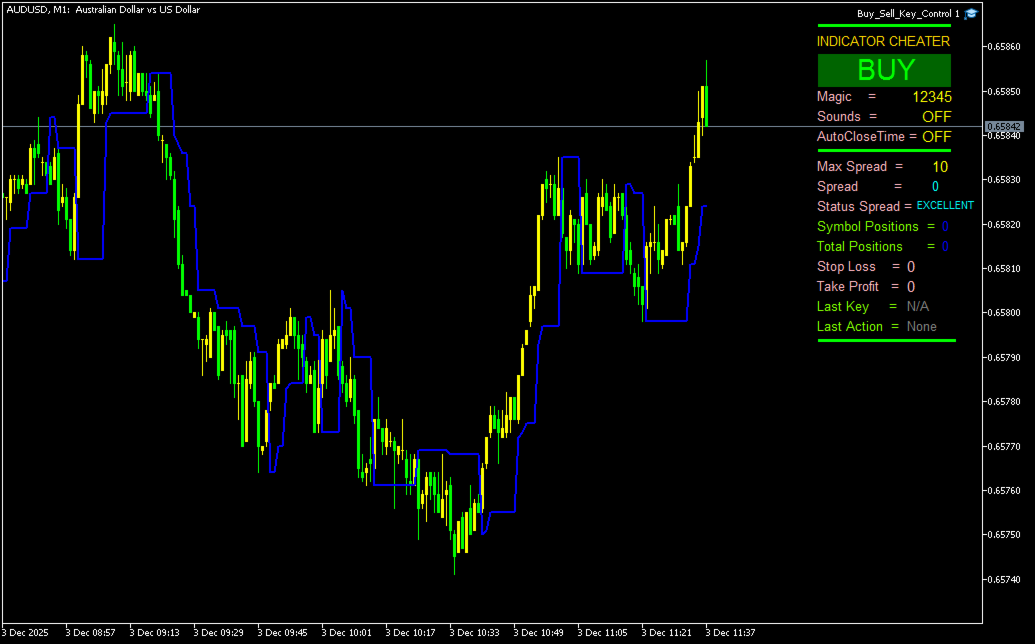
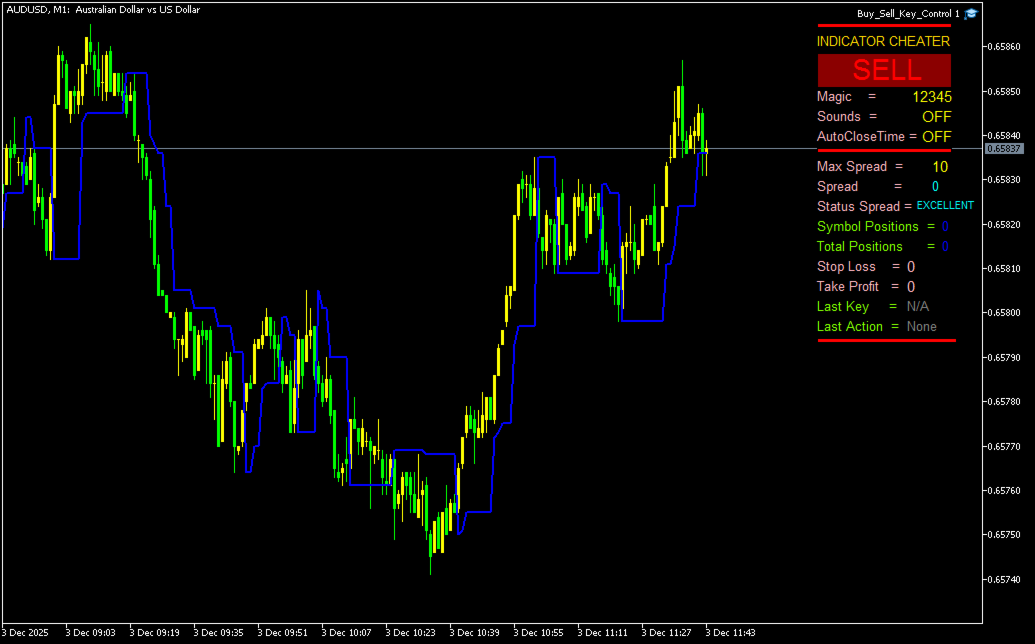
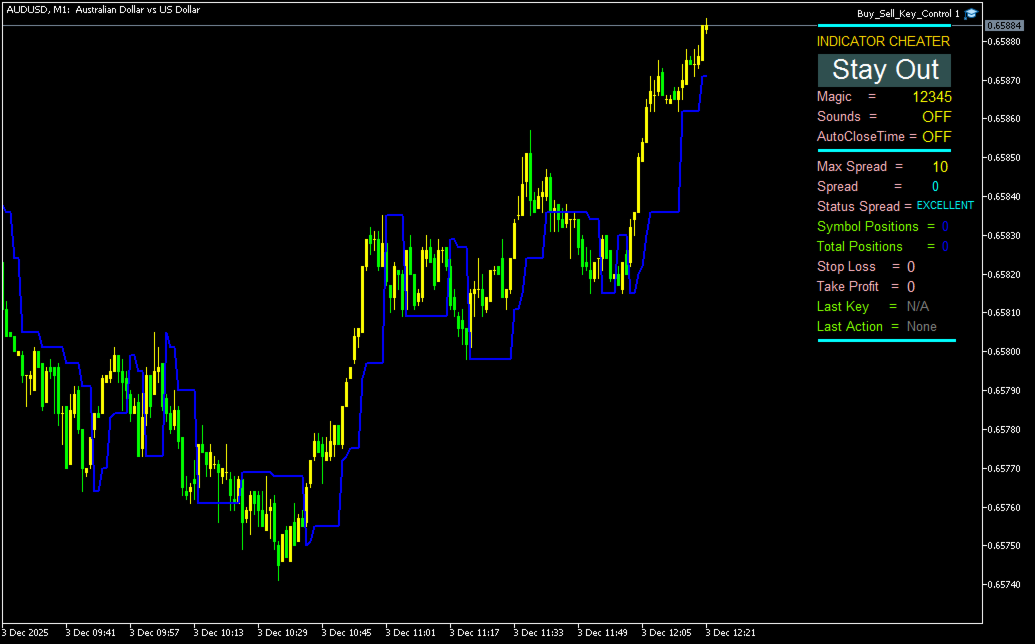
The indicator analyzes market structure by examining the relationship between current and historical price data. It draws a continuous line that adapts to changing market conditions, serving as a dynamic support/resistance level.
Level formation principle:
-
The indicator uses a combination of analysis across several consecutive bars
-
Levels are formed under specific price relationships
-
In the absence of clear signals, the indicator retains the previous value, creating a continuous line
Technical specifications:
-
Works directly on the price chart
-
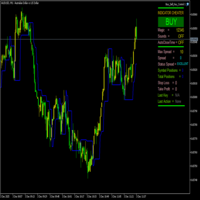
Plots one continuous level (blue line)
-
Has no external settings, operates on standard price data
-
Does not redraw historical values
Application:
The indicator can be used for:
-
Identifying potential support/resistance levels
-
Detecting possible trend reversal points
-
Setting stop-loss levels relative to the plotted level
-
Confirming breakouts and trend continuations
Features:
-
Works on all timeframes
-
Can be used as a standalone tool or in combination with other indicators
-
Provides visual clarity of market structure
Note:
Testing on various instruments and timeframes is recommended for best results. The indicator is an analytical tool and should be used as part of a comprehensive trading strategy.