MA Color Candles
- Indicators
- Vladimir Kuzmin
- Version: 2.0
- Updated: 10 May 2025
MA Color Candles
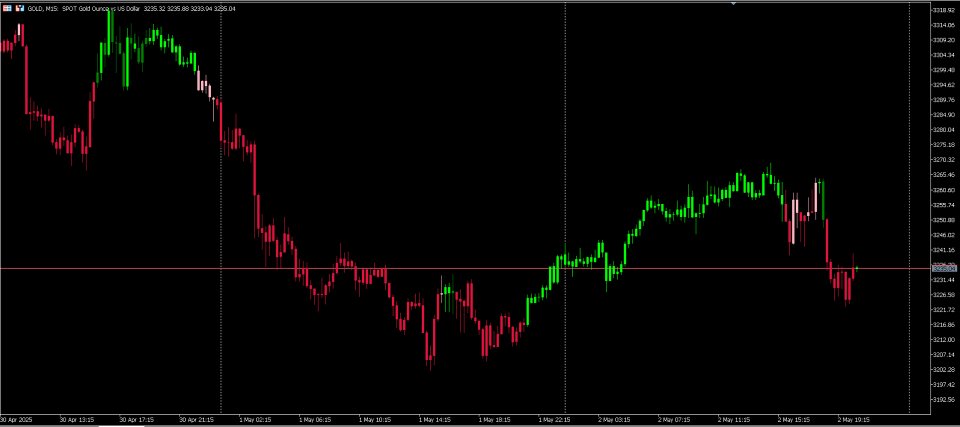
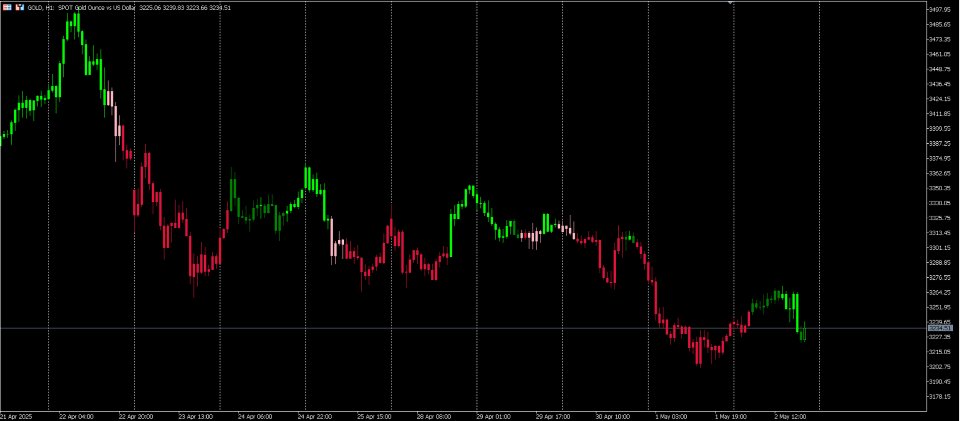
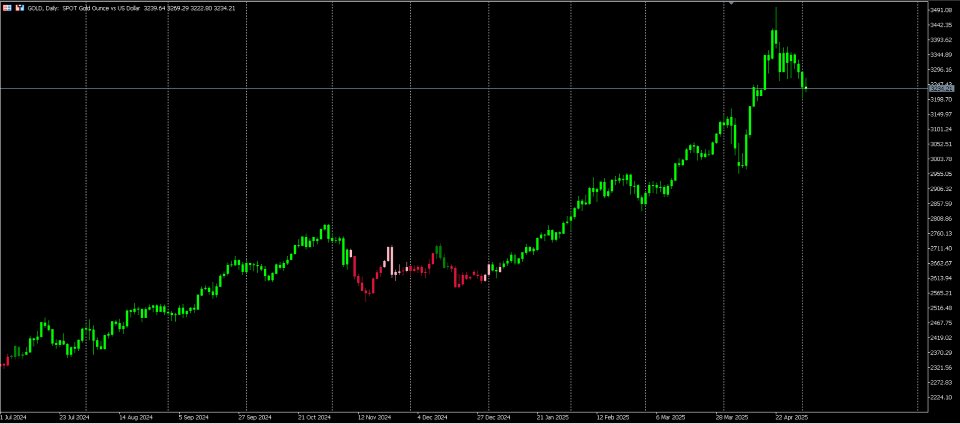
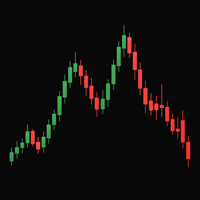
MA Color Candles is a technical indicator designed to visually display market trend direction by coloring actual chart candles. It does not draw additional objects — instead, it colors the standard candles directly based on the interaction between two moving averages.
This approach makes chart reading simpler and cleaner, especially when visually evaluating the trend. The indicator is ideal for traders who prefer uncluttered charts and clear visual cues.
How it works
- Bullish trend (green candles): fast MA is above slow MA and slow MA is rising.
- Bearish trend (red candles): fast MA is below slow MA and slow MA is falling.
- Neutral: candles remain uncolored in all other cases.
Features
- Colors real chart candles
- Supports SMA, EMA, SMMA, LWMA
- Fully customizable MA periods and price type
- Minimal chart load
- Trend visualization made simple
Input Parameters
- Fast MA period
- Slow MA period
- Smoothing method
- Applied price (Close, Open, etc.)
- Bullish and bearish candle colors
Recommendations
- Best used on M15–H4 timeframes
- Effective on trending instruments
- Combine with other tools or oscillators
Disclaimer
This indicator is not a trading signal provider and does not guarantee profitability. It is intended solely for visual market analysis. Please backtest before using on a live account.
