ZUP Indicator MT4
- Indicators
- Eda Kaya
- Version: 2.2
ZUP Indicator (ZUP) for MetaTrader 4
The ZUP Indicator (ZUP) is a technical tool within MetaTrader 4 designed to recognize harmonic formations by analyzing price swings and applying Fibonacci measurements. It traces each leg of the price movement and plots corresponding Fibonacci ratios.
With visual lines and labeled pivot points, this indicator allows traders to pinpoint harmonic structures and interpret wave dynamics effectively.
«Indicator Installation & User Guide»
MT4 Indicator Installation | ZUP Indicator MT5| ALL Products By TradingFinderLab | Best MT4 Indicator: Refined Order Block Indicator for MT4 | Best MT4 Utility: Trade Assistant Expert TF MT4 | TP & SL Tool: Risk Reward Ratio Calculator RRR MT4 | Prop Firm Protector: Prop Draw Down Protector Expert Advisor MT4 | Money Management: Easy Trade Manager MT4
ZUP Indicator Table
Below is a summary of the main attributes associated with the ZUP Indicator:
| Category | Harmonic Patterns – Classic & Chart Structures – Price Action |
| Platform | MetaTrader 4 |
| Skill Level | Intermediate |
| Indicator Type | Reversal – Leading – Non-Redrawing |
| Timeframe | Multi-Timeframe |
| Trading Style | Scalping – Day Trading – Intraday Trading |
| Trading Markets | Forex – Stocks – Indices |
Overview of the Indicator
The ZUP Indicator (ZUP) assists traders in comparing price legs by measuring their proportional relationships. By computing Fibonacci levels across legs, it facilitates the recognition of advanced harmonic formations like the Gartley, Butterfly, and AB=CD structures.
These tools provide technical traders with visual cues for forecasting potential turning points.
Example of a Bullish Harmonic Setup
In a 30-minute timeframe of the gold market, the indicator has mapped out harmonic symmetry. After detecting the AB segment and analyzing the BC retracement, the system has confirmed an AB=CD structure. Upon completion, this setup signaled a long opportunity, which resulted in a significant upward move.
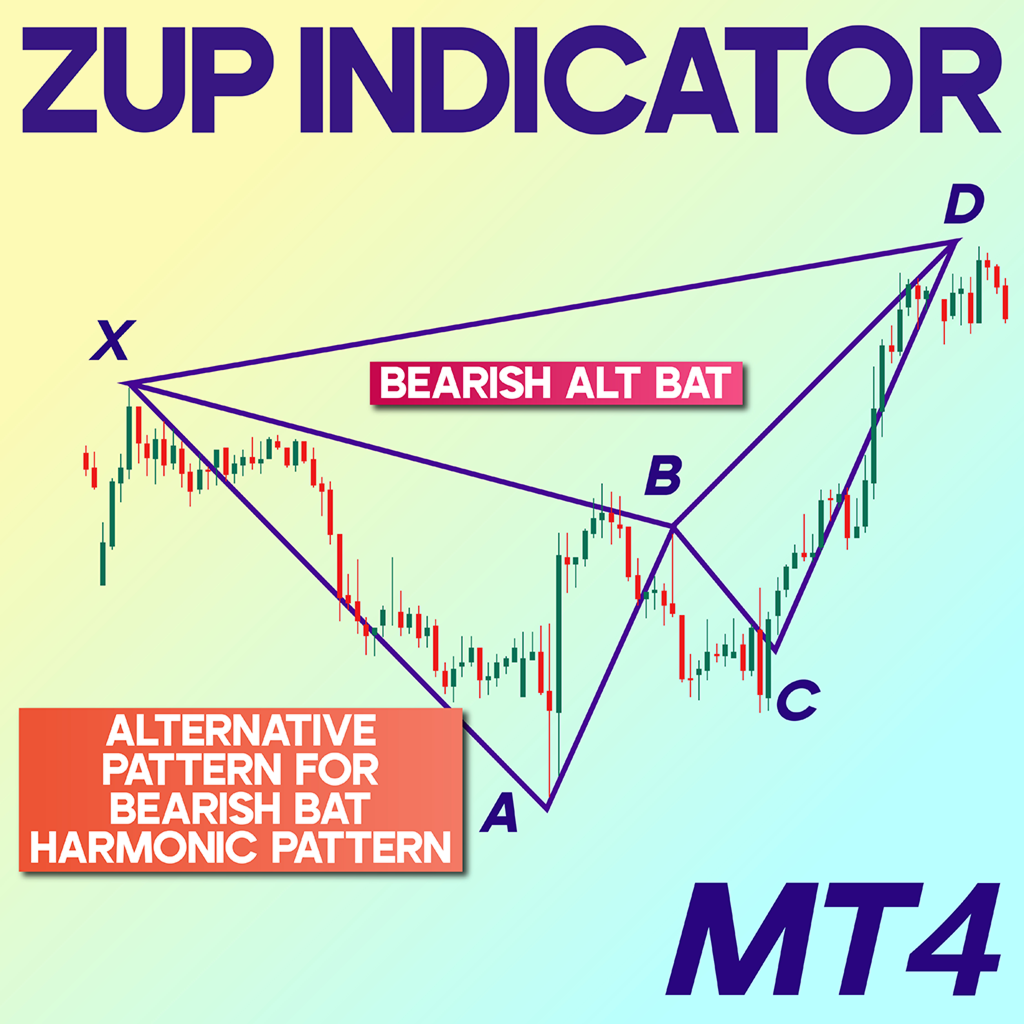
Example of a Bearish Harmonic Setup
Within the 1-hour NZD/USD chart, the ZUP Indicator has marked out specific legs and applied Fibonacci analysis to visualize pattern development. In this example, a Bearish Bat Formation was detected. Upon its final leg's completion, the price reversed into a downward trajectory.
ZUP Indicator Settings
The following configurations are available within the indicator:
- min Bars: Specifies the minimum number of candles required to validate a wave.
- min Size: Defines the criteria for connecting Highs and Lows to outline a formation.
- ExtMaxBar: Determines how many candles the indicator scans.
- Ext Size Txt: Adjusts the size of the numerical labels.
- Ext ZigZagColor: Sets the hue of the zigzag pattern lines.
- ExtLine: Modifies the appearance of text elements.
- ExtLine886: Customizes the color of harmonic leg lines.
Conclusion
The ZUP Indicator (ZUP) for MetaTrader 4 remains a reliable solution for identifying harmonic structures using Fibonacci-based wave analysis. It helps traders visualize complex chart patterns and anticipate market reversals with higher accuracy. Whether trading the Bat, Gartley, or AB=CD, this indicator offers precision and clarity for those who rely on pattern-based strategies.