Dashboard Multi Currency MTF Stochastic
- 지표
-
Anon Candra N
 I am a professional trader who has been in the stock market for several years. After making in-depth observations of the stock market, I developed the trading tools that have helped my trading career so far. The good news is, you can have these trading tools on this website.
 - 버전: 1.50
- 업데이트됨: 6 2월 2025
- 활성화: 20
15 years old, 15 years old, 15 years old.
2024 years ago:
➡️ What to do next.
I want to know what I want to know.
Sorry, I don't know what to do.
I want to know, I want to know, I want to know.
I want to know what I want to know.
I want to know what I want to know.
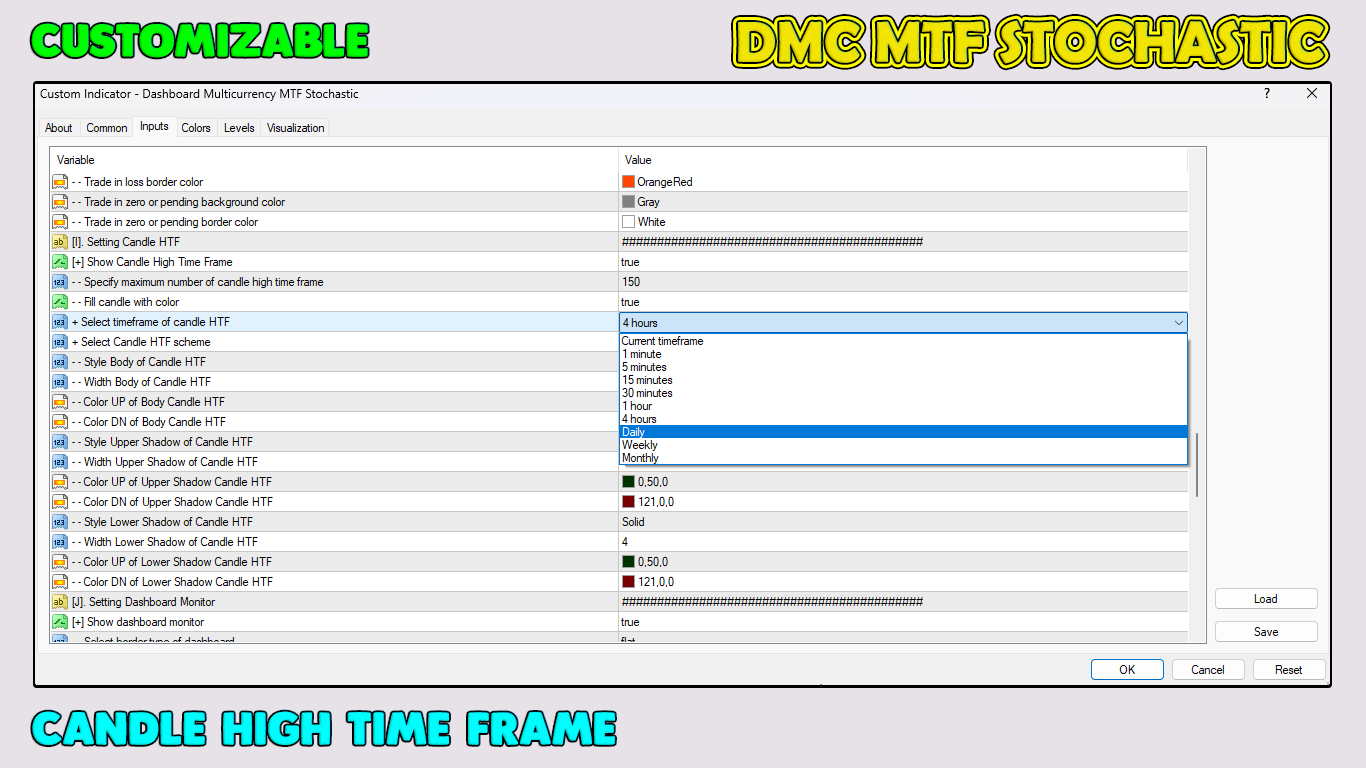
H4(단지 M1에서 M30) I'm here. I'm here.
I want to know what I want to know.
I want to know what I'm saying.
I want to know what I want to know.
I want to know what I want to know.
I want to know what I want to know.
I want to know what I'm talking about ).
I want to see you, I want to know you, (In Japanese).
M1 MN1 MN1 MN1 MN1 MN1
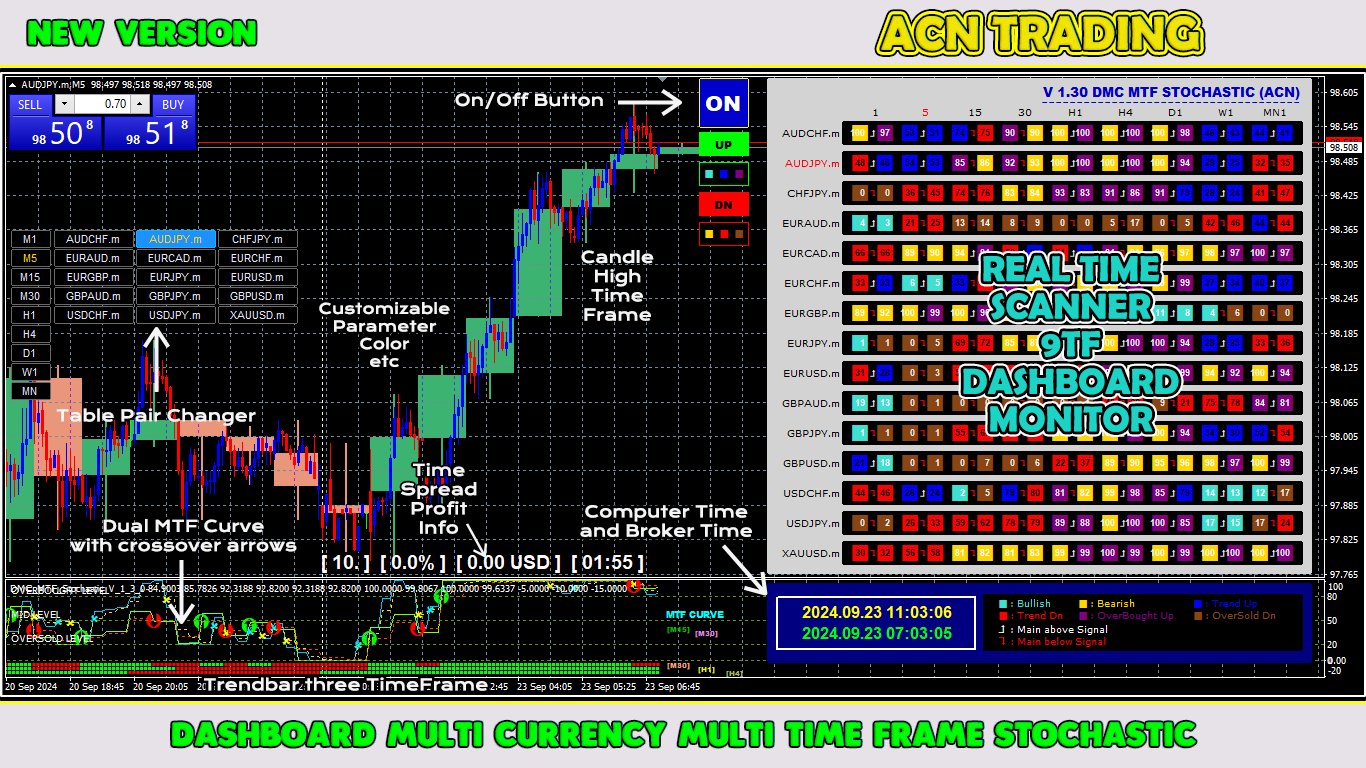
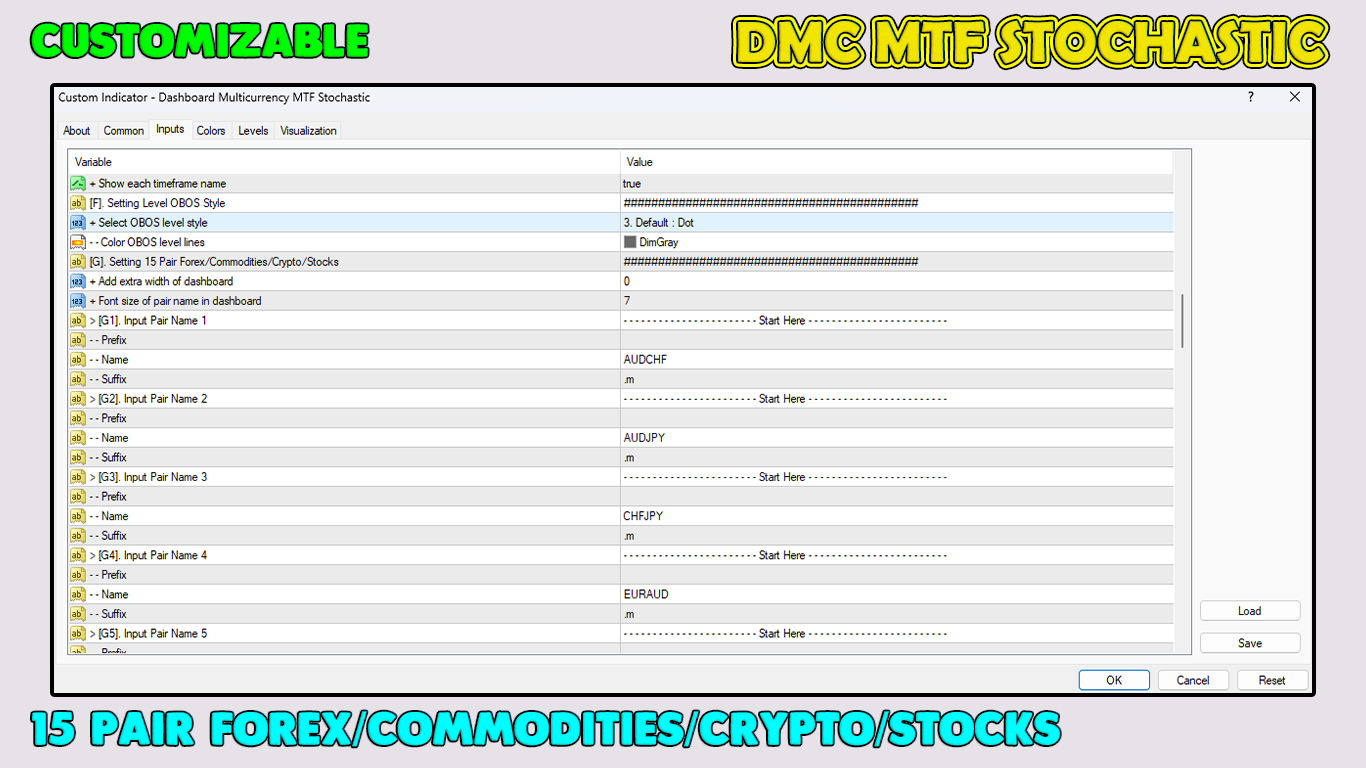
15개 통화쌍(다중통화 외환/상품/암호화폐/주식)
It's a good idea
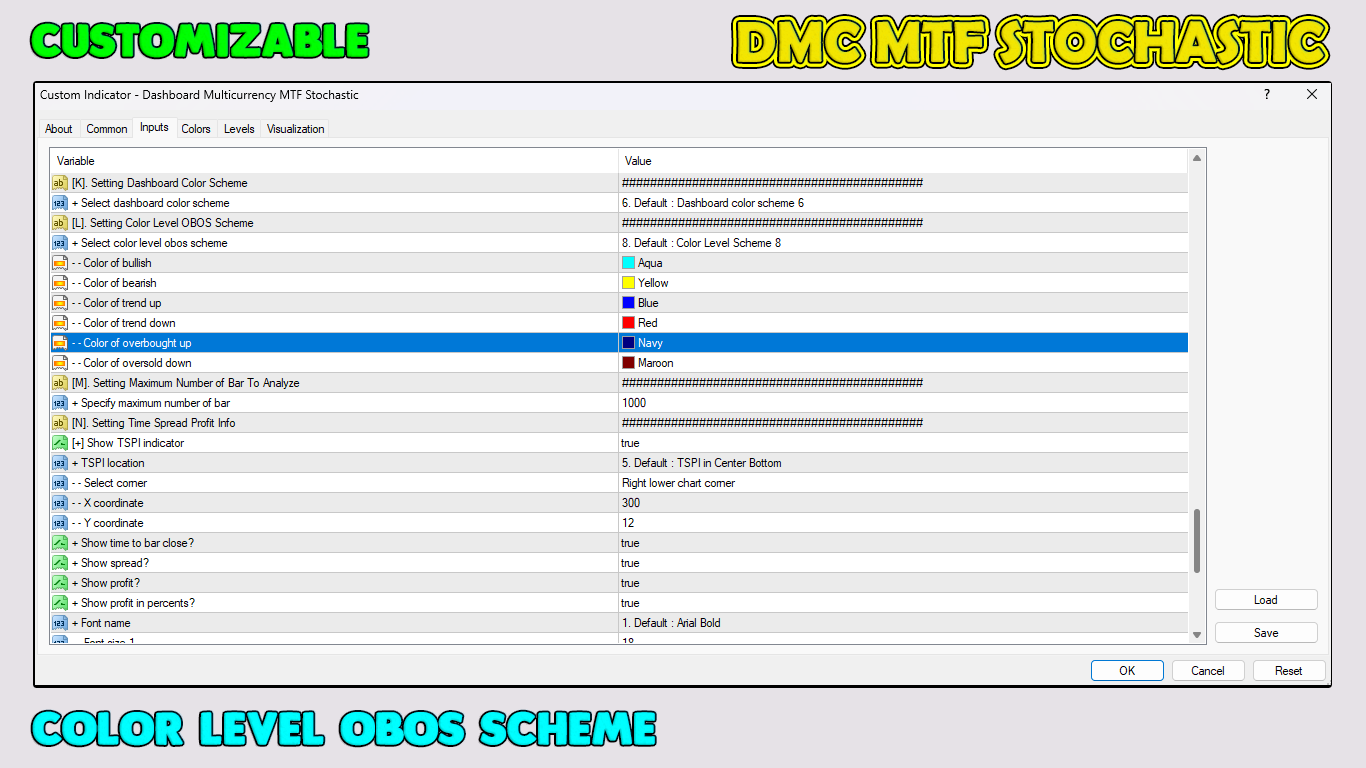
OBOS OBOS
20 years old 20 years old
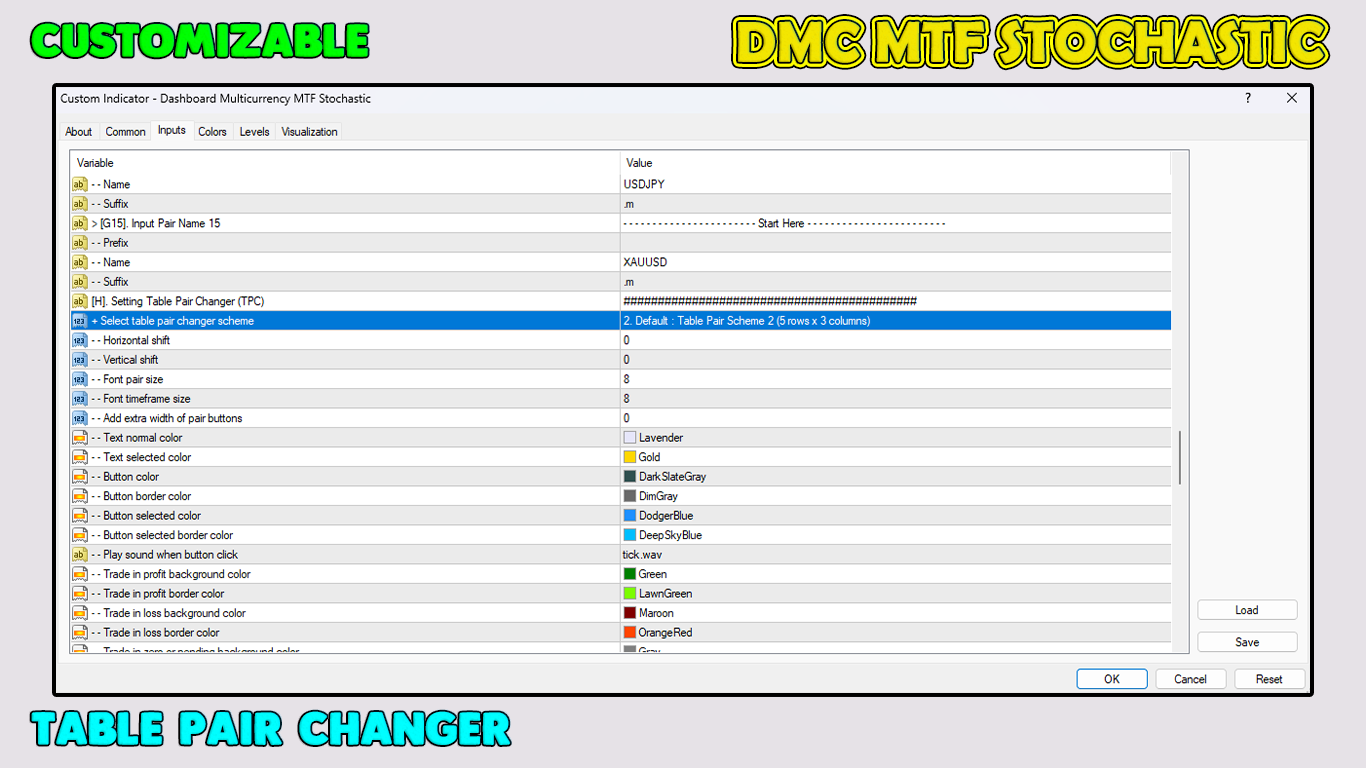
온/오프 통화쌍 교환기 장착
I want to know what I want to say
I want to know what I want to say
I want to know what I want to know.
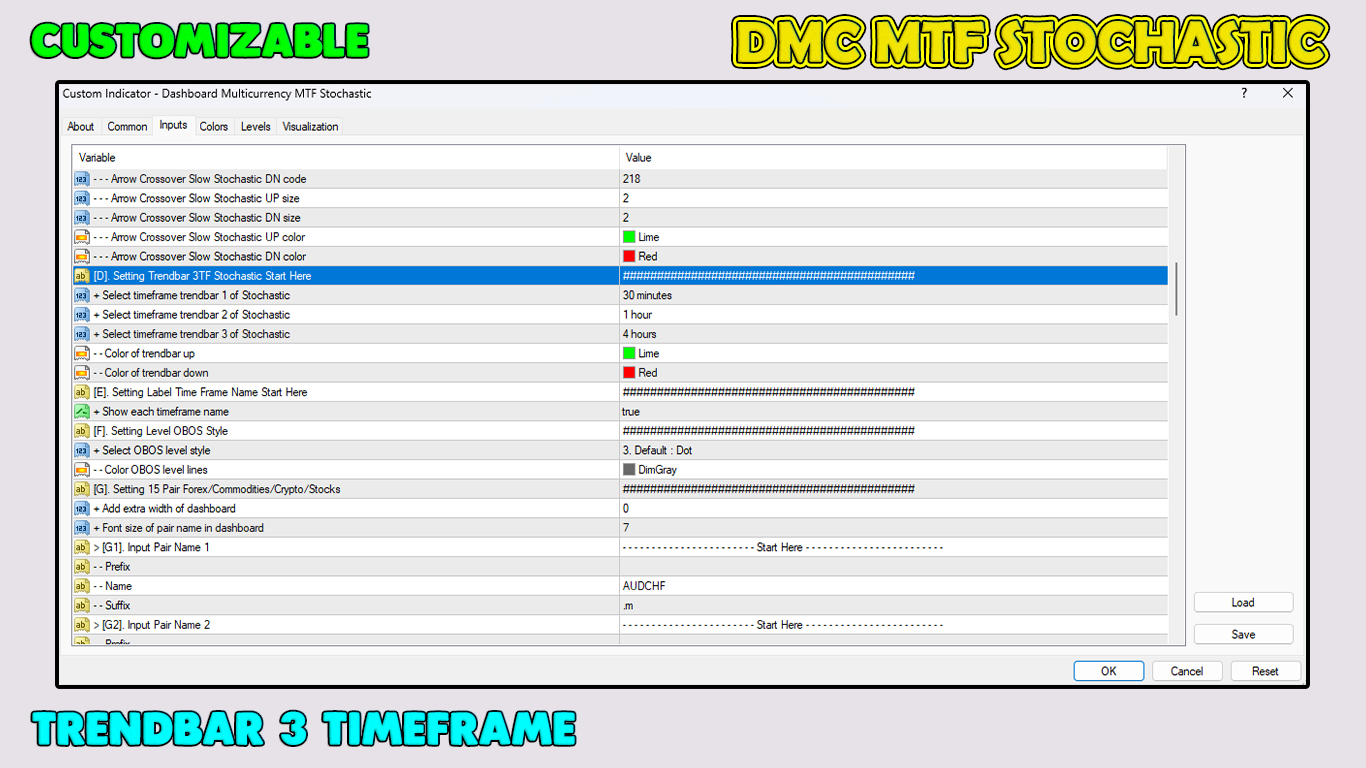
MTF
MTF
3TF
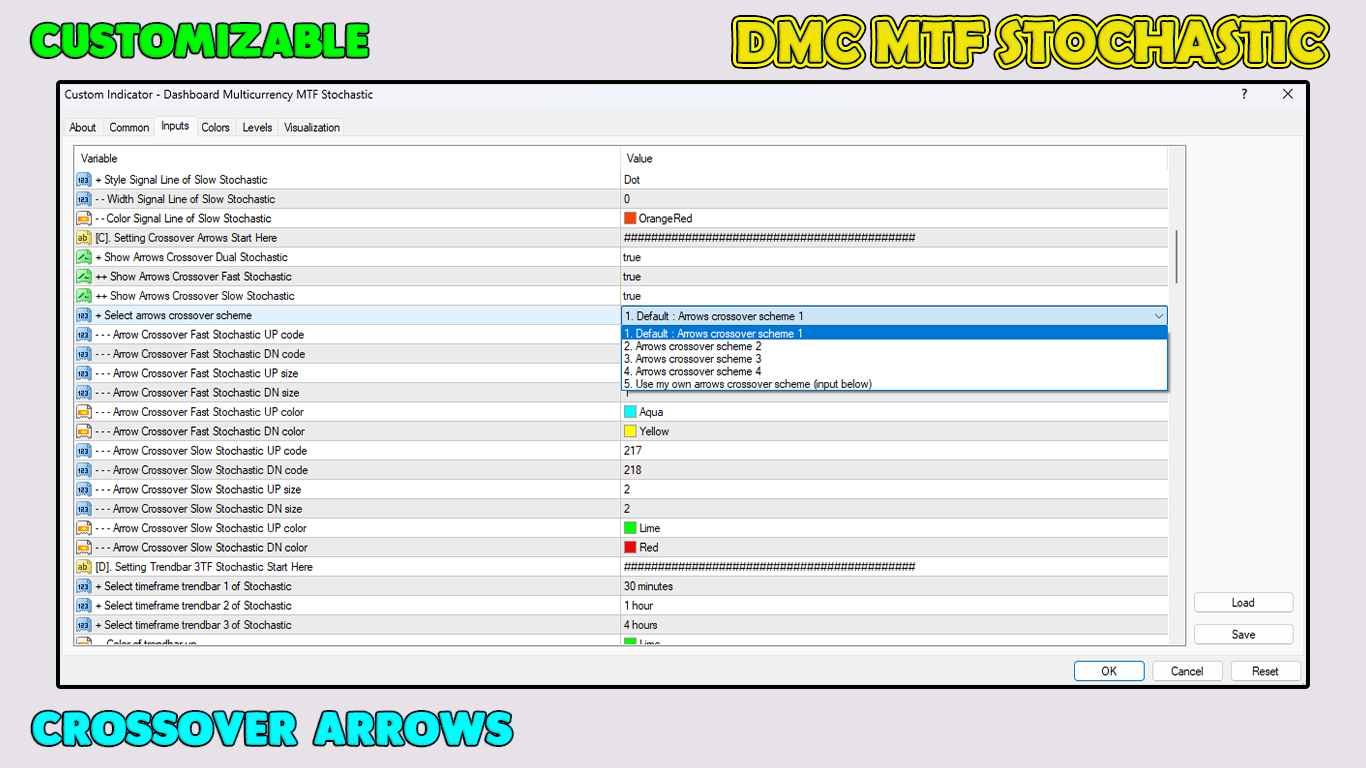
I want to know what I want to know.
I'm here. I'm here.
I can't wait! I can't wait!
It's okay.