Dashboard Multi Currency MTF Stochastic
- Göstergeler
- Sürüm: 1.50
- Güncellendi: 6 Şubat 2025
- Etkinleştirmeler: 20

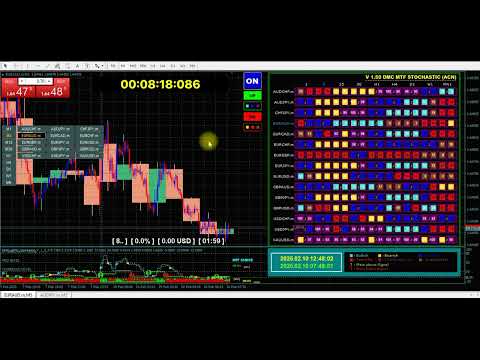
Bu işlem aracıyla aynı anda 15 piyasayı tarayabilirsiniz.
Karşınızda yeni ticaret göstergesi 2024:
➡️ Kontrol Paneli Çoklu Para Birimi Çoklu Zaman Çerçevesi Stokastik.
Bu ticaret aracını oluşturmamın en az iki nedeni var:
Öncelikle tek piyasayı gözlemlemekten sıkıldım.
İkincisi, başka bir pazara giriş anını kaybetmek istemiyorum.
Bu yüzden aynı zamanda diğer piyasa koşullarını da bilmek istiyorum.
Bu nedenle birden fazla piyasanın koşullarını aynı anda tarayabilecek bir tarayıcıya ihtiyacım var.
Stokastik ana çizginin> (veya <=) stokastik sinyal çizgisinin M1'den H4'e (veya yalnızca M1'den M30'a) başladığı pazarları sıklıkla ararım.
Analizime katılıyorsanız, aradığınız ticaret göstergesi budur.
Piyasa koşullarının yukarıdaki gereksinimleri karşıladığı anı kaçırmayın.
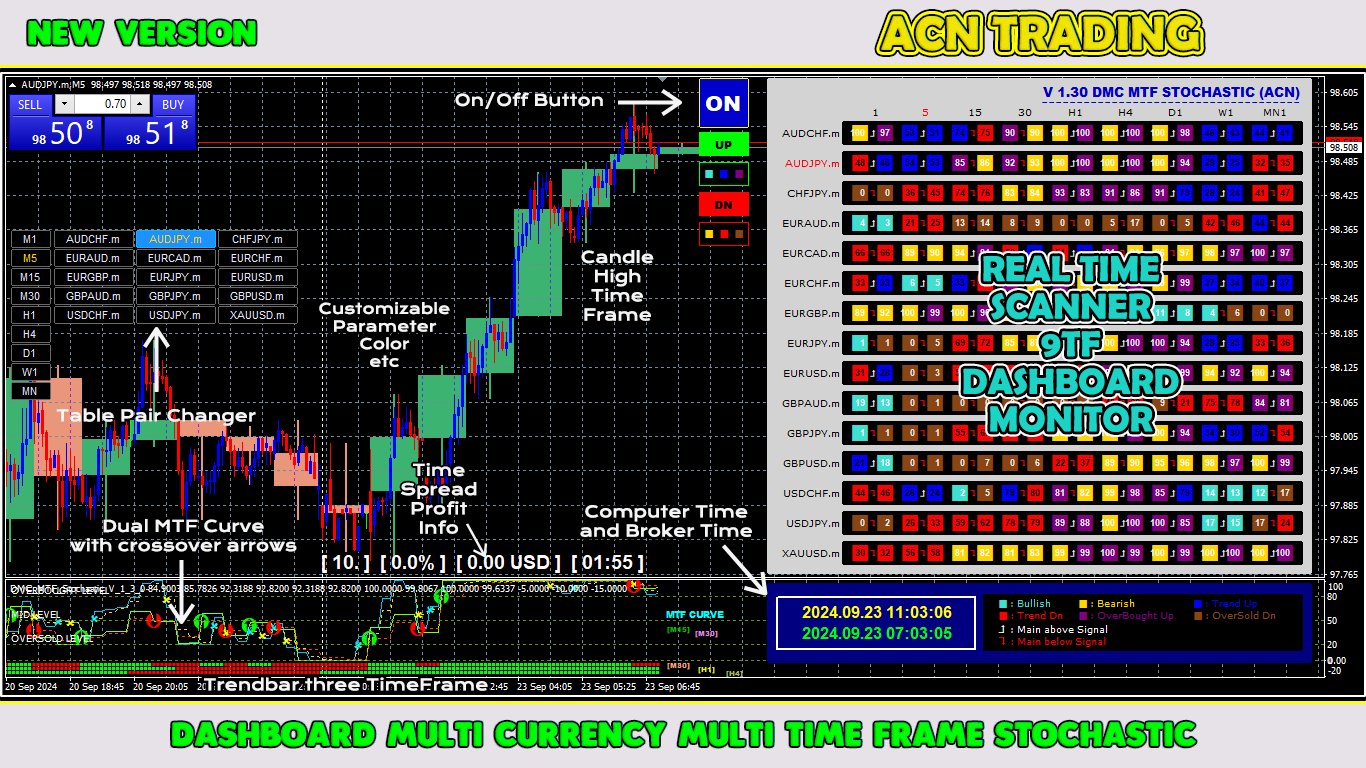
Bu, birçok harika özelliğe sahip bir stokastik tarayıcı veya kontrol panelidir:
Stokastik ana hattın verilerini gösterebilir
Stokastik sinyal hattının verilerini gösterebilir
Stokastik ana hat ve sinyal hattının konumunu gösterebilir (ana hat sinyal hattının üstünde veya ana hat sinyal hattının altında)
Hem stokastik ana hattın hem de sinyal hattının veri seviyesini gösterebilir (yükseliş, düşüş eğilimi, yükseliş eğilimi, düşüş eğilimi, aşırı alım ancak hala yukarı ve aşırı satış ancak hala düşüş)
M1'den MN1'e kadar gerçek zamanlı verileri gösterebilir
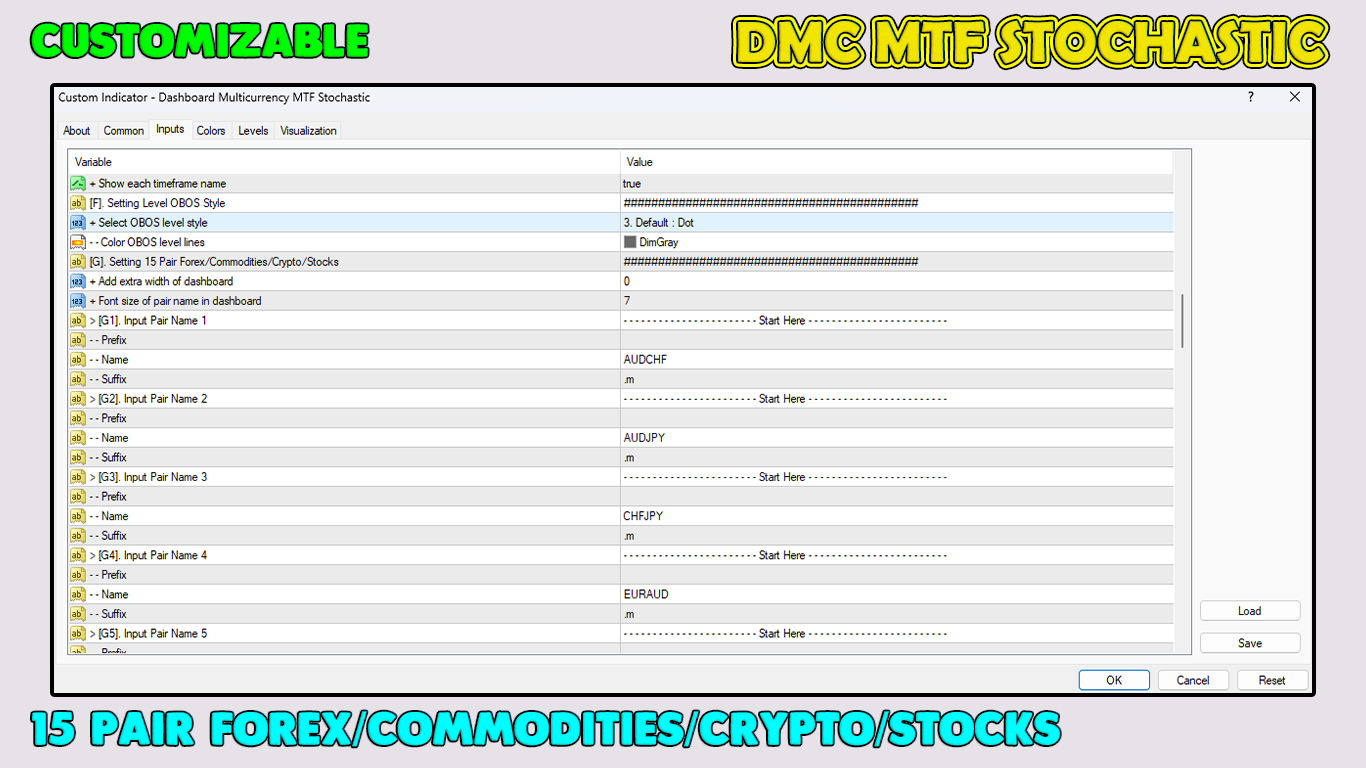
15 döviz çiftinin verilerini gösterebilir (çoklu para birimi forex/emtialar/kripto/hisse senetleri)
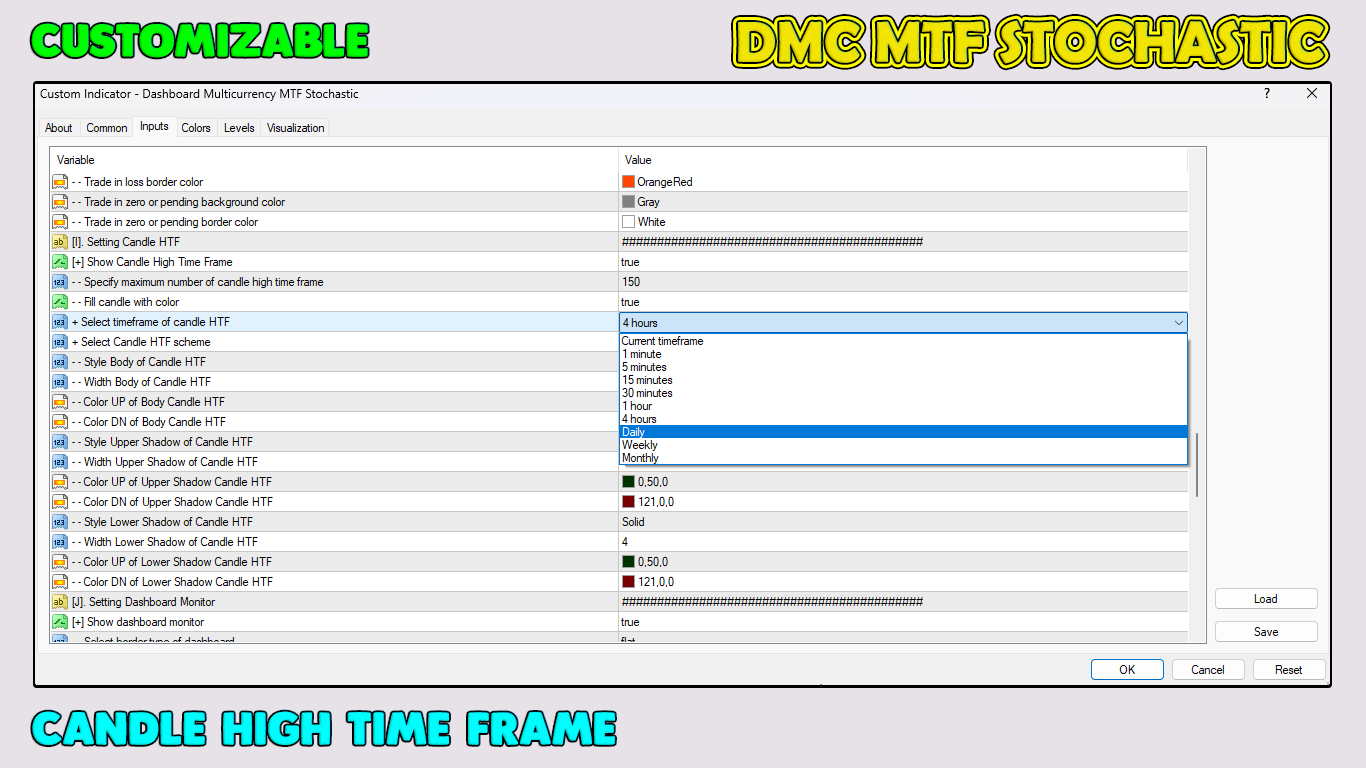
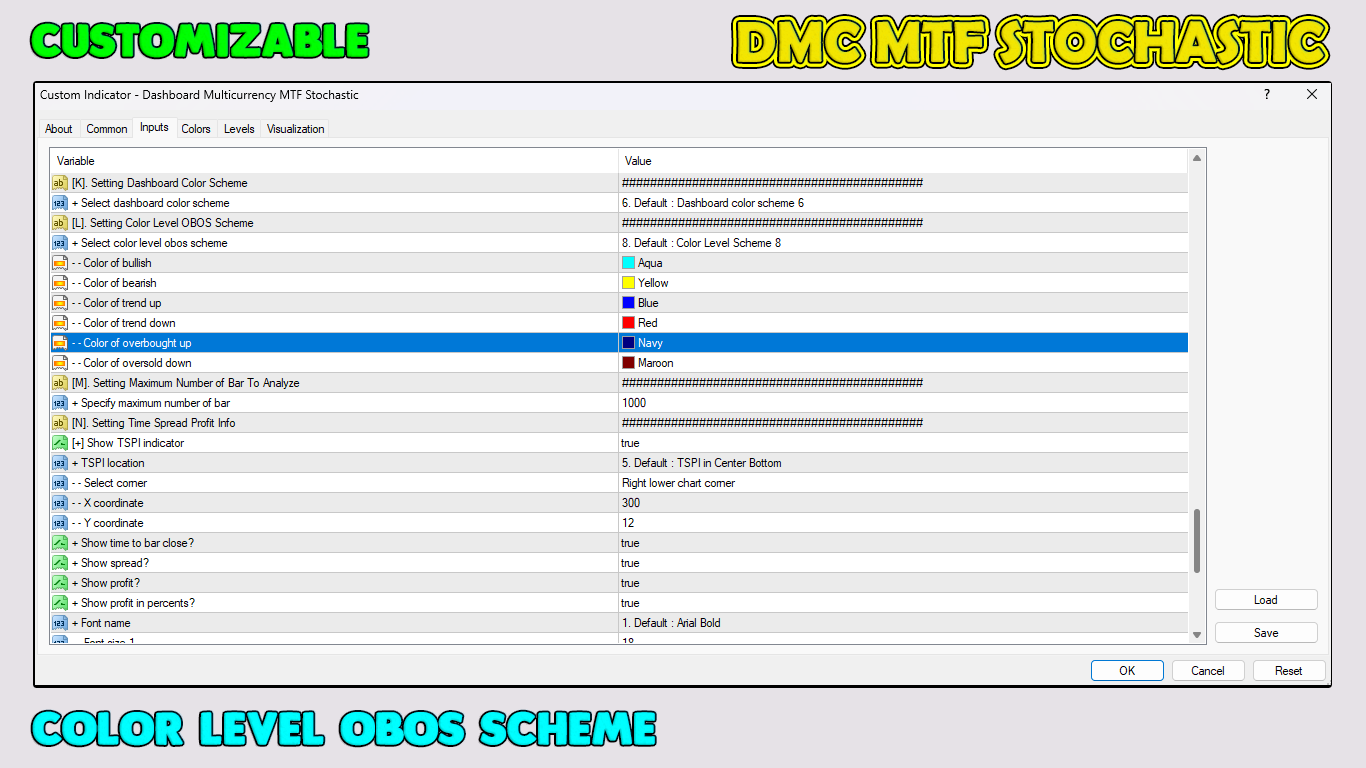
Özelleştirilebilir parametre
Özelleştirilebilir renkli OBOS seviyesi
Güzel 20 gösterge paneli renk şeması
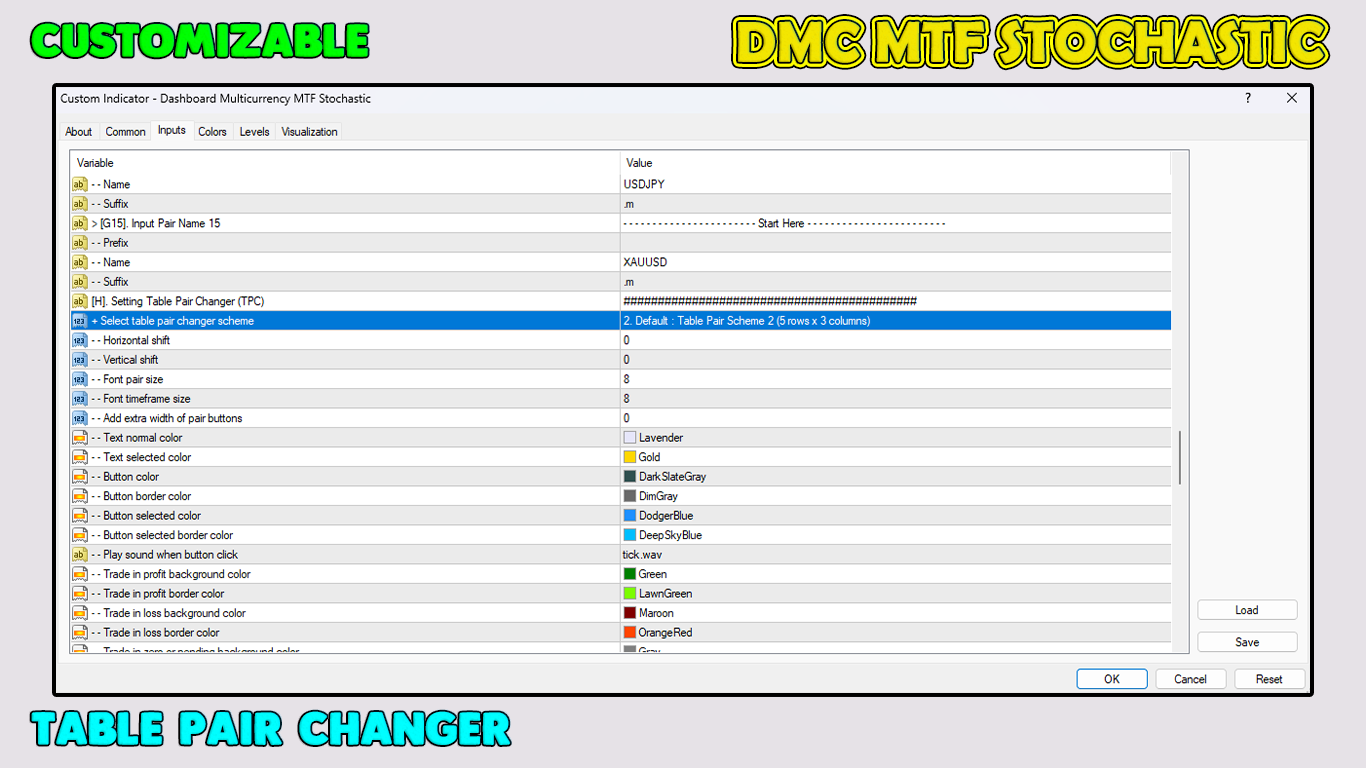
Açık/kapalı döviz çifti değiştiriciyle donatılmıştır
Mum yüksek zaman dilimi ile donatılmıştır
Zamana yayılmış kar bilgisi ile donatılmıştır
Geçerli yerel bilgisayar saati ve komisyoncu saati ile donatılmıştır
Çift MTF stokastik eğrisi ile donatılmıştır
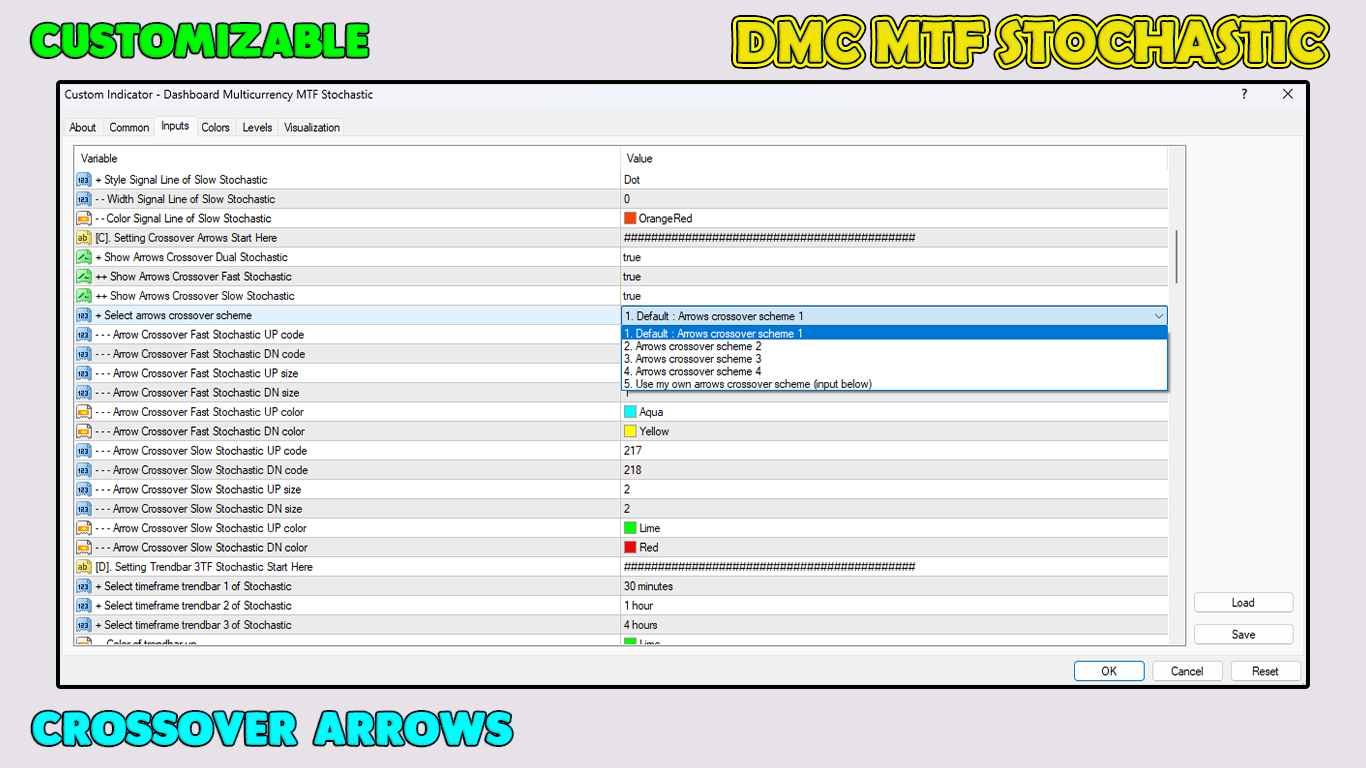
Çift MTF stokastik eğrisinin çapraz oklarıyla donatılmıştır
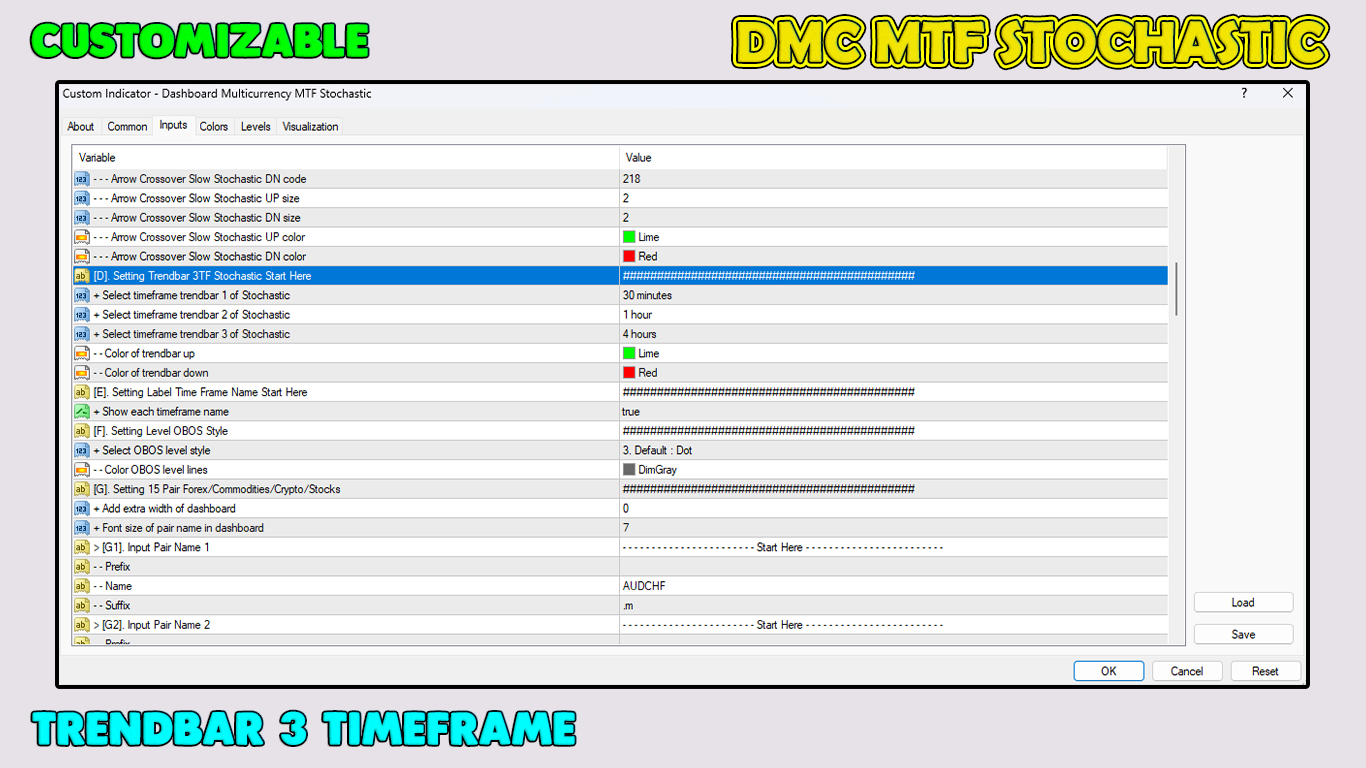
Trend çubuğu 3TF stokastik ile donatılmıştır
Bu ticaret aracı kesinlikle her yatırımcının ihtiyaç duyduğu şeydir.
Bugün indirin.
Kendinden emin girişler yapın ve bir profesyonel gibi ticaret yapın!
Teşekkür ederim.