Dashboard Multi Currency MTF Stochastic
- 指标
- 版本: 1.50
- 更新: 6 二月 2025
- 激活: 20

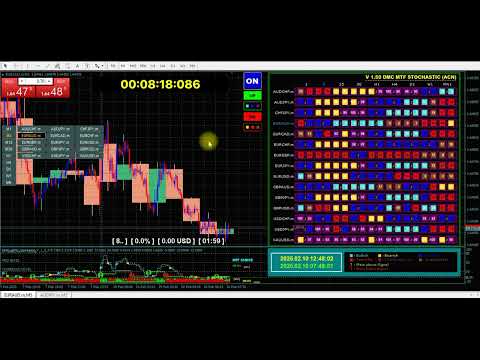
使用此交易工具,您可以同时扫描 15 个市场。
介绍新的交易指标 2024:
➡️ 仪表板多货币多时间框架随机。
我创建这个交易工具至少有两个原因:
首先,我厌倦了只观察一个市场。
其次,我不想失去进入另一个市场的时机。
这就是为什么我想同时了解其他市场状况。
因此,我需要一台可以同时扫描多个市场状况的扫描仪。
我经常寻找随机主线>(或<=)随机信号线从M1到H4(或只是M1到M30)的市场。
如果您同意我的分析,那么这就是您一直在寻找的交易指标。
不要错过市场状况满足上述要求的时刻。
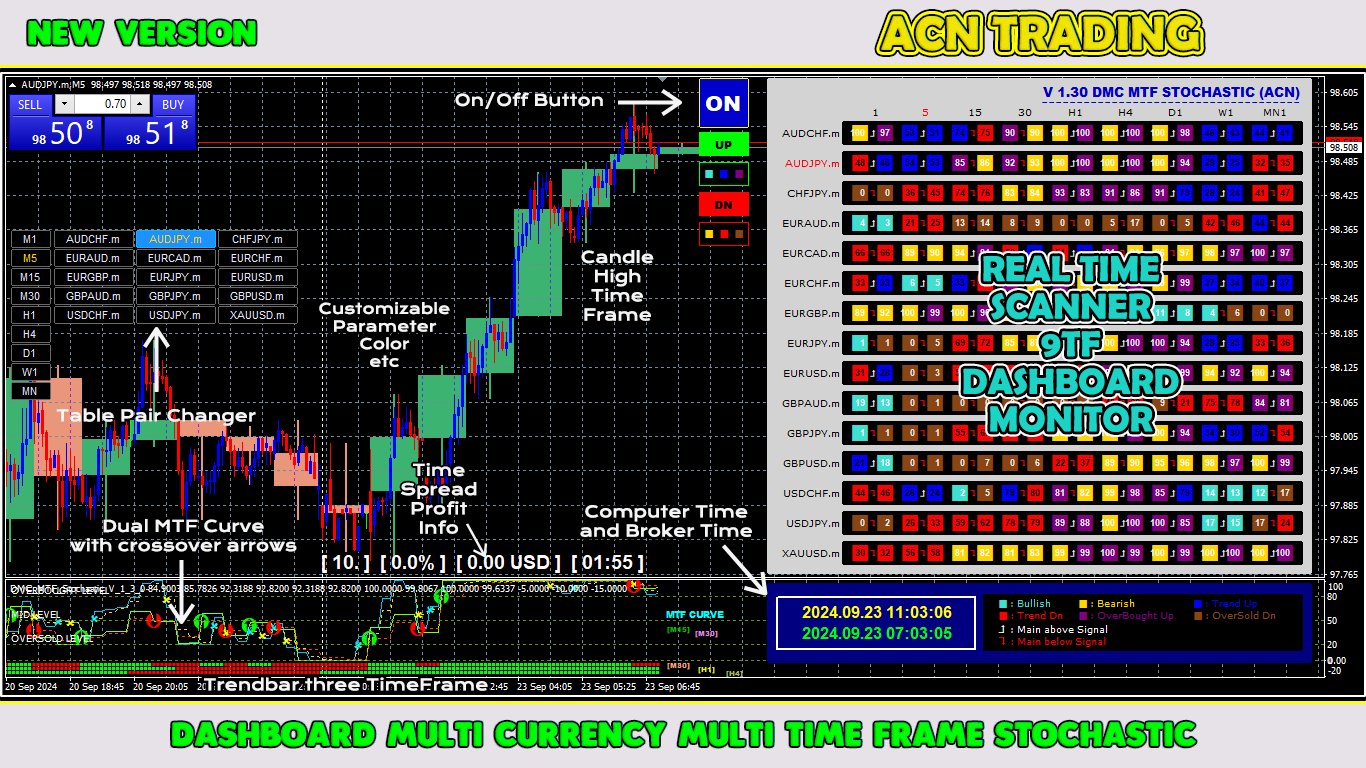
这是一个随机扫描仪或仪表板,具有许多出色的功能:
可显示随机主线数据
可显示随机信号线数据
可以显示随机主线和信号线的位置(信号线上方主线或信号线下方主线)
可以显示随机主线和信号线的数据水平(看涨、看跌、趋势向上、趋势向下、超买但仍向上、超卖但仍向下)
可显示从M1到MN1的实时数据
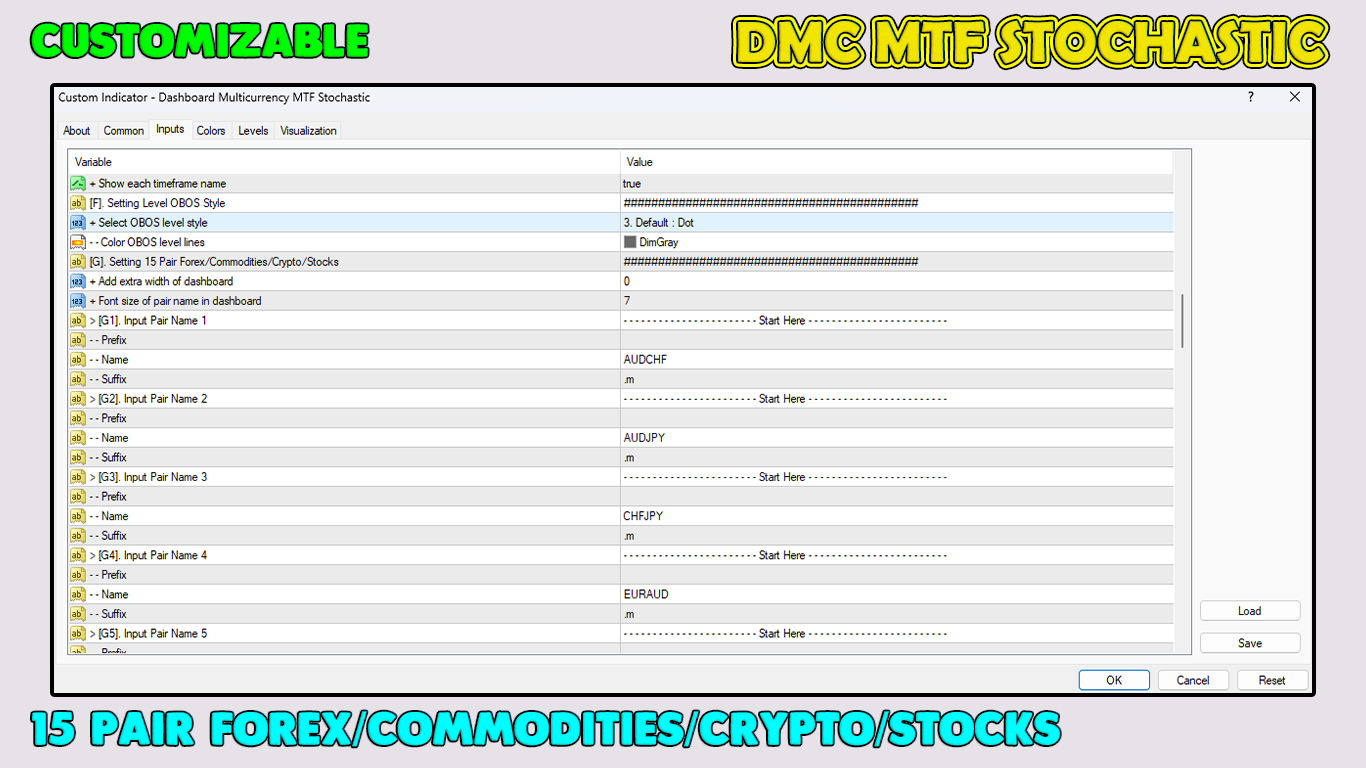
可显示15种货币对的数据(多币种外汇/商品/加密货币/股票)
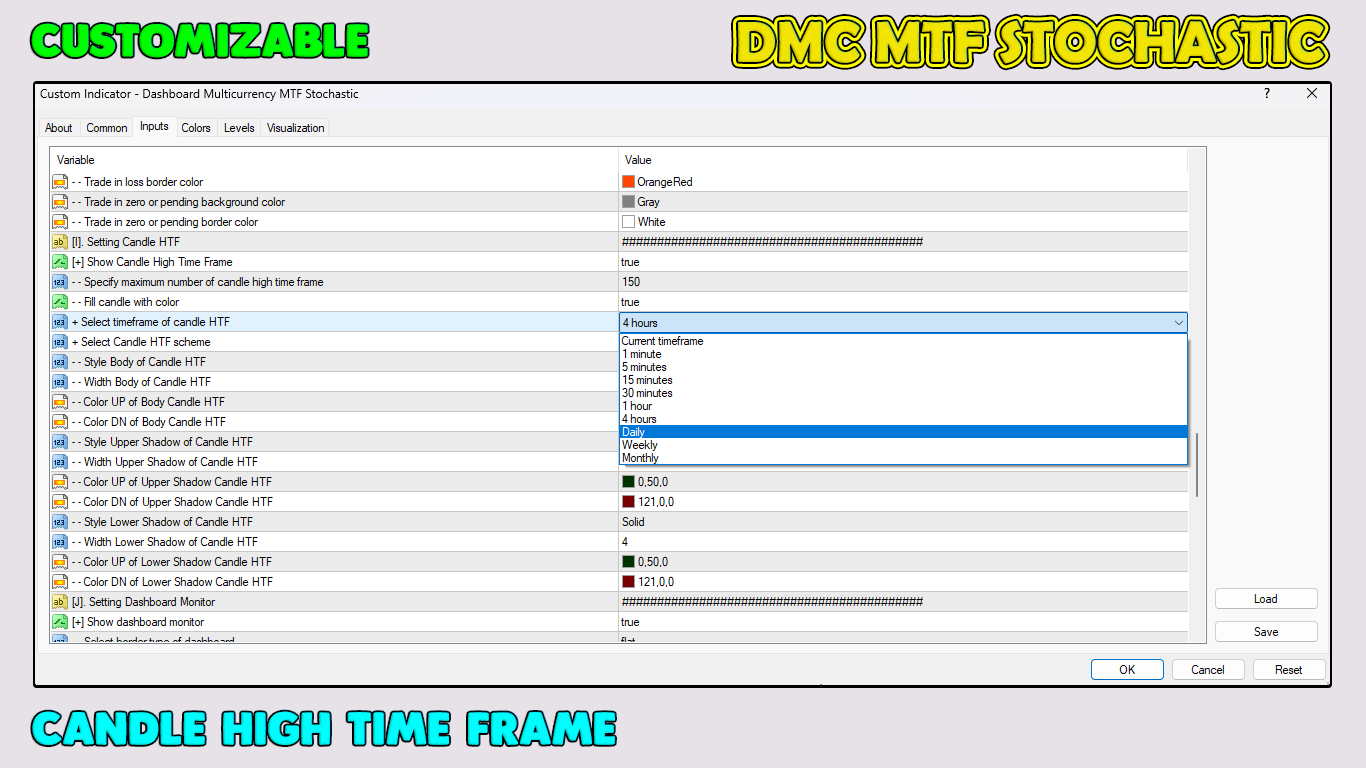
可定制参数
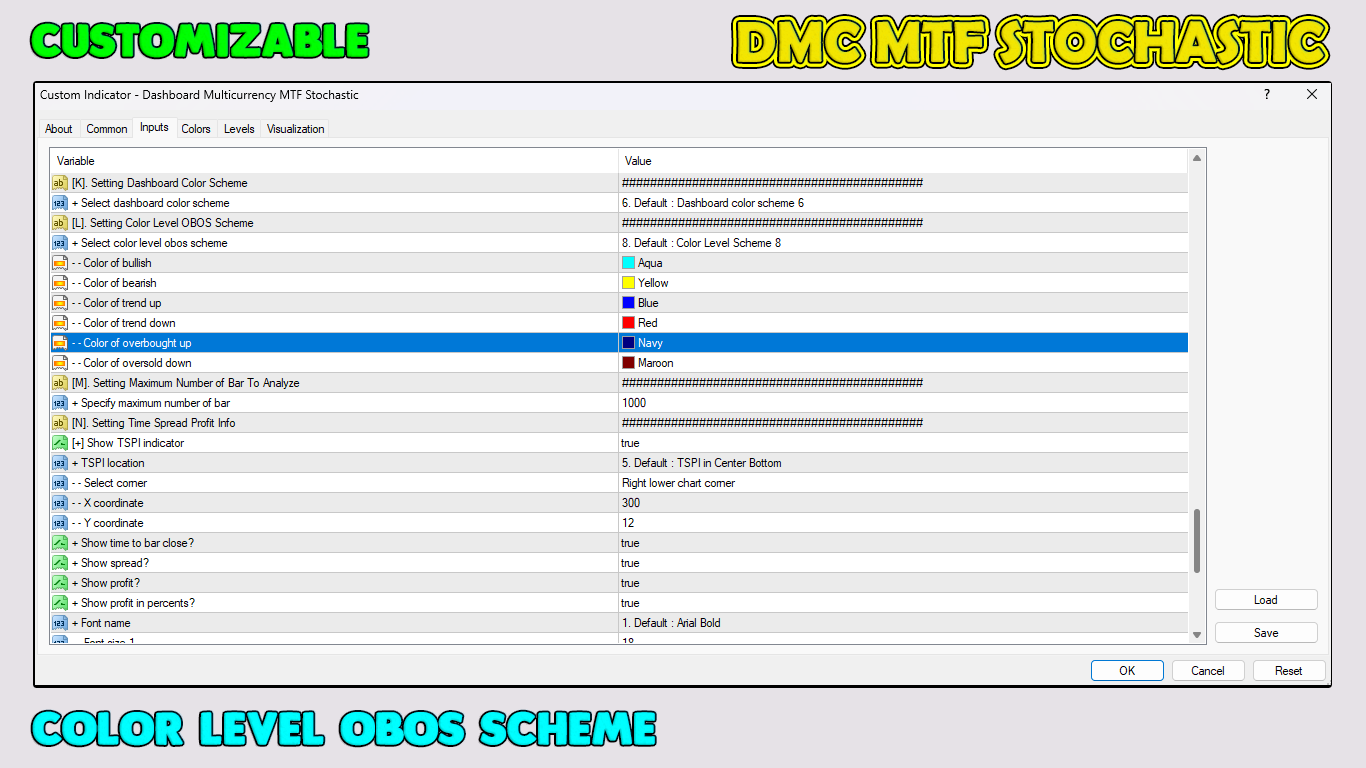
可定制颜色 OBOS 级别
漂亮的20仪表板配色方案
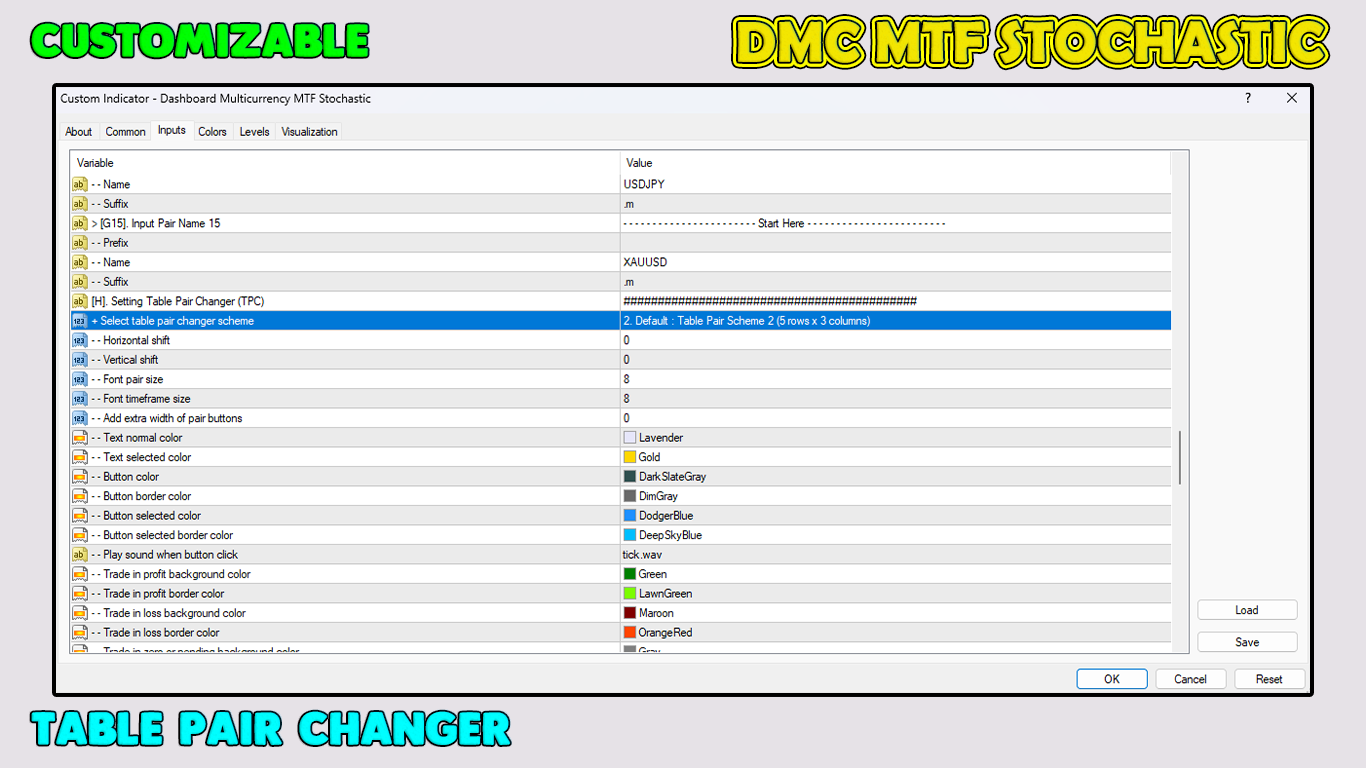
配备开/关货币对转换器
配备蜡烛高时间框架
配备时间点差利润信息
配备当前本地电脑时间和经纪人时间
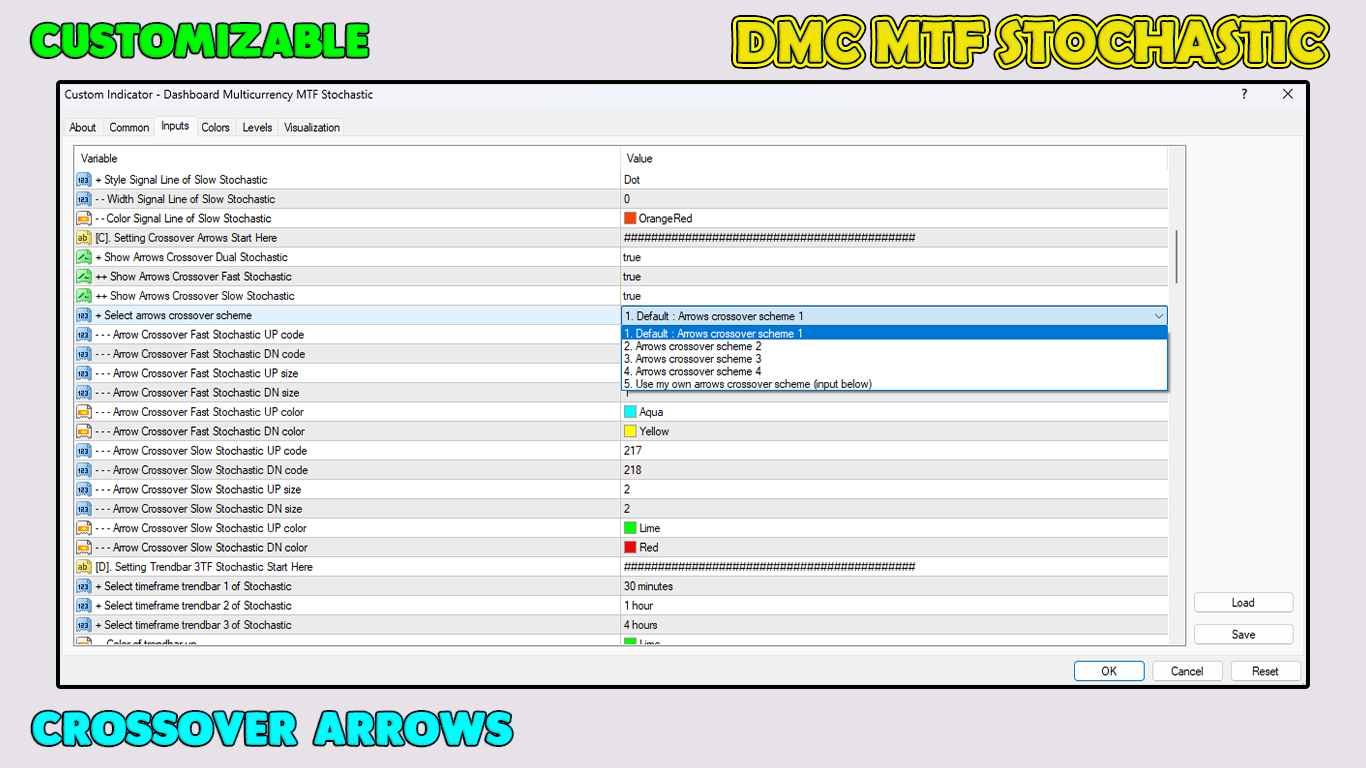
配备双MTF随机曲线
配备双MTF随机曲线交叉箭头
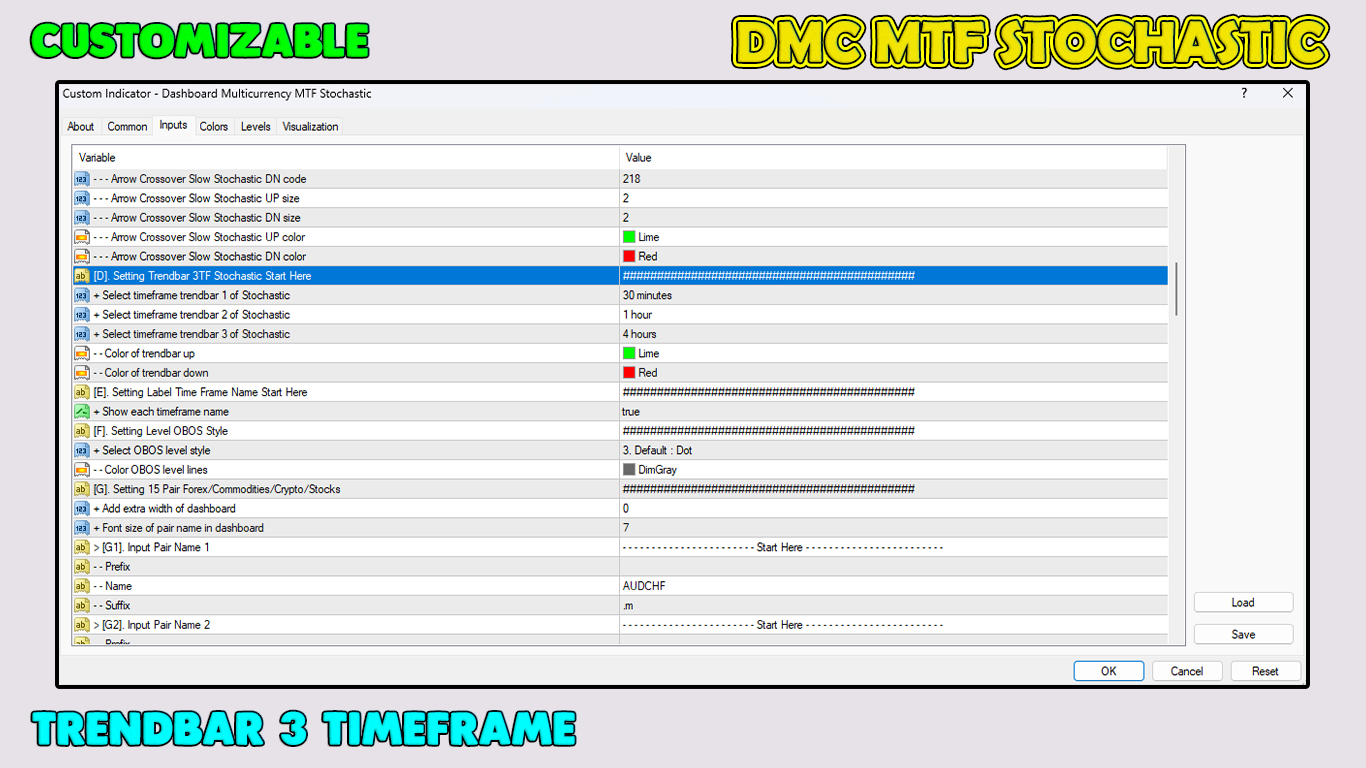
配备趋势条3TF随机
这个交易工具绝对是每个交易者所需要的。
今天下载。
自信地入场并像专业人士一样进行交易!
谢谢。