Parabolic SAR and Support and Resistance Levels
- Indicators
-
Irina Cherkashina
 I have been actively trading, including with the help of my own expert advisors, on financial markets since April 2012. In addition to trading with my own money, I work as a technical analyst in a mutual fund. In my free time, I like to go to live music concerts, travel, and hang out with friends.
 - Version: 1.0
- Activations: 5
The Parabolic SAR & Support/Resistance Levels is not only a technical analysis indicator, used in forex trading to identify potential trend reversals and entry and exit points, but also a ready-made autonomous trading strategy.
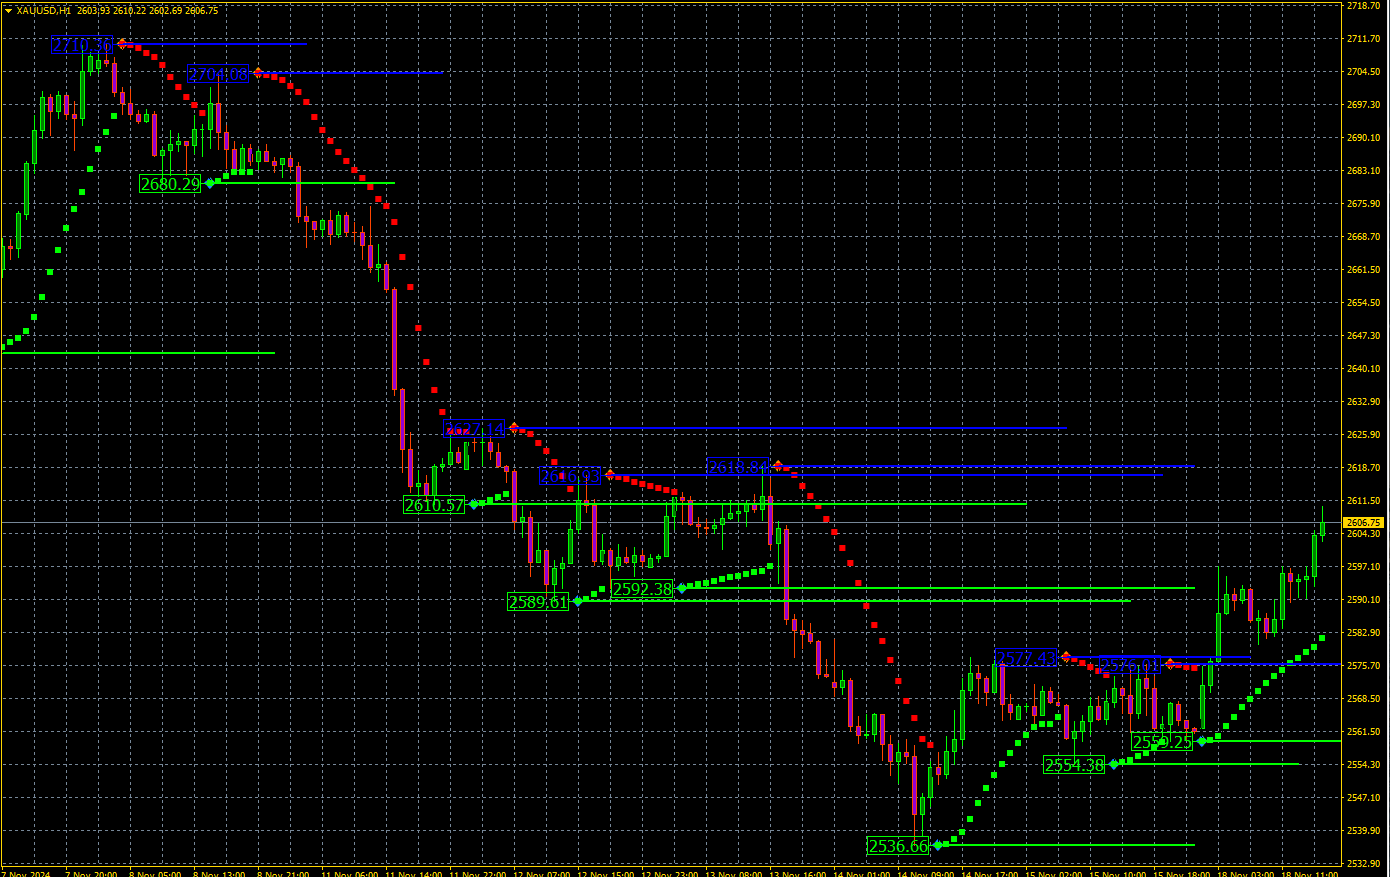
The Indicator builds upon the PSAR indicator by adding dynamic support and resistance levels to the chart, which can help traders identify key price levels where the market may potentially reverse. Using this indicator, traders can gain insight into the strength and direction of the market, as well as potential entry and exit points for their trades.
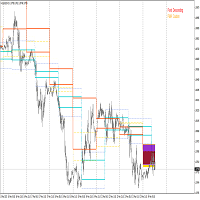
The Parabolic SAR & Support/Resistance Levels indicator is a technical analysis tool that plots various Parabolic Support and Resistance (PSAR) levels on the chart, providing traders with potential trend reversal signals. The indicator is displayed as a series of horizontally aligned lines in the main MT4 chart window, making it easy for traders to identify the actual PSAR levels. It can also be used to trail stops and plot support and resistance levels based on consistent logic, allowing traders to use their favorite indicators against the levels to look for trades.This tool can be used for scalping, day trading, and swing trading strategies. Although the indicator is known to repaint, it still provides good accuracy and can be used as a standalone forex indicator and as a trading strategy.
Here’s a simple strategy using the Parabolic SAR & Support/Resistance Levels indicator in forex trading:
• Identify the trend direction: The first step is to determine the overall trend direction using the indicator.
• If the PSAR dots are below the price bars, it indicates an uptrend, while if they are above the price bars, it indicates a downtrend.
• Wait for a pullback: Once you have identified the trend, wait for a pullback to the dynamic support or resistance level. The support or resistance level can be identified by the horizontal lines on the chart that are created by the indicator
• Enter a trade: After the price pulls back to the dynamic support or resistance level, wait for the price to bounce off the level and resume in the direction of the trend. Enter a long trade if the trend is up, and a short trade if the trend is down.
Buy Signal:
• The PSAR dots are below the price bars, indicating an uptrend.
• Wait for a pullback to the dynamic support level, which is the lower horizontal line on the chart created by the indicator.
• Once the price reaches the dynamic support level, wait for a bullish price action signal such as a bullish candlestick pattern, a trend line breakout, or a bullish chart pattern.
• Enter a long trade once the price bounces off the dynamic support level and resumes in the direction of the trend.
Sell Signal:
• The PSAR dots are above the price bars, indicating a downtrend.
• Wait for a pullback to the dynamic resistance level, which is the upper horizontal line on the chart created by the indicator.
• Once the price reaches the dynamic resistance level, wait for a bearish price action signal such as a bearish candlestick pattern, a trend line breakout, or a bearish chart pattern.
• Enter a short trade once the price bounces off the dynamic resistance level and resumes in the direction of the trend.
Buy Signal 2:
• Look for long trades around the blue-colored PSAR horizontal lines.
• Use a sound trading strategy for buy trade entry confirmation.
• Set a stop loss for your position a few pips below the entry candle or according to your money management strategy.
Sell Signal 2:
• Look for short trades around the orange-colored PSAR horizontal lines.
• Use a sound trading strategy for sell trade entry confirmation.
• Set a stop loss for your position a few pips above the entry candle or according to your money management strategy.