Dashboard Multi Currency MTF Stochastic
- Indicatori
-
Anon Candra N
 I am a professional trader who has been in the stock market for several years. After making in-depth observations of the stock market, I developed the trading tools that have helped my trading career so far. The good news is, you can have these trading tools on this website.
 - Versione: 1.50
- Aggiornato: 6 febbraio 2025
- Attivazioni: 20
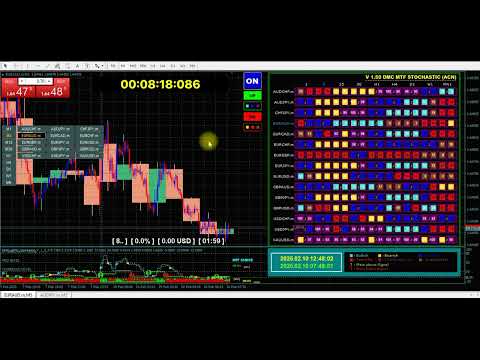
Con questo strumento di trading puoi scansionare 15 mercati contemporaneamente.
Presentazione del nuovo indicatore di trading 2024:
➡️ Dashboard Stocastico multi valuta e multi time frame.
Ci sono almeno due ragioni per cui ho creato questo strumento di trading:
Innanzitutto, sono stanco di osservare solo un mercato.
In secondo luogo, non voglio perdere il momento di ingresso in un altro mercato.
Ecco perché voglio conoscere contemporaneamente altre condizioni di mercato.
Per questo motivo ho bisogno di uno scanner in grado di scansionare le condizioni di più mercati contemporaneamente.
Cerco spesso mercati in cui la linea principale stocastica > (o <=) linea del segnale stocastico inizia da M1 a H4 (o semplicemente da M1 a M30).
Se sei d'accordo con la mia analisi, allora questo è l'indicatore di trading che stavi cercando.
Non perdere il momento in cui le condizioni di mercato soddisfano i requisiti di cui sopra.
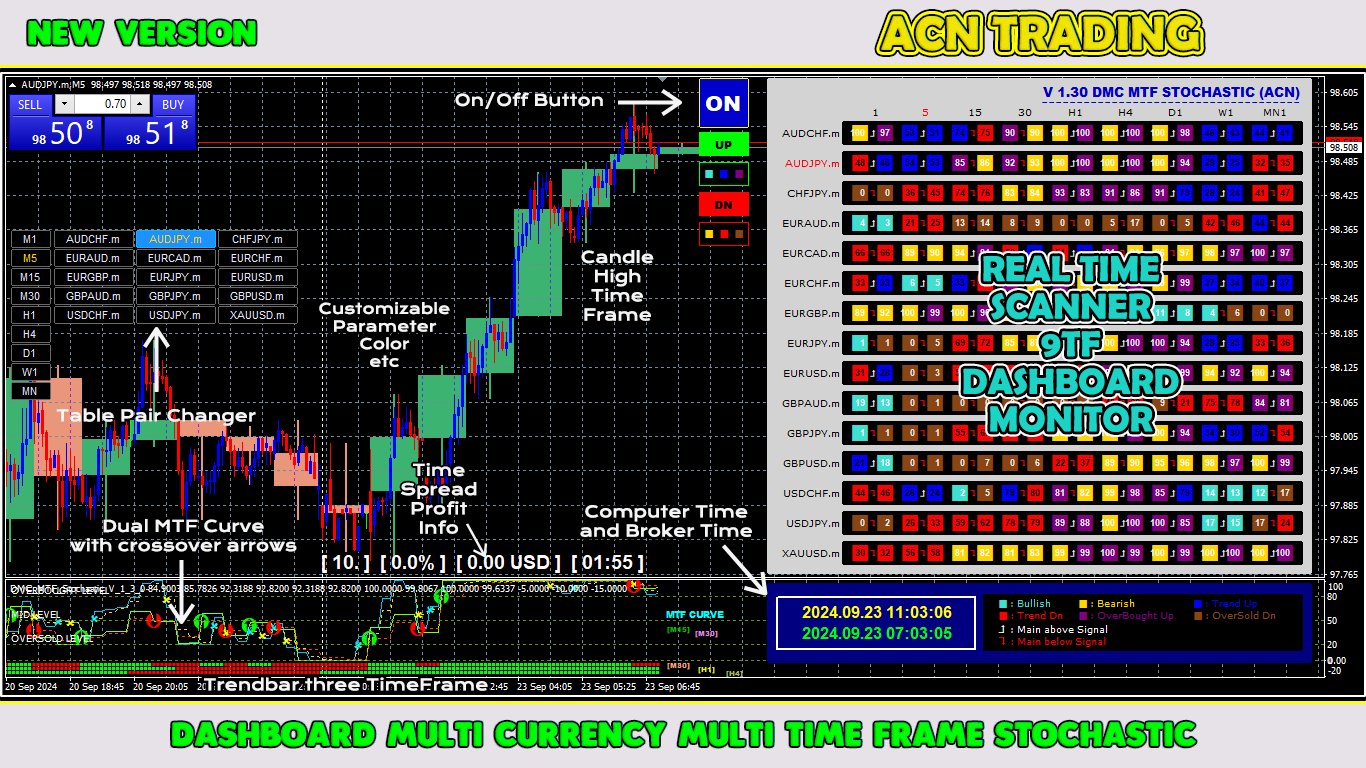
Questo è uno scanner o un dashboard stocastico con molte fantastiche funzionalità:
Può mostrare i dati della linea principale stocastica
Può mostrare i dati della linea del segnale stocastico
Può mostrare la posizione della linea principale stocastica e della linea di segnale (linea principale sopra la linea di segnale o linea principale sotto la linea di segnale)
Può mostrare il livello dei dati sia della linea principale stocastica che della linea di segnale (rialzista, ribassista, tendenza al rialzo, tendenza al ribasso, ipercomprato ma ancora in rialzo e ipervenduto ma ancora in ribasso)
Può mostrare dati in tempo reale da M1 a MN1
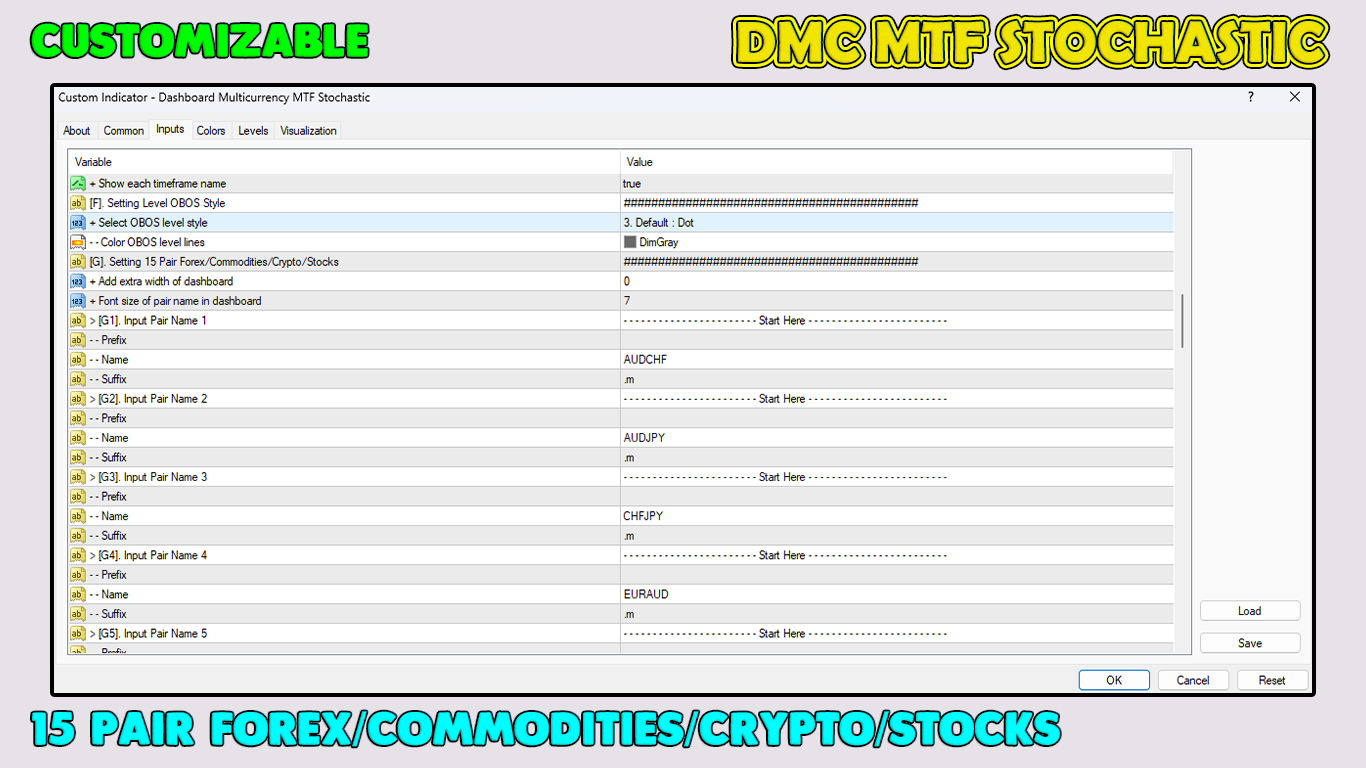
Può mostrare i dati di 15 coppie di valute (forex multivaluta/commodities/cripto/azioni)
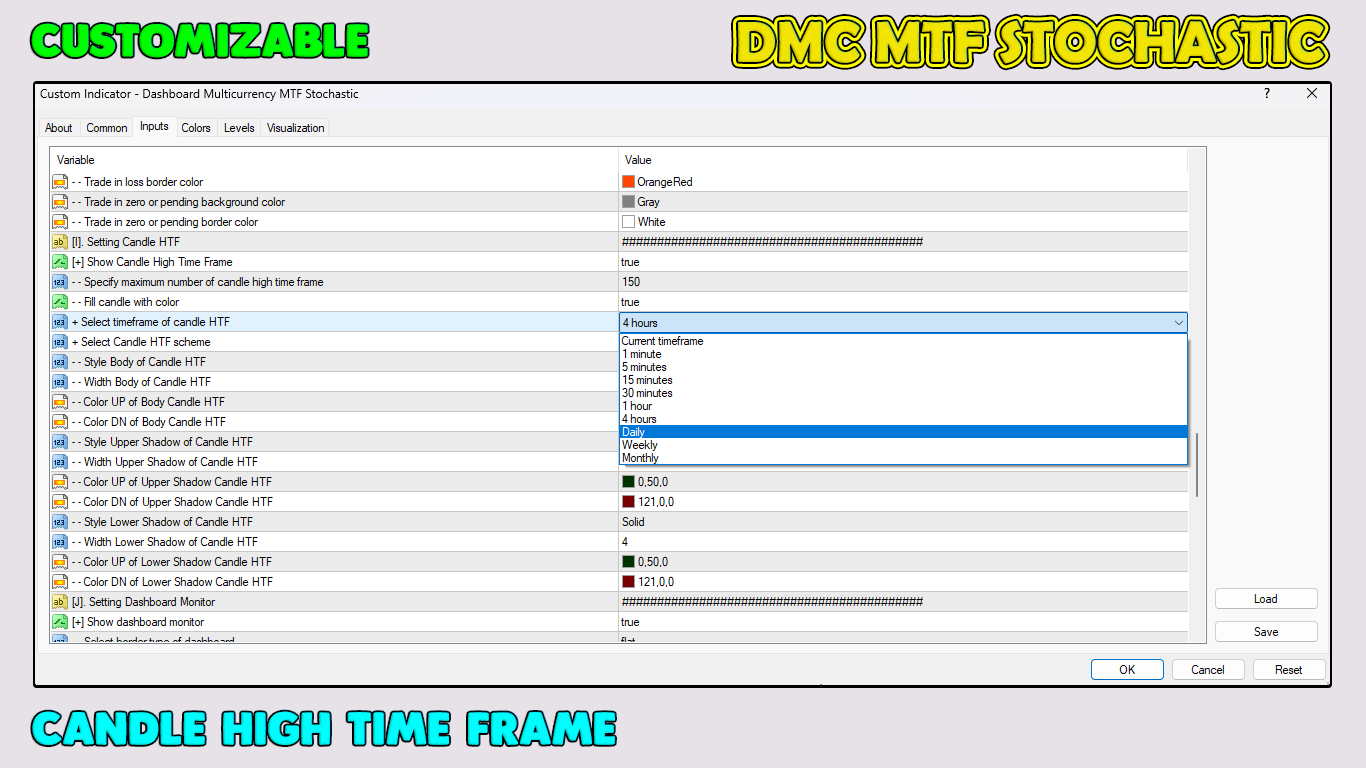
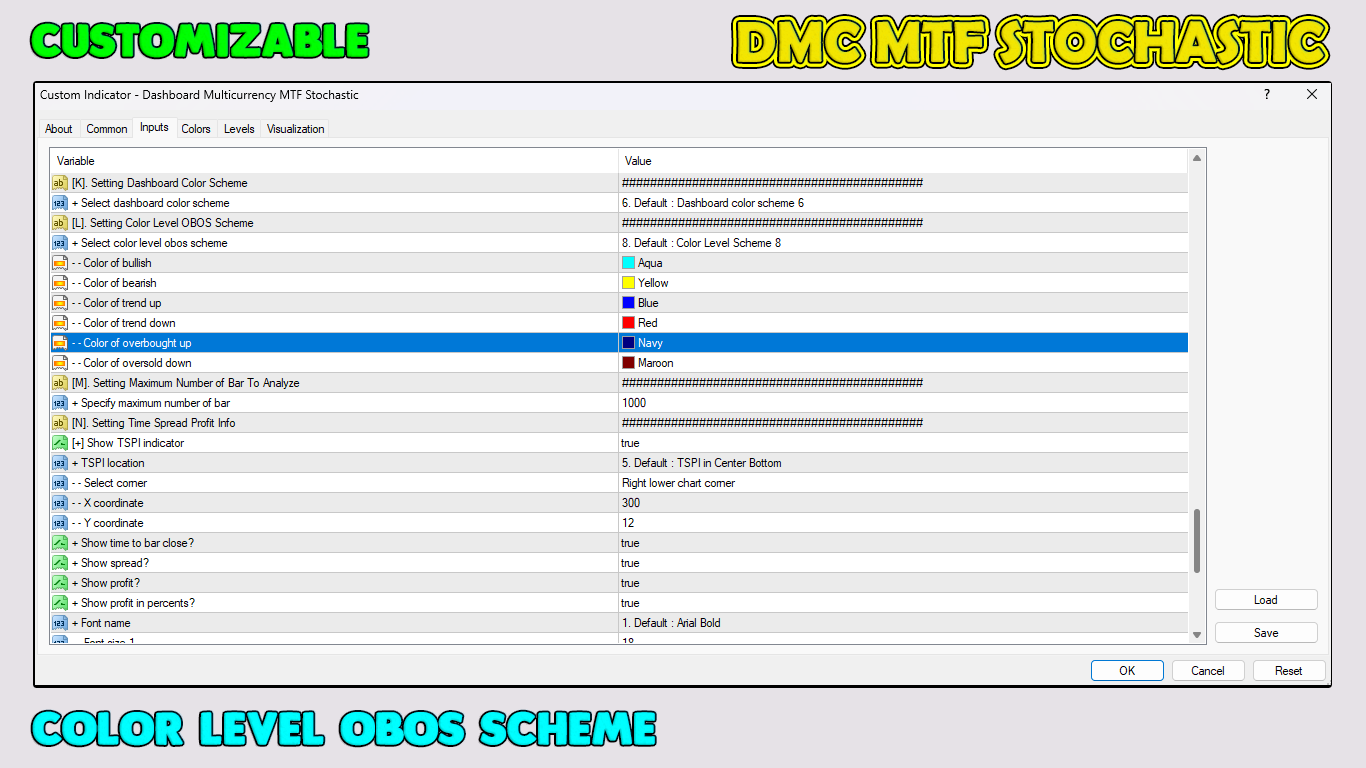
Parametro personalizzabile
Livello OBOS a colori personalizzabili
Bellissima combinazione di 20 colori del cruscotto
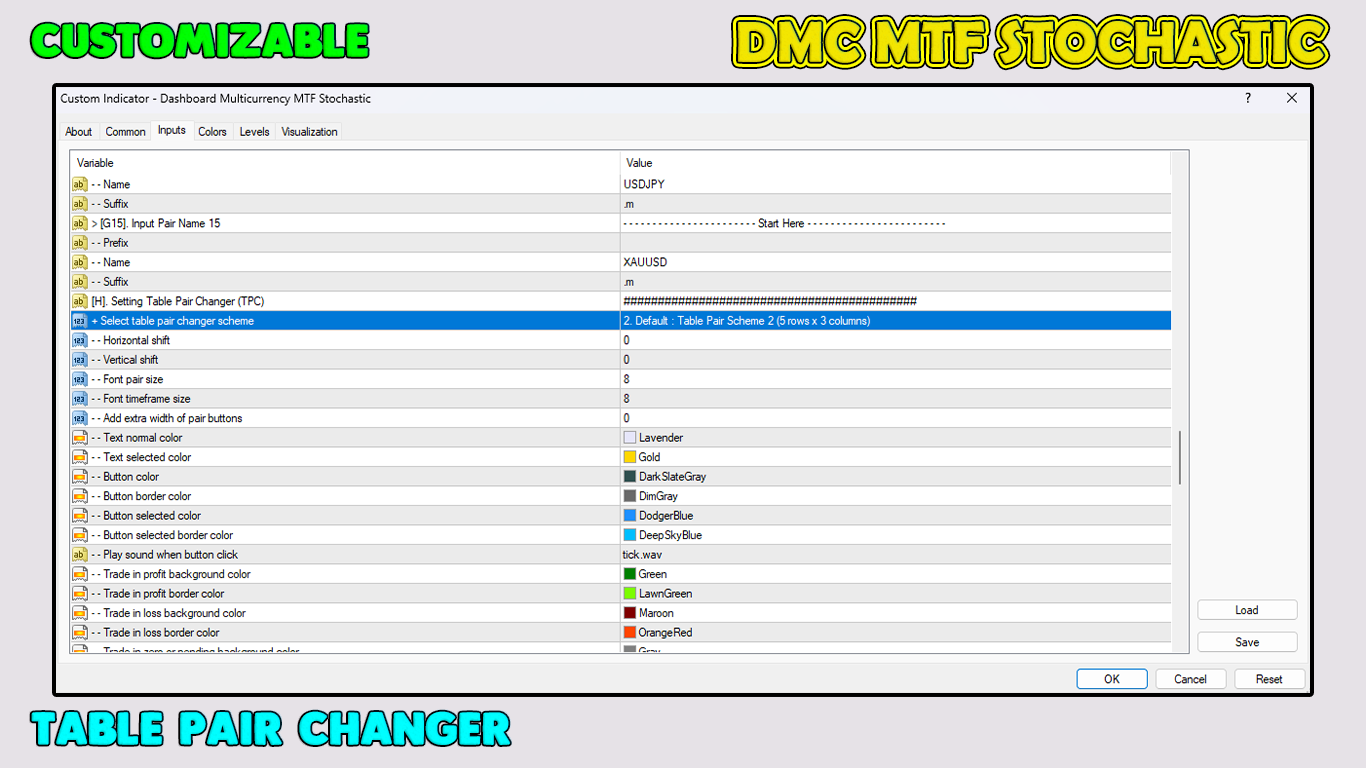
Dotato di cambiavalute on/off
Dotato di candela alta tempistica
Dotato di informazioni sui profitti distribuiti nel tempo
Dotato dell'ora corrente del computer locale e dell'ora del broker
Dotato di doppia curva stocastica MTF
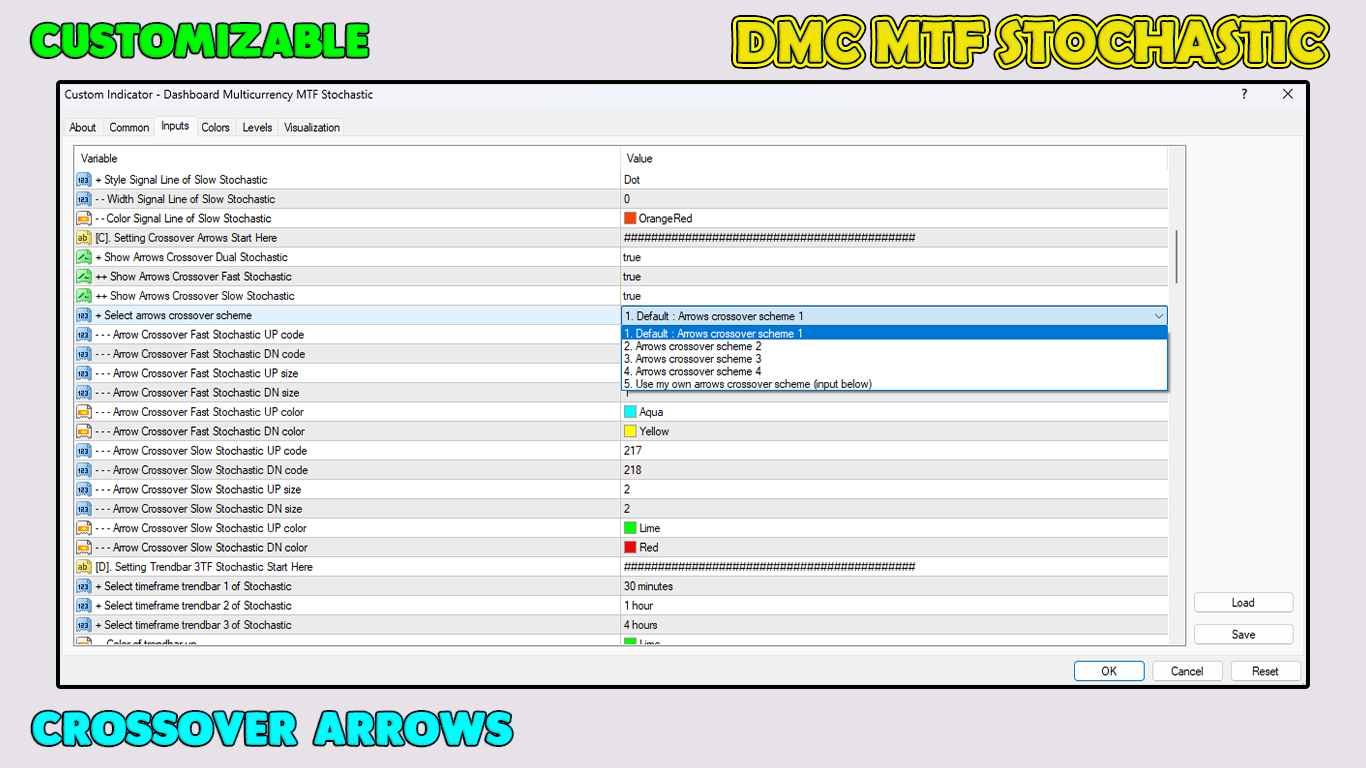
Dotato di frecce incrociate della doppia curva stocastica MTF
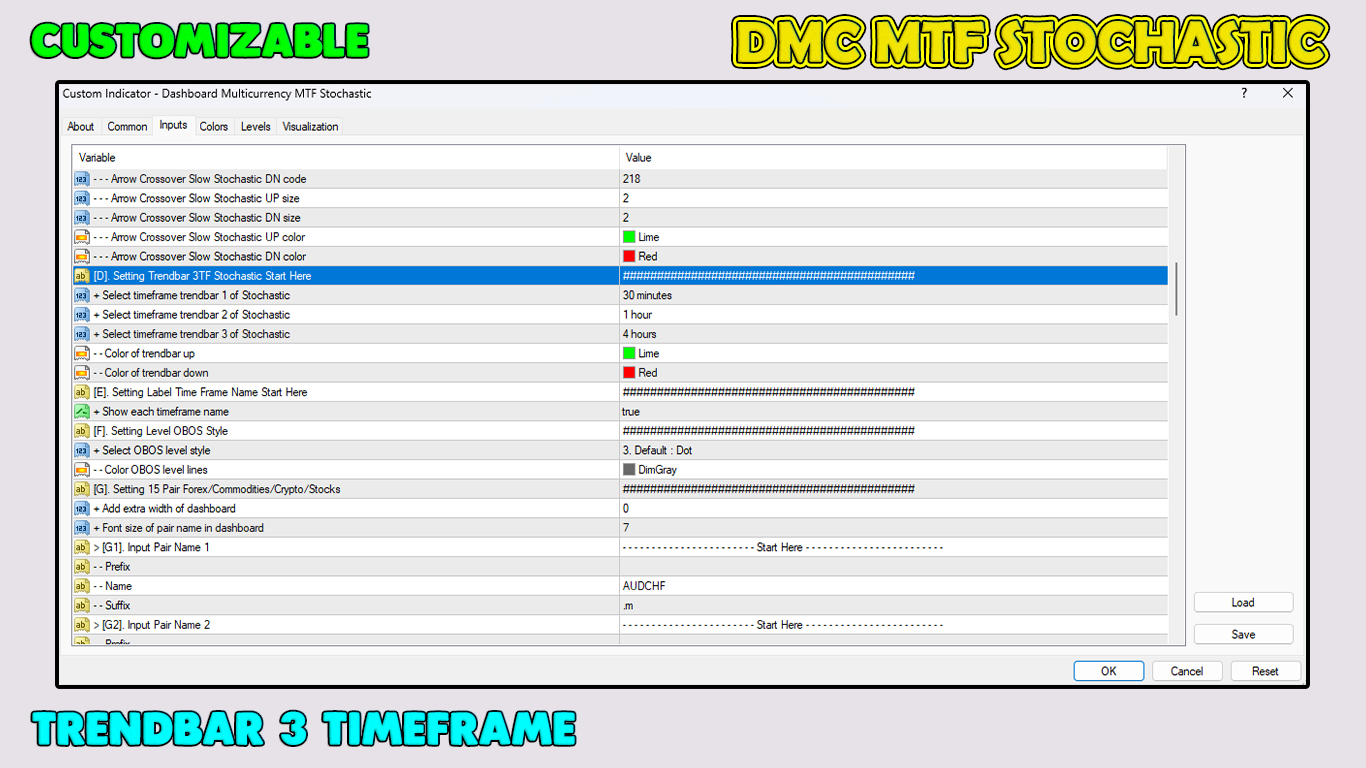
Dotato di trend bar 3TF stocastico
Questo strumento di trading è assolutamente ciò di cui ogni trader ha bisogno.
Scarica oggi.
Effettua entrate sicure e fai trading come un professionista!
Grazie.