Dashboard Multi Currency MTF Stochastic

Com esta ferramenta de negociação, você pode analisar 15 mercados simultaneamente.

Apresentando o novo indicador de negociação 2024:

➡️ Painel Estocástico Multi Moeda Multi Time Frame.

Há pelo menos duas razões pelas quais criei esta ferramenta de negociação:

Primeiro, estou cansado de observar apenas um mercado.
Segundo, não quero perder o momento de entrada em outro mercado.

É por isso que quero conhecer outras condições de mercado ao mesmo tempo.

Por esta razão, preciso de um scanner que possa analisar as condições de vários mercados simultaneamente.

Costumo procurar mercados onde a linha principal estocástica > (ou <=) linha de sinal estocástica começa de M1 a H4 (ou apenas M1 a M30).

Se você concorda com minha análise, então este é o indicador de negociação que você está procurando.

Não perca o momento em que as condições de mercado atendem aos requisitos acima.

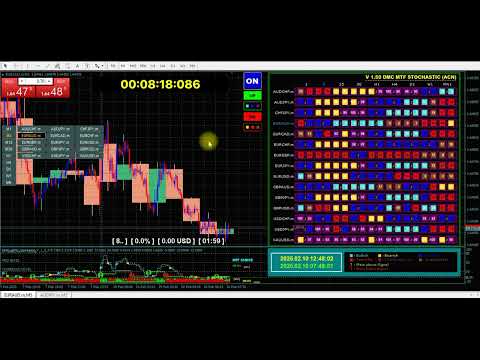
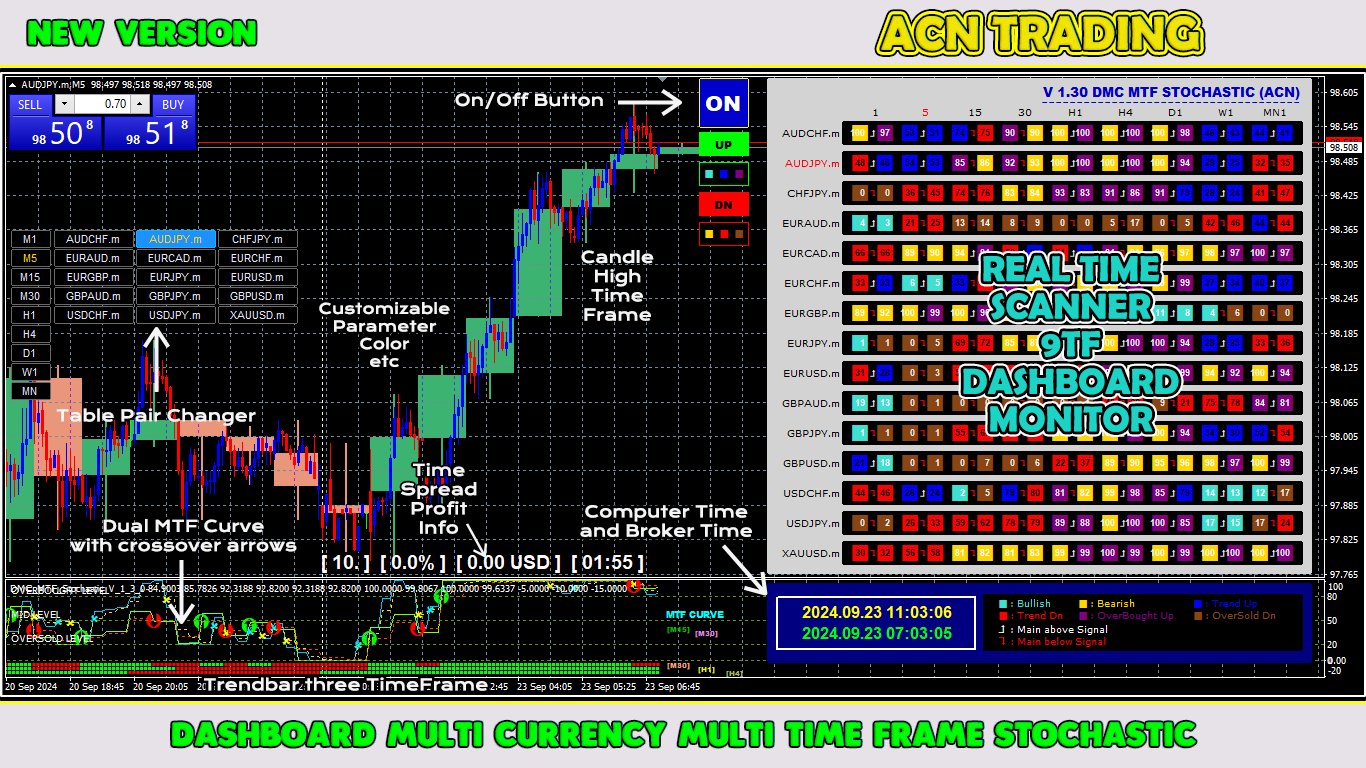
Este é um scanner ou painel estocástico com muitos recursos excelentes:

Pode mostrar os dados da linha principal estocástica
Pode mostrar os dados da linha de sinal estocástica
Pode mostrar a posição da linha principal estocástica e da linha de sinal (linha principal acima da linha de sinal ou linha principal abaixo da linha de sinal)
Pode mostrar o nível de dados da linha principal estocástica e da linha de sinal (alta, baixa, tendência de alta, tendência de baixa, sobrecompra, mas ainda em alta, e sobrevenda, mas ainda em baixa)
Pode mostrar dados em tempo real de M1 a MN1
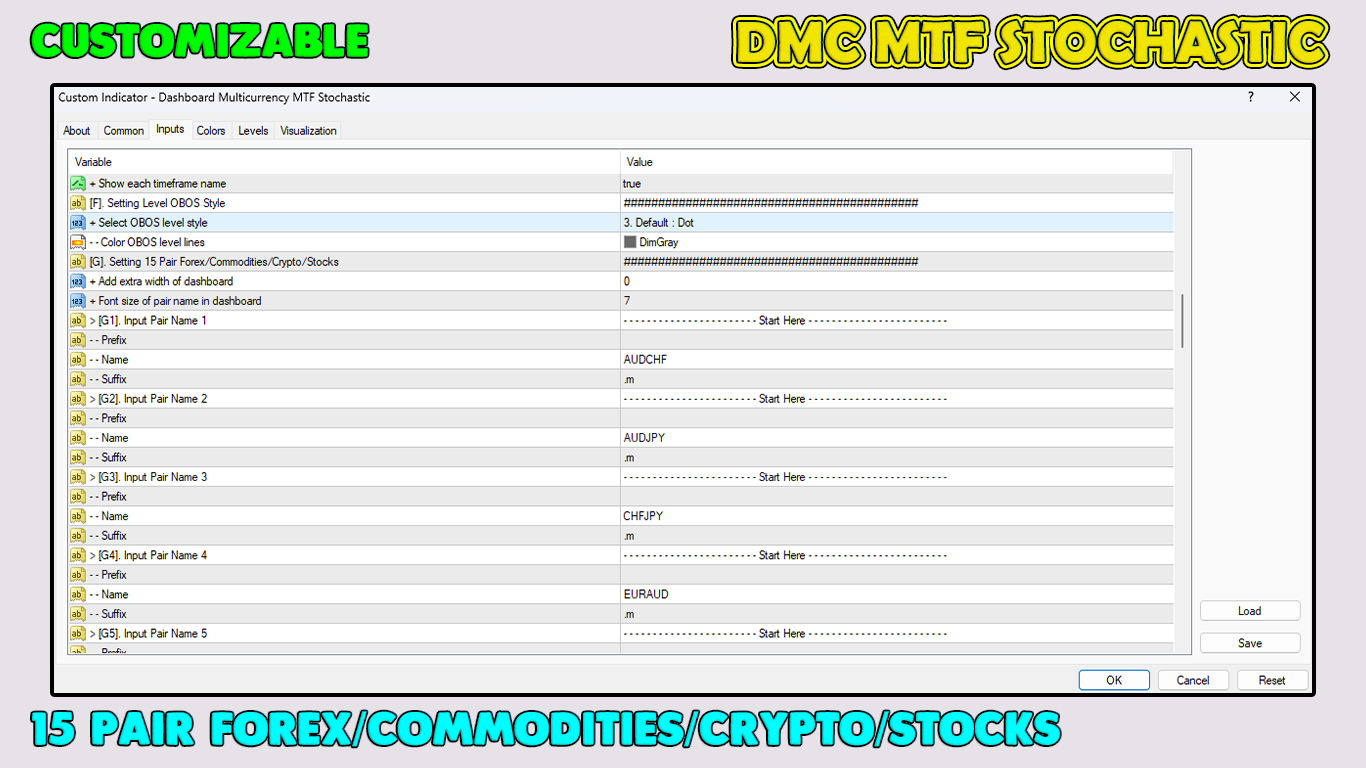
Pode mostrar os dados de 15 pares de moedas (forex/commodities/criptografia/ações em várias moedas)
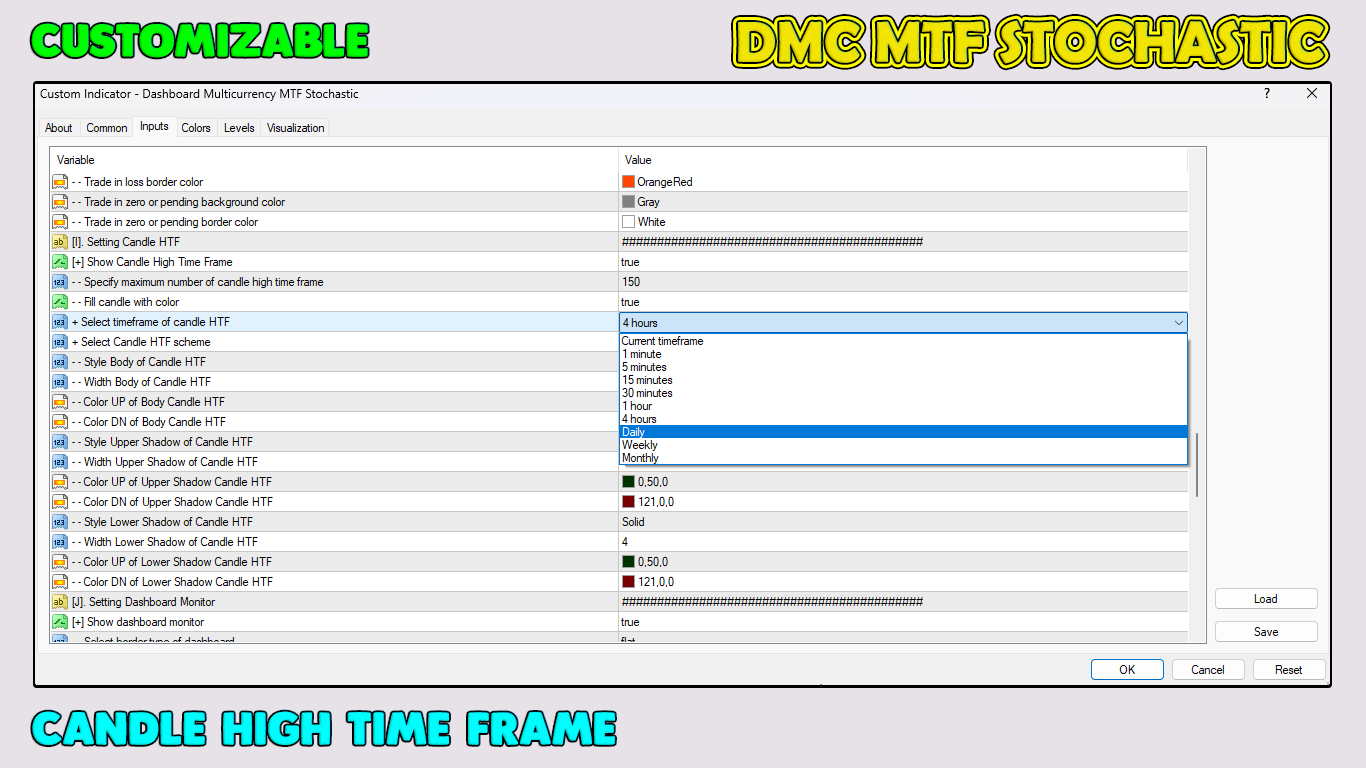
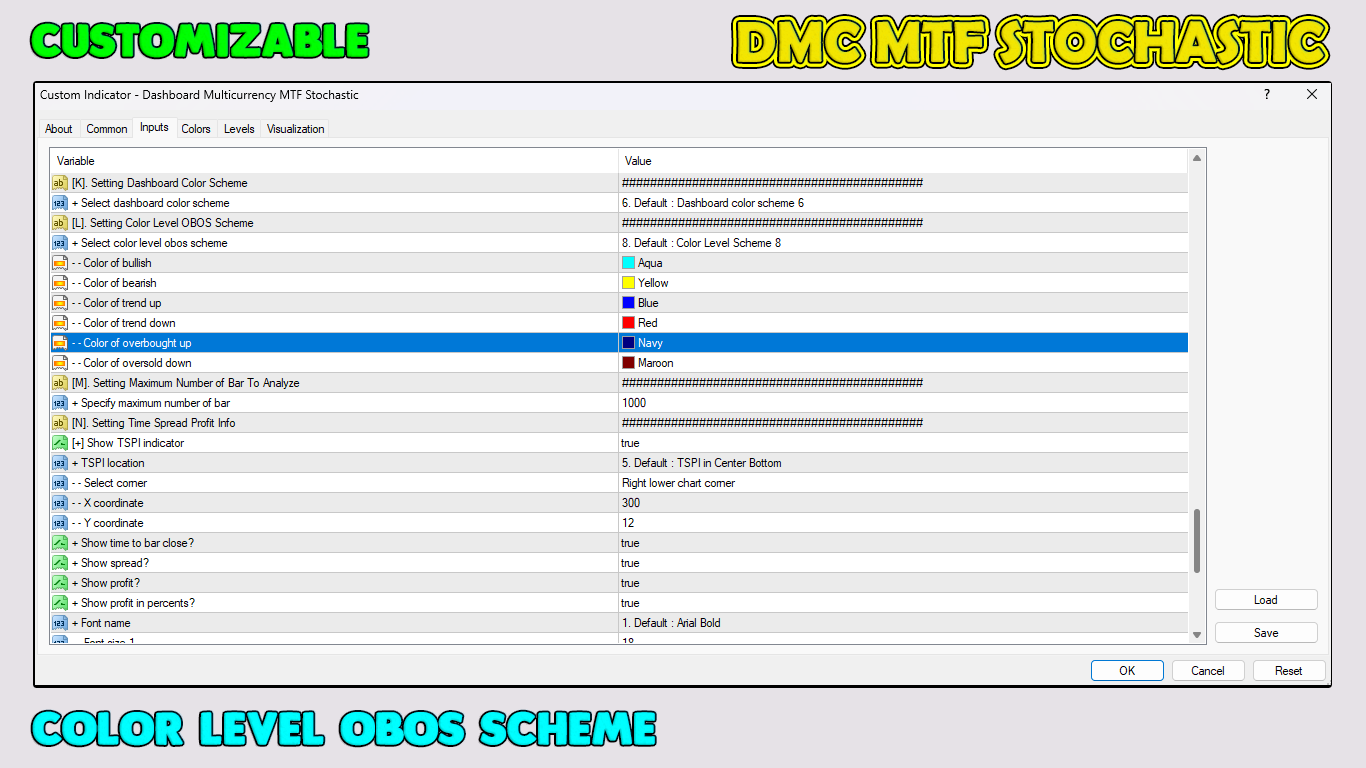
Parâmetro personalizável
Nível OBOS de cor personalizável
Lindo esquema de cores do painel com 20
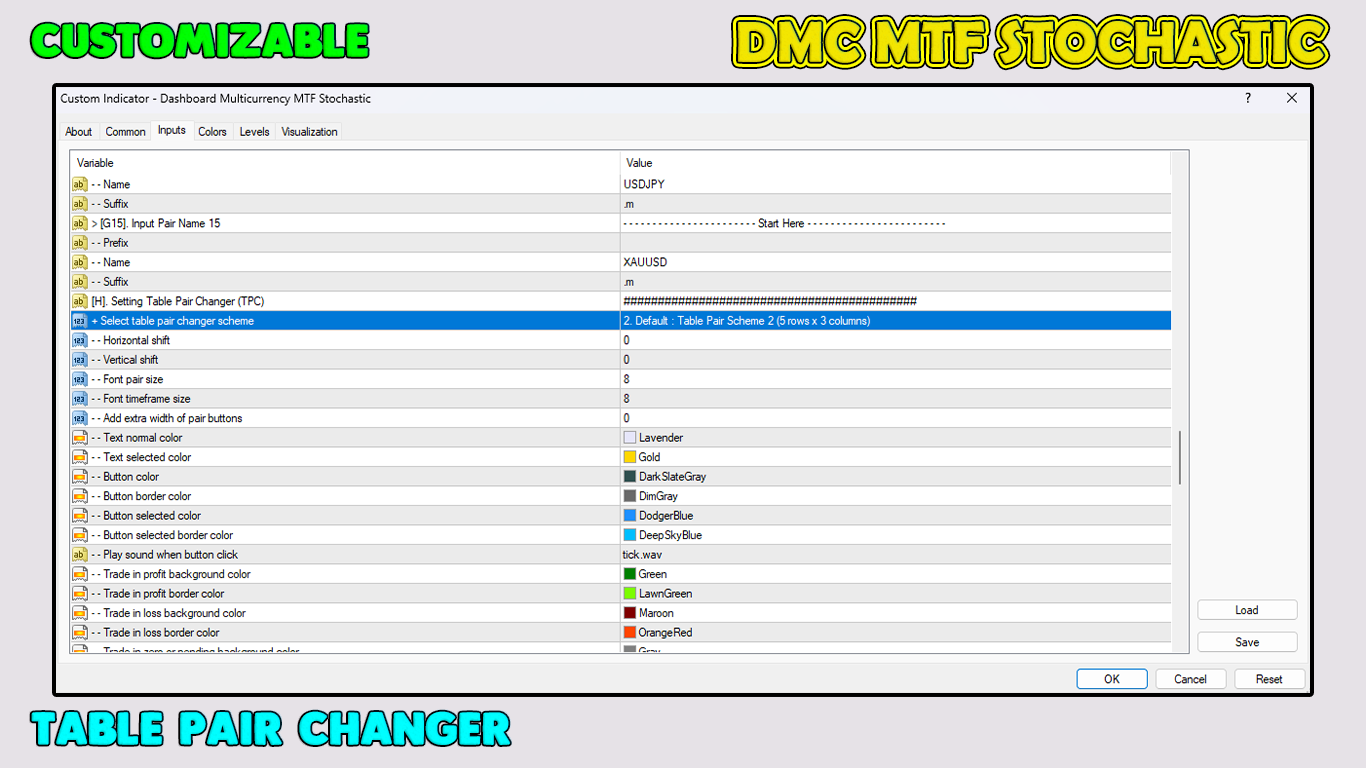
Equipado com trocador de par de moedas liga/desliga
Equipado com intervalo de tempo alto de vela
Equipado com informações de lucro distribuído no tempo
Equipado com a hora local atual do computador e a hora do corretor
Equipado com curva estocástica dupla MTF
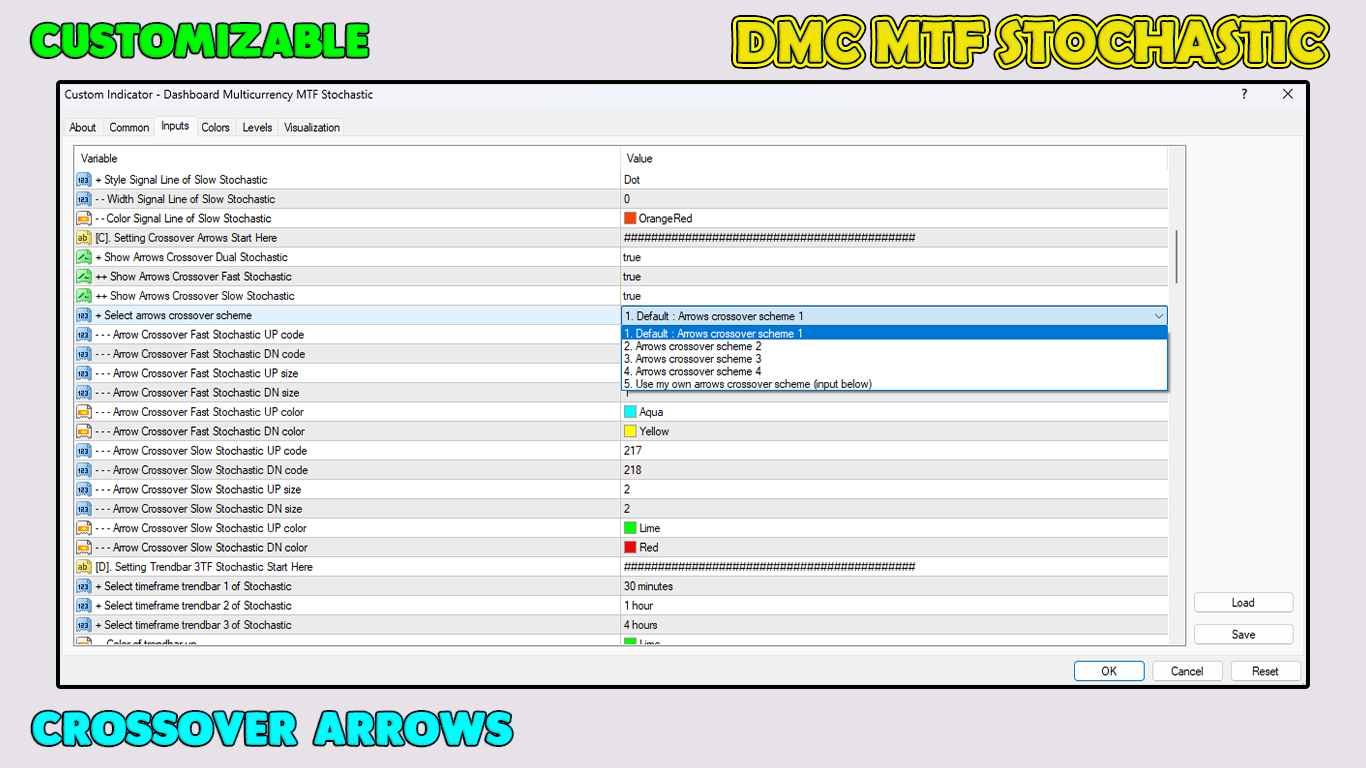
Equipado com setas cruzadas de curva estocástica MTF dupla
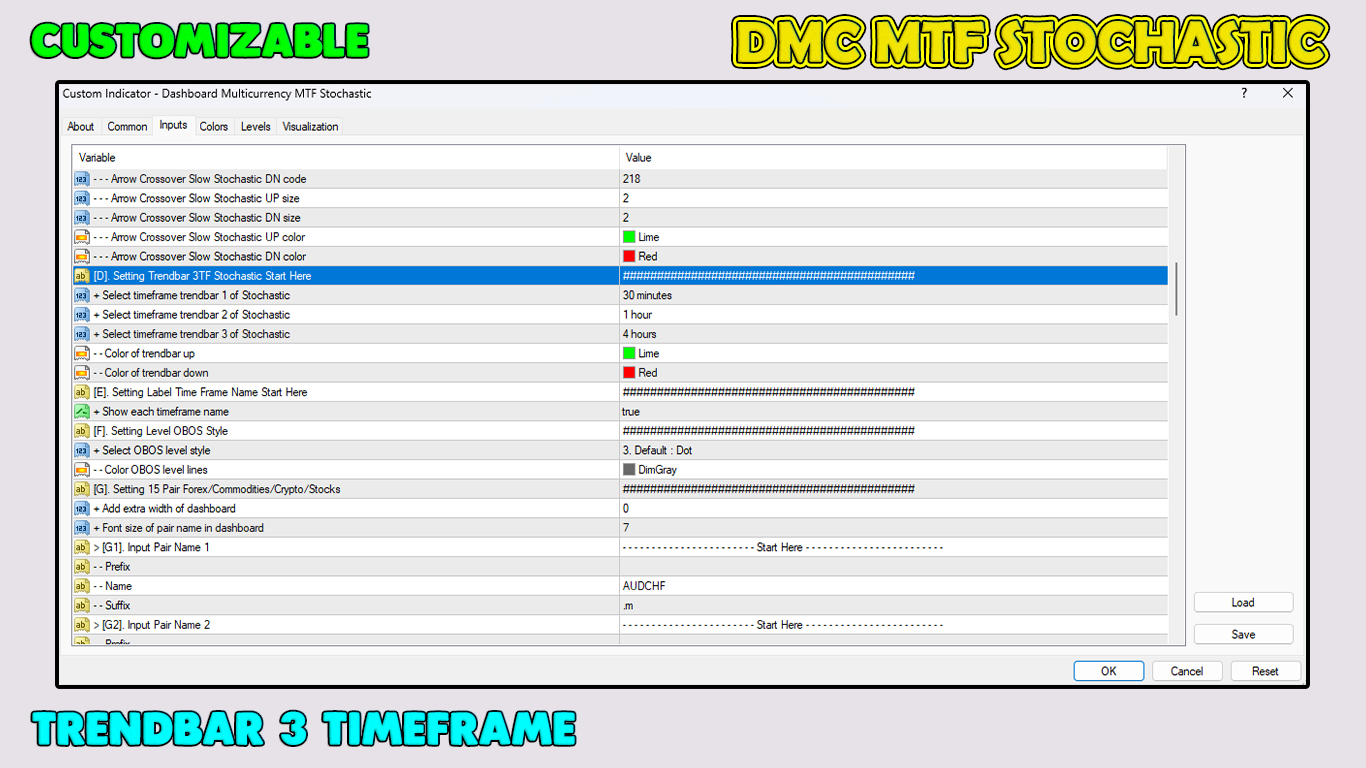
Equipado com barra de tendência 3TF estocástica
Esta ferramenta de negociação é absolutamente o que todo trader precisa.

Baixe hoje.

Faça entradas confiantes e negocie como um profissional!

Obrigado.
Produtos recomendados
PTW NON REPAINT TRADING SYSTEM + HISTOGRAM Non-Repainting ,   Non-Redrawing   and   Non-Lagging  Trading System. Does the following: - Gives Accurate Entry and Exit Points - Scalping, Day and Swing Trading  - 95% Accuracy  - Targets, where to take profits. - Shows Trends, Support and resistance levels - Works on All Brokers - Works on All Currencies, CFDs and Stocks - It does not place trades for you, it only shows you what trades to place. - It works on All Timeframes - It is for Trend or ran
Fibo Reversals is an indicator which has carefully been put together to attempt to indicate a time period in which an ongoing trend is most probably exhausted and a new trend (actually a reversal trend) inadvertently begins. At this, it should be okay for the manual trader to be on the look out for good trading opportunities. Input Settings Father Fibo  – This Input Determines The Highest Price For The Chosen Input Period. Son Fibo  - This Input Determines The Lowest Price For The Chosen Input
ToolBox 360 is the swiss knife of all indicators. It is full packed with useful tools to help you with your trading. It can be used to find best entry and exit points and help you to decide if you should open a trade or not. It shows market trends, candlestick formations outside / inside bars and you can sett time based allerts. Main features: Time based Fibonacci lines Choose a start and end time and the indicator shows you Fibonacci lines within the selected time range including range high a
Dynamic SR Trend Channel Dynamic SR Trend Channel is a simple indicator for trend detection as well as resistance/support levels on the current timeframe. It shows you areas where to expect possible change in trend direction and trend continuation. It works with any trading system (both price action and other trading system that use indicators) and is also very good for renko charting system as well. In an uptrend, the red line (main line) serves as the support and the blue line serves as the r
Pyro Trend
Oleksii Ferbei
Pyro Trend is a new product that allows you to identify the current market phase (uptrend, downtrend or flat). The indicator is applicable for any data and periods. The middle of the trend wave, as well as the edges, are places of special heat and market behavior; when writing the indicator, an attempt was made to implement precisely finding the middle. Pyro Trend is a trend indicator that uses an original calculation algorithm. This indicator paints arrows in different colors depending on the
O SAR Parabólico e os Níveis de Suporte/Resistência não são apenas um indicador de análise técnica, utilizado na negociação forex para identificar potenciais reversões de tendências e pontos de entrada e saída, mas também uma estratégia de negociação autónoma pronta a utilizar. O indicador baseia-se no indicador PSAR, adicionando níveis dinâmicos de suporte e resistência ao gráfico, o que pode ajudar os traders a identificar os principais níveis de preços onde o mercado pode potencialmente rev
Unlock Smarter Trading with the Bands Breakout! Are you tired of confusing charts and missed opportunities? Get clear, high-probability entry and exit signals right on your chart with the Bands Breakout  indicator! This isn't just another indicator; it's a complete, trend-aware system designed to simplify your trading decisions and focus only on the best moves. Our unique engine combines the momentum power of the EMA 10 with the volatility framework of the Bollinger Bands to find definitive buy
FREE
ROC acceleration-deceleration is the manual system for medium-term scalping. Indicator based on custom ROC system which defines bullish/bearish market and especially  acceleration-deceleration of tendention in the market's main direction. Buy arrow is plotted during bearish market when current trend decelerates and sell  arrow is plotted during bullish market when current trend decelerates. Main Indicator's Features Signals are not repaint,non-late or disappear(exept cases when system recalculat
This indicator allows you to see the strength of the trend on all timeframes. It can be used for all currency pairs. The indicator can be displayed in the form of a column (from left to right): status buy / sell / strong buy / strong sell, strength of the trend in percentage, pips last candle, body candle now, remaining time, and the timeframe of M1 to MN. Information contained below (from left to right): total trend percent, sell percent, buy percent.
Sarangani Venom
Sherwin Dennis Tava Ruiz
sarangani venom is 100% profitable, easy to use indicator, a chart without indicator is stressful and will lead you to many losses, this indicator is pleasing to the eye that will gives you more confident to trade when there is signal, your computer will gives sound and the spider will animate, it can be used to all time frame and to all currency, you have many options, when the candlestick touches to upper line it is buy, when it touches to lower line it is sell, when the rope is pull to buy ar
Global Trend
Vitalii Zakharuk
Global Trend Indicator, shows the signals for entry. Displays both entry points and the trend itself. Shows statistically calculated moments for entering the market with arrows. When using the indicator, the risk factor can be optimally distributed. Settings: Uses all one parameter for settings. Choosing a parameter, it is necessary to visually resemble it so that the appropriate graph has a projection of extremes. Parameters: Length - the number of bars for calculating the indicator. Use
Drawing Pack
John Louis Fernando Diamante
4 (1)
This indicator provides several drawing tools to assist in various methods of chart analysis. The drawings will keep their proportions (according to their handle trendline) across different chart scales, update in real time, and multiple drawings are supported. # Drawing Option Description  1 Grid box draggable boxed grid, user defines rows x colums, diagonal ray option  2 Grid partial or fullscreen grid, sized by handle line  3 Grid flex a diagonal grid, sized and sloped by handle line  4 Cyc
Colored indicator of the linear channel based on the Fibonacci sequence. It is used for making trading decisions and analyzing market sentiment. The channel boundaries represent strong support/resistance levels, as they are the Fibonacci proportion levels. Users can select the number of displayed lines of channel boundaries on the chart by means of the input parameters. Attaching multiple instances of the indicator to the chart with different calculation periods leads to displaying a system of c
CSS " currency strength slope "  is a a multi currency strength indicator that use Forex major currencies, EUR, USD, CAD, AUD, NZD, JPY, CHF, GBP. it use 28 major pairs to calculate the power of every currency using a based moving averages algorithm : you will see volatility clearly between currencies. input: MA Fast & Slow. - MA Mode : simple, exponential, smoothed, linear weighted - Applied Price : close, open, high, low, median price, typical price, weighted price.
Note : The slow loading of the indicator issue has been addressed . This new version loads fast and does not slow the platform. Version 1.3 : We have updated the indicator to include an historical bar scanning option . So instead of scanning all bars in the history (which can make the indicator slow sometimes ) , you can select the maximum number of bars it can scan which can increase the performance and make the indicator faster. This indicator scans the 1-3 Trendline pattern . The indicato
O R Var Moving Average Indicator é um indicador de tendência desenvolvido para seguidores obstinados de tendências. É um indicador de negociação forex bastante popular entre os comerciantes de ações, bem como os comerciantes de commodities, e sua popularidade decorre de sua capacidade de fornecer sinais genuínos de geração de dinheiro para seus usuários. O indicador é composto por pontos verdes e vermelhos que são colocados em uma linha sienna. O ponto verde aponta para um sinal de alta, enqu
FREE
Using multiple timeframes for analysis with Multi Timeframe Average Directional Index  can provide several significant benefits for traders: Comprehensive Market View: By applying Mtf ADX Standard across different timeframes, traders gain a broader perspective on market dynamics. This allows them to identify trends, patterns, and potential reversal points that might be more apparent or consistent across various scales. Enhanced Pattern Recognition: Multiple timeframes help in identifying repeati
FREE
Indicador Crypto_Forex "Padrões Martelo e Enforcado" para MT4, sem repintura, sem atraso. - O indicador "Martelo e Enforcado" é um indicador muito poderoso para negociação de Price Action. - O indicador detecta padrões Martelo de alta e Padrão Homem Enforcado de baixa no gráfico: - Padrão Martelo de alta - Sinal de seta azul no gráfico (veja as imagens). - Padrão Homem Enforcado de baixa - Sinal de seta vermelha no gráfico (veja as imagens). - Com alertas para PC, celular e e-mail. - O indicad
Moving Pivot Average    The pivot indicator compares the selected period with its counterpart from the previous period. The indicator uses very flexible algorithm for pivot value calculating. It allows you to allocate in days a certain time intervals (custom bars) and calculate the average pivot value based on High, Low and Close prices of these bars. How many custom bars will be taken into account is determined by the "Days" setting. The pivot line can be considered an average trend line and us
Master Max
Abdulkarim Karazon
MASTER MA é um indicador baseado em cruzamento de média móvel, usando 3 médias móveis com diferentes períodos cruzados para gerar sinais, a estratégia é muito simples, mas o indicador possui um painel de estatísticas que mostra resultados úteis de backtest instantâneos, como taxa de vitória/lucros totais ganhos... etc., este indicador tem entradas de TP e SL em pontos para que você possa ter seu TP e SL desejados visíveis no gráfico na forma de ponto verde para TP e x vermelho para SL, o indica
Niubility Trend  Niubility Trend displays the trend direction for all time frames in real time. You'll see at a glance at which direction the trends are running, how long they last and how powerful they are. All this makes it an easy-to-use trend trading system for beginners, advanced and professional traders. Features Easy to trade Customizable colors and sizes It is non-repainting and non-backpainting It is fantastic as a trailing stop method It implements alerts of all kinds
Atomic CHOCH BOS Trend Indicator v1.4 TRADING AUTOMATION EXPERTS - MT4 tools designed to enhance trader performance. Master the Smart Money Strategy with Precision _____________________________________________________________________________________________________________________________________________________________________________ Smart Market Structure Analysis Unlock the power of smart market structure analysis with the Atomic Break of Structure Change of Character (CHOCH) / Break of Str
Trade Stats
Johannes Schoeman
Does your trading consist of Multiple EA's, Multiple time frames an no clear indication of how each individual strategy or time frame is performing, then this indicator will help. Assign the EA Magic number to this indicator and track it's performance on the chart by selecting on chart the period, today, week, month year or all history to view. Easy visual colour changing header to display the performance of the EA for the respective periods.    Minimize the panel to reduce chart clutter. Add yo
Introduction to Fractal Pattern Scanner Fractal Indicator refers to the technical indicator that makes use of the fractal geometry found in the financial market. Fractal Pattern Scanner is the advanced Fractal Indicator that brings the latest trading technology after the extensive research and development work in the fractal geometry in the financial market. The most important feature in Fractal Pattern Scanner is the ability to measure the turning point probability as well as the trend probabi
The trader uses the Trend for Neuro indicator to determine the market situation. This is a trending algorithm that is convenient to download, install and use. The algorithm with acceptable accuracy generates input signals and output levels. Strategy for trend trading, filtering and all the necessary functions built into one tool! By launching the indicator, the user will see only two types of arrows that can change color to blue during an uptrend, to red during a downtrend there is no uncertaint
FVG - Fair Value Gap The FVG - Fair Value Gap is an advanced MQL4 indicator designed for traders who utilize institutional order flow and Smart Money Concepts to identify market inefficiencies. This indicator automatically detects and highlights Fair Value Gaps (FVGs) on your chart, providing a clear visual representation of potential support and resistance zones, reversal points, and high-probability trading setups. Key Features: Automated FVG Detection: The indicator automatically identifies
Trend Colored Average
Teresinha Moraes Correia
Utilizando cores que refletem a direção predominante do mercado, o indicador foi desenvolvido para mostrar quando a tendência atual ainda é dominante. Isso ajuda a filtrar possíveis ruídos do mercado e orienta o trader a evitar sinais falsos. Ao visualizar com clareza a força e a consistência da tendência, a ferramenta auxilia na identificação de oportunidades de negociação com maior probabilidade de sucesso. Ela aumenta a precisão ao permitir que os traders foquem em movimentos que estejam ali
First Dawn
Innovicient Limited
The First Dawn indicator uses a unique mechanism to search and plot signals. This keeps searching for signals, making it a great indicator for scaping and identification of changes in direction, swing trading and trend trading. The  First Dawn   helps you get early signals. The backtest gives the true picture of how the indicator works with real/demo accounts. Although this is a tiny indicator it is packed with advantageous settings that will help you whether you desire to: Snap the Peaks and
Este indicador é um indicador para análise automática de ondas que é perfeito para negociações práticas! Caso... Nota:   Não estou acostumado a usar nomes ocidentais para classificação de ondas. Devido à influência da convenção de nomenclatura de Tang Lun (Tang Zhong Shuo Zen), nomeei a onda básica como   uma caneta   e a banda de onda secundária como   um segmento   . ao mesmo tempo, o segmento tem a direção da tendência.   O segmento de tendência principal   é nomeado (esse método de nomencl
Victorias
Andriy Sydoruk
Victoria is a trend indicator used to identify trends in financial markets, indicates the direction of price movement. Flexible indicator settings allow you to receive more accurate signals for opening positions. The indicator will allow you to determine the current trend. Using this algorithm, you can quickly understand what kind of trend is currently developing in the market. Victoria can be used along with oscillators as a filter. Victoria is a true range indicator that identifies the rang
Os compradores deste produto também adquirem
Scalper Inside PRO
Alexey Minkov
4.74 (69)
An exclusive indicator that utilizes an innovative algorithm to swiftly and accurately determine the market trend. The indicator automatically calculates opening, closing, and profit levels, providing detailed trading statistics. With these features, you can choose the most appropriate trading instrument for the current market conditions. Additionally, you can easily integrate your own arrow indicators into Scalper Inside Pro to quickly evaluate their statistics and profitability. Scalper Inside
Actualmente 20% OFF ! A melhor solução para qualquer novato ou comerciante especializado! Este software de painel de instrumentos está a funcionar em 28 pares de moedas. É baseado em 2 dos nossos principais indicadores (Advanced Currency Strength 28 e Advanced Currency Impulse). Dá uma grande visão geral de todo o mercado Forex. Mostra valores avançados de força da moeda, velocidade de movimento da moeda e sinais para 28 pares de divisas em todos os (9) períodos de tempo. Imagine como a sua n
Currency Strength Exotics
Bernhard Schweigert
4.88 (33)
ACTUALMENTE 20% DE DESCONTO ! A melhor solução para qualquer novato ou comerciante especializado! Este Indicador é especializado para mostrar a força da moeda para quaisquer símbolos como Pares Exóticos de Commodities, Índices ou Futuros. É o primeiro do seu género, qualquer símbolo pode ser adicionado à 9ª linha para mostrar a verdadeira força da moeda de Ouro, Prata, Petróleo, DAX, US30, MXN, TRY, CNH etc. Esta é uma ferramenta de negociação única, de alta qualidade e acessível, porque inco
Dynamic Forex28 Navigator
Bernhard Schweigert
4.43 (7)
Dynamic Forex28 Navigator - A ferramenta de negociação Forex de última geração. ATUALMENTE 49% DE DESCONTO. Dynamic Forex28 Navigator é a evolução dos nossos indicadores populares de longa data, combinando o poder de três em um: Indicador Advanced Currency Strength28 (695 avaliações) + Advanced Currency IMPULSE com ALERTA (520 avaliações) + Sinais CS28 Combo (Bônus). Detalhes sobre o indicador https://www.mql5.com/en/blogs/post/758844 O que o Next-Generation Strength Indicator oferece?  Tudo
GOLD Impulse with Alert
Bernhard Schweigert
4.64 (11)
Este indicador é uma super combinação dos nossos 2 produtos Advanced Currency IMPULSE with ALERT  +   Currency Strength Exotics . Funciona para todos os períodos de tempo e mostra graficamente impulso de força ou fraqueza para as 8 principais moedas mais um Símbolo! Este Indicador é especializado para mostrar a aceleração da força da moeda para quaisquer símbolos como Ouro, Pares Exóticos, Commodities, Índices ou Futuros. É o primeiro do seu género, qualquer símbolo pode ser adicionado à 9ª
Volatility Trend System - um sistema de negociação que dá sinais para entradas. O sistema de volatilidade fornece sinais lineares e pontuais na direção da tendência, bem como sinais para sair dela, sem redesenho e atrasos. O indicador de tendência monitora a direção da tendência de médio prazo, mostra a direção e sua mudança. O indicador de sinal é baseado em mudanças na volatilidade e mostra entradas no mercado. O indicador está equipado com vários tipos de alertas. Pode ser aplicado a vários i
Supply and Demand Dashboard PRO
Bernhard Schweigert
4.8 (20)
Actualmente 20% OFF ! Este painel é uma peça de software muito poderosa que trabalha em múltiplos símbolos e até 9 prazos. Baseia-se no nosso principal indicador (Melhores críticas: Advanced Supply Demand ).   O tablier dá uma óptima visão geral. Mostra:   Valores filtrados da Oferta e da Procura, incluindo a classificação da força da zona, Distâncias de/para as zonas e dentro das zonas, Destaca as zonas aninhadas, Dá 4 tipos de alertas para os símbolos escolhidos em todos os (9) períodos de
Indicador antecipado       Determina os níveis e zonas de reversão do mercado   , permitindo que você espere o preço retornar ao nível e entre no início de uma nova tendência, e não no seu fim. Ele mostra       níveis de reversão       onde o mercado confirma uma mudança de direção e inicia um movimento adicional. O indicador funciona sem redesenhar, é otimizado para qualquer instrumento e revela seu potencial máximo quando combinado com o       LINHAS DE TENDÊNCIA PRO       indicador. Scanner
Meravith
Ivan Stefanov
5 (1)
O indicador analisa o volume de cada ponto e calcula os níveis de exaustão do mercado para esse volume. Ele consiste em três linhas: Linha de exaustão do volume altista Linha de exaustão do volume baixista Linha que indica a tendência do mercado. Esta linha muda de cor para refletir se o mercado é altista ou baixista. Você pode analisar o mercado a partir de qualquer ponto inicial que escolher. Uma vez que uma linha de exaustão de volume seja atingida, identifique um novo ponto de início para o
Looking for a powerful yet lightweight swing detector that accurately identifies market structure turning points? Want clear, reliable buy and sell signals that work across any timeframe and any instrument? Buy Sell Arrow MT Swing is built exactly for that — precision swing detection made simple and effective. This indicator identifies Higher Highs (HH) , Higher Lows (HL) , Lower Highs (LH) , and Lower Lows (LL) with remarkable clarity. It is designed to help traders easily visualize market str
PZ Swing Trading
PZ TRADING SLU
5 (3)
Swing Trading é o primeiro indicador projetado para detectar oscilações na direção da tendência e possíveis oscilações de reversão. Ele usa a abordagem de negociação de linha de base, amplamente descrita na literatura de negociação. O indicador estuda vários vetores de preço e tempo para rastrear a direção da tendência agregada e detecta situações nas quais o mercado está sobrevendido ou sobrecomprado em excesso e pronto para corrigir. [ Guia de instalação | Guia de atualização | Solução de prob
O indicador " Dynamic Scalper System " foi desenvolvido para o método de scalping, operando dentro de ondas de tendência. Testado nos principais pares de moedas e ouro, é possível a compatibilidade com outros instrumentos de negociação. Fornece sinais para a abertura de posições de curto prazo ao longo da tendência, com suporte adicional para o movimento dos preços. O princípio do indicador: As setas grandes determinam a direção da tendência. Um algoritmo para gerar sinais de scalping sob a fo
The Nihilist 5.0 Indicator includes Forexalien and Nihilist Easy Trend trading strategies and systems. It is composed of an MTF Dashboard where you can analyze the different input possibilities of each strategy at a glance. It has an alert system with different types of configurable filters. You can also configure which TF you want to be notified on your Metatrader 4 platform and Mobile application The indicator has the option to view how could be a TP and SL by using ATR or fixed points, even w
Trend Lines PRO
Roman Podpora
5 (1)
LINHAS DE TENDÊNCIA PRO       Ajuda a entender onde o mercado está realmente mudando de direção. O indicador mostra inversões de tendência reais e pontos onde os principais participantes retornam ao mercado. Você vê     Linhas BOS     Análise de tendências e níveis-chave em prazos maiores — sem configurações complexas ou ruídos desnecessários. Os sinais não são repintados e permanecem no gráfico após o fechamento da barra. O que o indicador mostra: Mudanças reais  tendência (linhas BOS) Uma vez
Presenting one-of-a-kind Gann Indicator for XAUUSD IQ Gold Gann Levels is a non-repainting, precision tool designed exclusively for XAUUSD/Gold intraday trading. It uses W.D. Gann’s square root method to plot real-time support and resistance levels, helping traders spot high-probability entries with confidence and clarity. William Delbert Gann (W.D. Gann) was an exceptional market analyst whose trading technique was based on a complex blend of mathematics, geometry, astrology, and ancient calcul
Special Launch Offer: Available at a limited-time price to celebrate the new release. [Concept: Command the Market Structure] To win a war, one must see the entire battlefield, not just the skirmishes. SHOGUN Trade elevates your perspective from a reactive foot soldier to a strategic "Commander." By synchronizing analysis across 7 timeframes and identifying the maturity of trends, it allows you to govern your trades with the authority and patience of a "Shogun," entering the market only when
ACB Breakout Arrows
KEENBASE SOFTWARE SOLUTIONS
4.15 (34)
O indicador ACB Breakout Arrows fornece um sinal de entrada essencial no mercado ao detectar um padrão especial de rompimento. Ele monitora constantemente o gráfico em busca de um momento de estabilização direcional e oferece um sinal preciso pouco antes de um grande movimento.  Obtenha o scanner multissímbolo e multitemporal aqui - Scanner para ACB Breakout Arrows MT4 Principais recursos O indicador fornece níveis de Stop Loss e Take Profit. Acompanha um painel de Scanner MTF que monitora sina
Adaptive Volatility Range [AVR] is a powerful tool for identifying key trend reversal points. AVR accurately reflects the Average True Range (ATR) of volatility, taking into account the Volume-Weighted Average Price (VWAP). The indicator adapts to any market volatility by calculating the average volatility over a specific period, ensuring a stable rate of profitable trades. You receive not just an indicator but a professional automated trading system , AVR-EA . Advantages: Automated Trading Sys
Entry Points Pro
Yury Orlov
4.62 (172)
Este é um indicador para MT4 que fornece sinais precisos para entrar em uma negociação sem redesenhar. Ele pode ser aplicado a qualquer ativo financeiro: forex, criptomoedas, metais, ações, índices. Ele fornecerá estimativas bastante precisas e informará quando é melhor abrir e fechar um negócio. Assista o vídeo (6:22) com um exemplo de processamento de apenas um sinal que compensou o indicador! A maioria dos traders melhora seus resultados de negociação durante a primeira semana de negociação c
TPSproTREND PrO
Roman Podpora
4.69 (26)
TPSproTrend PRO       - Este é um indicador de tendência que analisa automaticamente o mercado e fornece informações sobre a tendência e suas mudanças, além de exibir pontos de entrada para negociações.       Sem redesenhar! ИНСТРУКЦИЯ RUS   -   INSTRUÇÕES   ENG   -   VERSÃO MT5 Funções principais: Sinais de entrada precisos       SEM PRECISAR REPINTAR! Uma vez que um sinal aparece, ele permanece válido! Esta é uma diferença significativa em relação aos indicadores de repintura, que podem forne
Hidden Cycles
Lev Vladimirovic Marushkin
5 (1)
Christmas Sale! – The Only 100% Universal Tool Grab Hidden Cycles for only $129 (regular price $179). Stop trading against nature! This is your chance to secure the only indicator rooted in the absolute laws that govern the entire universe. Most tools guess—this one reveals the truth. Offer ends soon — Buy another toy or buy the truth. Your choice... Based on Universal Laws — NOT Some Guy’s Algorithm: Let the market adjust to the Hidden Cycles Geometry — not the other way around. Most indicat
RelicusRoad Pro
Relicus LLC
4.63 (106)
Quantas vezes você comprou um indicador de negociação com ótimos back-tests, prova de desempenho em conta real com números fantásticos e estatísticas por toda parte, mas depois de usá-lo, você acabou perdendo sua conta? Você não deve confiar em um sinal por si só, você precisa saber por que ele apareceu em primeiro lugar, e é isso que o RelicusRoad Pro faz de melhor! Manual do Usuário + Estratégias + Vídeos de Treinamento + Grupo Privado com Acesso VIP + Versão Móvel Disponível Uma Nova Forma
Price Action Entry Alerts
Stephen Sanjeeve Sahayam
5 (3)
Este indicador analisa cada barra de pressão de compra ou venda e identifica 4 tipos de padrões de velas com o maior volume. Essas velas são filtradas usando vários filtros lineares para mostrar sinais de compra ou venda. Os sinais funcionam melhor, em conjunto com a direção do período de tempo mais alto e quando negociados durante as horas de alto volume. Todos os filtros são personalizáveis ​​e funcionam de forma independente. Pode visualizar sinais de uma única direção com o clique de um bot
Trend Pulse
Mohamed Hassan
4.2 (5)
Introducing Trend Pulse , a unique and robust indicator capable of detecting bullish, bearish, and even ranging trends! Trend Pulse uses a special algorithm to filter out market noise with real precision. If the current symbol is moving sideways, Trend Pulse will send you a ranging signal, letting you know that it's not a good time to enter a trade. This excellent system makes Trend Pulse  one of the best tools for traders! Why Choose Trend Pulse ? Never lags and never repaints:  Signals appea
Royal Wave Pro M4
Vahidreza Heidar Gholami
5 (3)
Royal Wave is a Trend-Power oscillator which has been programmed to locate and signal low-risk entry and exit zones. Its core algorithm statistically analyzes the market and generates trading signals for overbought, oversold and low volatile areas. By using a well-designed alerting system, this indicator makes it easier to make proper decisions regarding where to enter and where to exit trades. Features Trend-Power Algorithm Low risk Entry Zones and Exit Zones Predictions for Overbought and Over
NAM Order Blocks
NAM TECH GROUP, CORP.
3.67 (3)
Indicador de detecção de blocos de pedidos de multi-timeframe MT4. Características - Totalmente personalizável no painel de controle do gráfico, fornece interação completa. - Oculte e mostre o painel de controle onde quiser. - Detectar OBs em vários períodos de tempo. - Selecione a quantidade de OBs para exibir. - Interface de usuário de OBs diferente. - Filtros diferentes em OBs. - Alerta de proximidade OB. - Linhas ADR de alta e baixa. - Serviço de notificação (alertas de tela | not
ZhiBiJuJi MT4
Qiuyang Zheng
4 (2)
O sistema de análise de indicadores ZhiBiJuJi usa um poderoso loop interno para chamar seus próprios indicadores externos e, em seguida, chama a análise antes e depois do ciclo. O cálculo de dados deste sistema de análise de indicadores é muito complicado (chamando antes e depois do ciclo), então a histerese do sinal é reduzida, e a precisão da predição de avanço é alcançada. Este indicador pode ser usado em todos os ciclos no MT4, e é mais adequado para 15 minutos, 30 minutos, 1 hora, 4 horas.
Wave Price Channel - Sistema analítico de trading desenvolvido para a procura de impulso e correção. O indicador permite trabalhar no sentido do canal de preços, que é construído com base na volatilidade. Quando é desenhada uma seta para cima ou para baixo no canal, torna-se possível ir nesta direção; o sinal nesta direção é confirmado por um indicador de ponto que é sensível às alterações de preço. Enquanto os pontos da mesma cor continuarem, o sinal continua. Se houver uma seta, mas não houve
OrderFlow Absorption – Indicador Profissional de Delta e Sinais de Absorção para MT4 Desbloqueie o poder da verdadeira análise de fluxo de ordens com o OrderFlow Absorption – o indicador definitivo de histograma de delta e sinais de absorção para MetaTrader 4. Desenvolvido para traders que desejam enxergar o que realmente acontece por trás de cada movimento de preço, esta ferramenta revela pressões ocultas de compra/venda e eventos de absorção que movimentam o mercado. Recursos Visualização do H
Um indicador técnico que estrutura gráficos e identifica movimentos cíclicos de preços. Pode funcionar em qualquer gráfico. Vários tipos de notificações. Existem setas adicionais no próprio gráfico. Sem redesenhar a história, trabalha no fecho da vela. TF recomendado a partir de M5 e superior. Parâmetros fáceis de utilizar e configurar. Ao utilizar 2 indicadores com parâmetros diferentes, pode utilizá-los sem outros indicadores. Tem 2 parâmetros de entrada Ciclicidade e duração do sinal Estes
Mais do autor
[V 1.00] O MTF NRPA 5 Moving Average RTD foi lançado! Painel em tempo real de seta sem repintura. Se você está procurando o melhor indicador de média móvel, está na página certa. Geralmente as pessoas instalarão duas médias móveis porque a interseção das duas médias móveis (o cruzamento) determinará a direção da próxima tendência de preço. Se a média móvel rápida cruzar com a média móvel lenta e rápido > lento, a tendência é de alta. Por outro lado, se a média móvel rápida cruzar com a média
Analisar vários intervalos de tempo de um par de moedas em uma janela pode deixá-lo confuso. Para analisar vários intervalos de tempo, você precisa de indicadores confiáveis. Um deles está usando 9TF STOCH RSI. Tenho trabalhado dia e noite para criar um código simples, mas confiável, que cubra todos os nove intervalos de tempo em apenas um indicador. Vejamos algumas das vantagens deste indicador: Histograma colorido. A cor da curva em cada timeframe é diferente uma da outra. Setas indicand
Analyzing multiple time frames of a currency pair in one window can make you confused. To analyze multiple time frames, you need reliable indicators. One of them is using 9TF RSI MA . I've been working day and night to create code that is simple but reliable and covers all nine time frames in just one indicator .  Let's look at some of the advantages of this indicator: Colorful histogram . The color of the curve in each timeframe is different from one another.  Arrows indicating the crossing of
Analisar vários intervalos de tempo de um par de moedas em uma janela pode deixá-lo confuso. Para analisar vários intervalos de tempo, você precisa de indicadores confiáveis. Um deles está usando 9TF Double RSI Double MA. Tenho trabalhado dia e noite para criar um código simples, mas confiável, que cubra todos os nove intervalos de tempo em apenas um indicador. Vejamos algumas das vantagens deste indicador: RSI duplo, ou seja, RSI mais rápido e RSI mais lento. MA duplo, ou seja, MA mais rá
Analisar vários intervalos de tempo de um par de moedas em uma janela pode deixá-lo confuso. Para analisar vários intervalos de tempo, você precisa de indicadores confiáveis. Um deles está usando 9TF Double CCI Double MA. Tenho trabalhado dia e noite para criar um código simples, mas confiável, que cubra todos os nove intervalos de tempo em apenas um indicador. Vejamos algumas das vantagens deste indicador: CCI duplo, ou seja, CCI mais rápido e CCI mais lento. MA duplo, ou seja, MA mais rá
Um indicador CCI preciso está disponível. Dashboard Trend Bar Smart Level 9TF Double CCI. CCI duplo, ou seja, CCI rápido e CCI lento Por que você precisa do segundo CCI? O uso de indicadores adicionais nos convencerá mais na negociação ao vivo Curva CCI rápida 9TF Curva CCI lenta 9TF Ângulo CCI em tempo real 9TF 9TF valor CCI em tempo real Direção/fase CCI em tempo real 9TF Barra de tendência 9TF Novo algo no cálculo da barra de tendências Botão ligar / desligar. Muito útil para mostrar/oculta
Um indicador RSI preciso está disponível. Dashboard Trend Bar Smart Level 9TF Double RSI. RSI duplo, ou seja, RSI rápido e RSI lento Por que você precisa do segundo RSI? O uso de indicadores adicionais nos convencerá mais na negociação ao vivo Curva RSI rápida 9TF Curva RSI lenta de 9TF Ângulo RSI em tempo real 9TF Valor do RSI em tempo real de 9TF Direção/fase do RSI em tempo real 9TF Barra de tendência 9TF Novo algo no cálculo da barra de tendências Botão ligar / desligar. Muito útil para mo
Um indicador MACD preciso está disponível. Dashboard Trend Bar Smart Level 9TF Double MACD. MACD duplo, ou seja, rápido (MACD 1) e lento (MACD 2) Por que você precisa do segundo MACD? O uso de indicadores adicionais nos convencerá mais na negociação ao vivo 9TF Fast MACD 1 curva Curva MACD 2 lenta 9TF 9TF ângulo MACD em tempo real 9TF valor MACD em tempo real Direção MACD em tempo real 9TF Um indicador MACD preciso está disponível. Dashboard Trend Bar Smart Level 9TF Double MACD. MACD duplo,
Um indicador estocástico preciso está disponível. Dashboard Trend Bar Smart Level 9TF Dual Stochastic. Dual Stochastic, ou seja, Fast Stochastic e Slow Stochastic Por que você precisa do segundo estocástico? O uso de indicadores adicionais nos convencerá mais na negociação ao vivo Curva Estocástica Rápida 9TF Curva Estocástica Lenta 9TF 9TF ângulo estocástico em tempo real 9TF valor estocástico em tempo real 9TF direção/fase estocástica em tempo real Barra de tendência 9TF Novo algo no cálculo
Se você costuma perder negociações porque usa apenas um indicador, experimente esta ferramenta de negociação. Esta ferramenta de negociação utiliza mais de um indicador. Costumo observar traders que usam apenas o indicador RSI. Muitas vezes o mercado está sobrevendido, mas ainda em baixa, ou o mercado está sobrecomprado, mas ainda em alta. Por esse motivo, é necessário utilizar mais de um indicador. Apresentando a nova versão V 3.40 MTF PPAAF: Multi Time Frame Precise Price Action Arrow Filtere
[V 1.00] MTF NRPA 5 RSI RTD foi lançado! Painel em tempo real de seta sem repintura. Se você está cansado de usar vários indicadores RSI, mas acha que eles são imprecisos, tente esta ferramenta. Normalmente, as pessoas instalam apenas 1 RSI para determinar o nível de OBOS em um período de tempo. A má notícia é que você não pode ver os níveis e tendências do OBOS em vários períodos de tempo ao mesmo tempo. É por isso que desenvolvi esta ferramenta de negociação. Veja como é explicado: Nesta
Introducing the advanced trading tools of 2023. MTF PPAAF Model S. This is sub window version of my best trading tool : MTF Precise Price Action Arrow Filtered.  Click here to learn more about MTF PPAAF . This trading tool is equipped with various powerful features : MTF = Multi Time Frame = Time Frame can be changed. On/off button. Non Repaint Arrows.  Customizable parameter, color etc.  Can show all time frame (ATF) crossover arrows of fast stochastic main line & fast stochastic signal line (
If you are curious about the position of the stochastic, RSI, CCI curve, whether it is at the OBOS level or not, then this trading tool is for you. Introducing the advanced trading tools of 2024. ATF Trend Following Trend Bar OBOS. This indicator is similar to MTF PPAAF Model S but have two layers.  Click here to learn more about MTF PPAAFS . This trading tool is equipped with various powerful features : MTF = Multi Time Frame = Time Frame can be changed. On/off button. Customizable parameter,
Olá comerciantes. Apresentando minha melhor ferramenta de negociação. FTM PPAAF Modelo T. Multi Time Frame Seta de ação de preço precisa filtrada Modelo T.  Esta ferramenta de negociação é meu melhor trabalho depois de anos criando várias ferramentas de negociação. Por que esta ferramenta de negociação é a melhor e confiável?  1. Esta ferramenta utiliza 6 indicadores:  CCI duplo = CCI rápido x CCI lento Estocástico duplo = estocástico rápido (linha principal estocástica rápida x lin
Com esta ferramenta de negociação, você pode analisar 15 mercados simultaneamente. Apresentando o novo indicador de negociação 2024: ️ Dashboard Multi Moeda Multi Time Frame Double CCI. Há pelo menos duas razões pelas quais criei esta ferramenta de negociação: Primeiro, estou cansado de observar apenas um mercado. Segundo, não quero perder o momento de entrada em outro mercado. É por isso que quero conhecer outras condições de mercado ao mesmo tempo. Por esta razão, preciso de um scanner
Com esta ferramenta de negociação, você pode analisar 15 mercados simultaneamente. Apresentando o novo indicador de negociação 2024: ️ Dashboard Multi Moeda Multi Time Frame Double RSI. Há pelo menos duas razões pelas quais criei esta ferramenta de negociação: Primeiro, estou cansado de observar apenas um mercado. Segundo, não quero perder o momento de entrada em outro mercado. É por isso que quero conhecer outras condições de mercado ao mesmo tempo. Por esta razão, preciso de um scanner
Looking for a trading tool based on the CCI indicator that can display crossovers arrows on all time frames? Introducing trading indicator : All Time Frame Double CCI Model T ready to help you achieve daily profits. This tool is created using the intersection of two CCI (Double CCI) indicator lines: the main CCI and the signal CCI. Using this tool makes it easier to observe the real-time dashboard and intersections of multiple timeframes simultaneously. Viewing both higher and lower timeframes
Looking for a trading tool based on the CCI indicator that can display crossovers arrows on all time frames? Introducing trading indicator : All Time Frame Double CCI Model S ready to help you achieve daily profits. This tool is created using the intersection of two CCI (Double CCI) indicator lines: the main CCI and the signal CCI. Using this tool makes it easier to observe the real-time dashboard and intersections of multiple timeframes simultaneously. Viewing both higher and lower timeframes
Looking for a trading tool based on the MACD indicator that can display crossovers arrows on all time frames? Introducing trading indicator : All Time Frame MACD Model T ready to help you achieve daily profits. This tool is created using the intersection of two indicator lines of MACD : the main MACD and the signal MACD. Using this tool makes it easier to observe the real-time dashboard and intersections of multiple timeframes simultaneously. Viewing both higher and lower timeframes simultaneou
Looking for a trading tool based on the MACD indicator that can display crossovers arrows on all time frames? Introducing trading indicator : All Time Frame MACD Model S ready to help you achieve daily profits. This tool is created using the intersection of two indicator lines of MACD : the main MACD and the signal MACD. Using this tool makes it easier to observe the real-time dashboard and intersections of multiple timeframes simultaneously. Viewing both higher and lower timeframes simultaneou
Looking for a trading tool based on the Stochastic indicator that can display crossovers arrows on all time frames? Introducing trading indicator : All Time Frame Stochastic Model T ready to help you achieve daily profits. This tool is created using the intersection of two indicator lines of Stochastic  : the main Stochastic  and the signal Stochastic . Using this tool makes it easier to observe the real-time dashboard and intersections of multiple timeframes simultaneously. Viewing both higher
Looking for a trading tool based on the Stochastic indicator that can display crossovers arrows on all time frames? Introducing trading indicator : All Time Frame Stochastic Model S ready to help you achieve daily profits. This tool is created using the intersection of two indicator lines of Stochastic  : the main Stochastic and the signal Stochastic . Using this tool makes it easier to observe the real-time dashboard and intersections of multiple timeframes simultaneously. Viewing both higher
Looking for a trading tool based on the RSI indicator that can display crossovers arrows on all time frames? Introducing trading indicator : All Time Frame Double RSI Model T ready to help you achieve daily profits. This tool is created using the intersection of two RSI (Double RSI) indicator lines: the main RSI and the signal RSI. Using this tool makes it easier to observe the real-time dashboard and intersections of multiple timeframes simultaneously. Viewing both higher and lower timeframes
Looking for a trading tool based on the RSI indicator that can display crossovers arrows on all time frames? Introducing trading indicator : All Time Frame Double RSI Model S ready to help you achieve daily profits. This tool is created using the intersection of two RSI (Double RSI) indicator lines: the main RSI and the signal RSI. Using this tool makes it easier to observe the real-time dashboard and intersections of multiple timeframes simultaneously. Viewing both higher and lower timeframes
Looking for a trading tool based on the moving average indicator that can display crossovers arrows on all time frames? Introducing trading indicator : All Time Frame Two MA Model T ready to help you achieve daily profits. This tool is created using the intersection of two moving average  indicator lines: the main MA1 and the signal MA2. Using this tool makes it easier to observe the real-time dashboard and intersections of multiple timeframes simultaneously. Viewing both higher and lower timef
Looking for a trading tool based on the moving average indicator that can display crossovers arrows on all time frames? Introducing trading indicator : All Time Frame Two MA Model S ready to help you achieve daily profits. This tool is created using the intersection of two moving average indicator lines: the main MA1 and the signal MA2. Using this tool makes it easier to observe the real-time dashboard and intersections of multiple timeframes simultaneously. Viewing both higher and lower timefr
Filtro:
Sem comentários
Responder ao comentário