Dashboard Multi Currency MTF Stochastic

Avec cet outil de trading, vous pouvez analyser 15 marchés simultanément.

Présentation du nouvel indicateur de trading 2024 :

➡️ Tableau de bord multi-devises multi-périodes stochastiques.

Il y a au moins deux raisons pour lesquelles j'ai créé cet outil de trading :

Premièrement, j'en ai marre de n'observer qu'un seul marché.
Deuxièmement, je ne veux pas perdre le moment d’entrée sur un autre marché.

C'est pourquoi je souhaite connaître en même temps les autres conditions du marché.

Pour cette raison, j’ai besoin d’un scanner capable d’analyser simultanément les conditions de plusieurs marchés.

Je recherche souvent des marchés où la ligne principale stochastique > (ou <=) ligne de signal stochastique commence de M1 à H4 (ou simplement de M1 à M30).

Si vous êtes d'accord avec mon analyse, alors c'est l'indicateur de trading que vous recherchiez.

Ne manquez pas le moment où les conditions du marché répondent aux exigences ci-dessus.

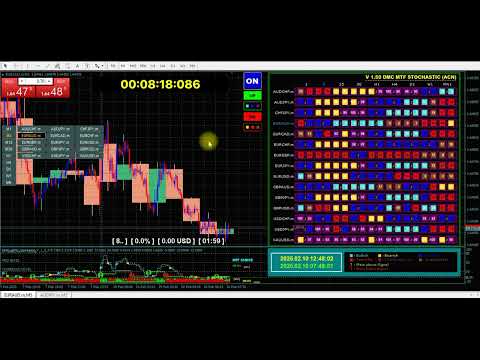
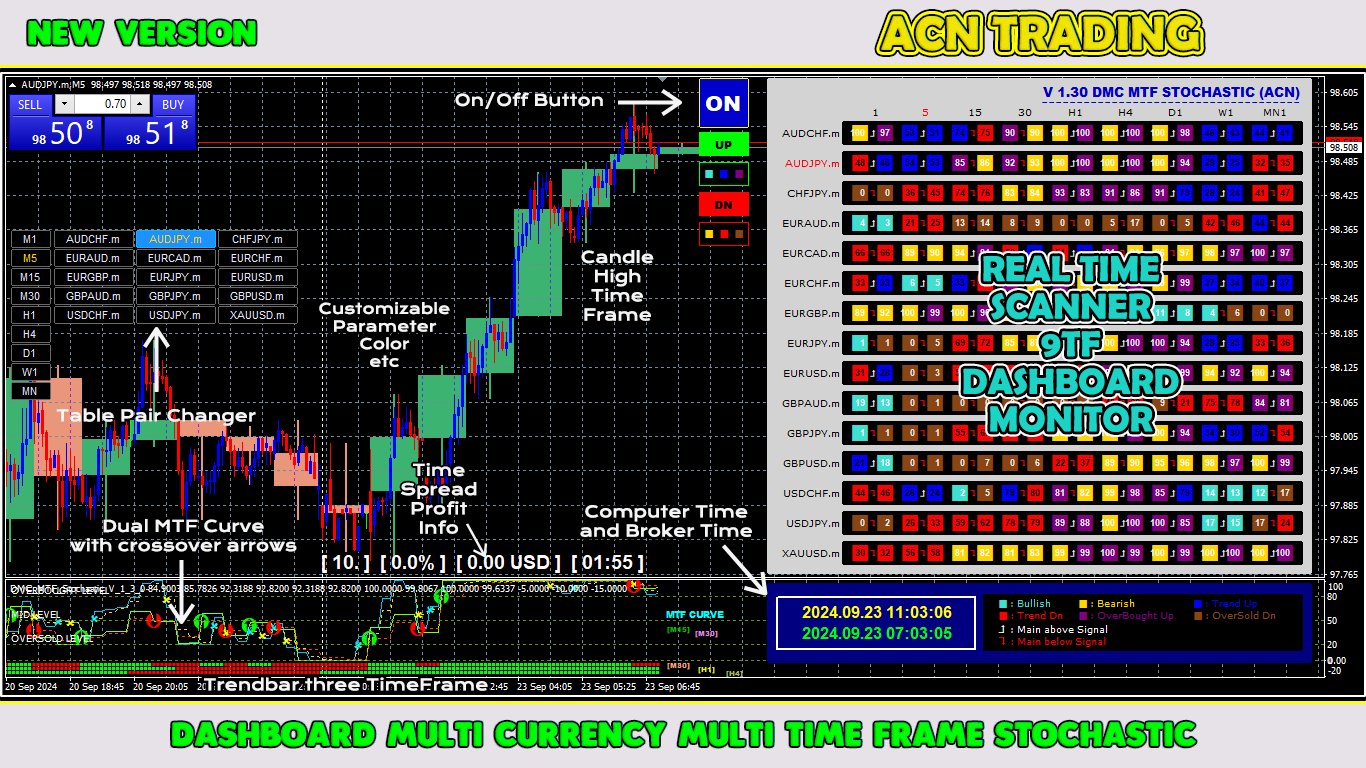
Il s'agit d'un scanner ou d'un tableau de bord stochastique avec de nombreuses fonctionnalités intéressantes :

Peut afficher les données de la ligne principale stochastique
Peut afficher les données de la ligne de signal stochastique
Peut afficher la position de la ligne principale stochastique et de la ligne de signal (ligne principale au-dessus de la ligne de signal ou ligne principale en dessous de la ligne de signal)
Peut afficher le niveau de données de la ligne principale stochastique et de la ligne de signal (haussier, baissier, tendance à la hausse, tendance à la baisse, surachat mais toujours à la hausse et survente mais toujours à la baisse)
Peut afficher des données en temps réel de M1 à MN1
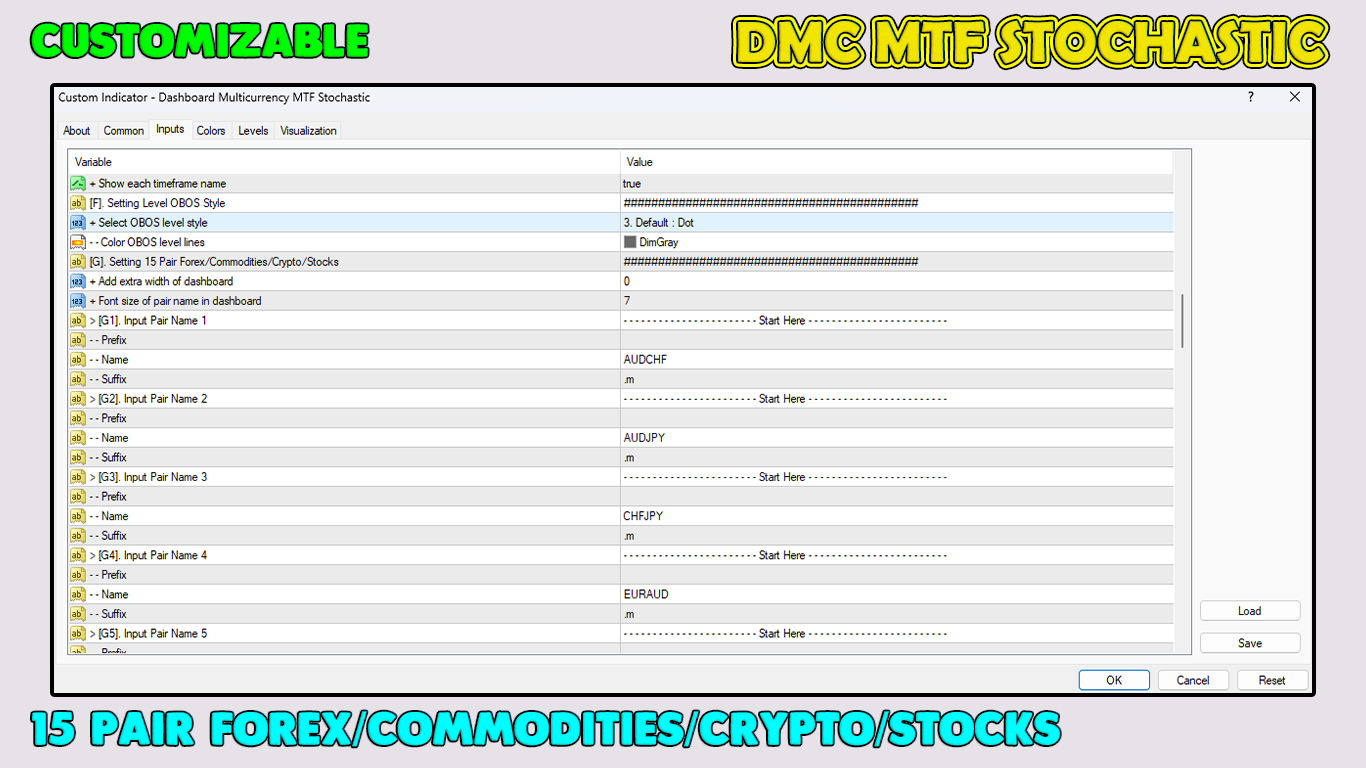
Peut afficher les données de 15 paires de devises (forex multidevises/matières premières/crypto/actions)
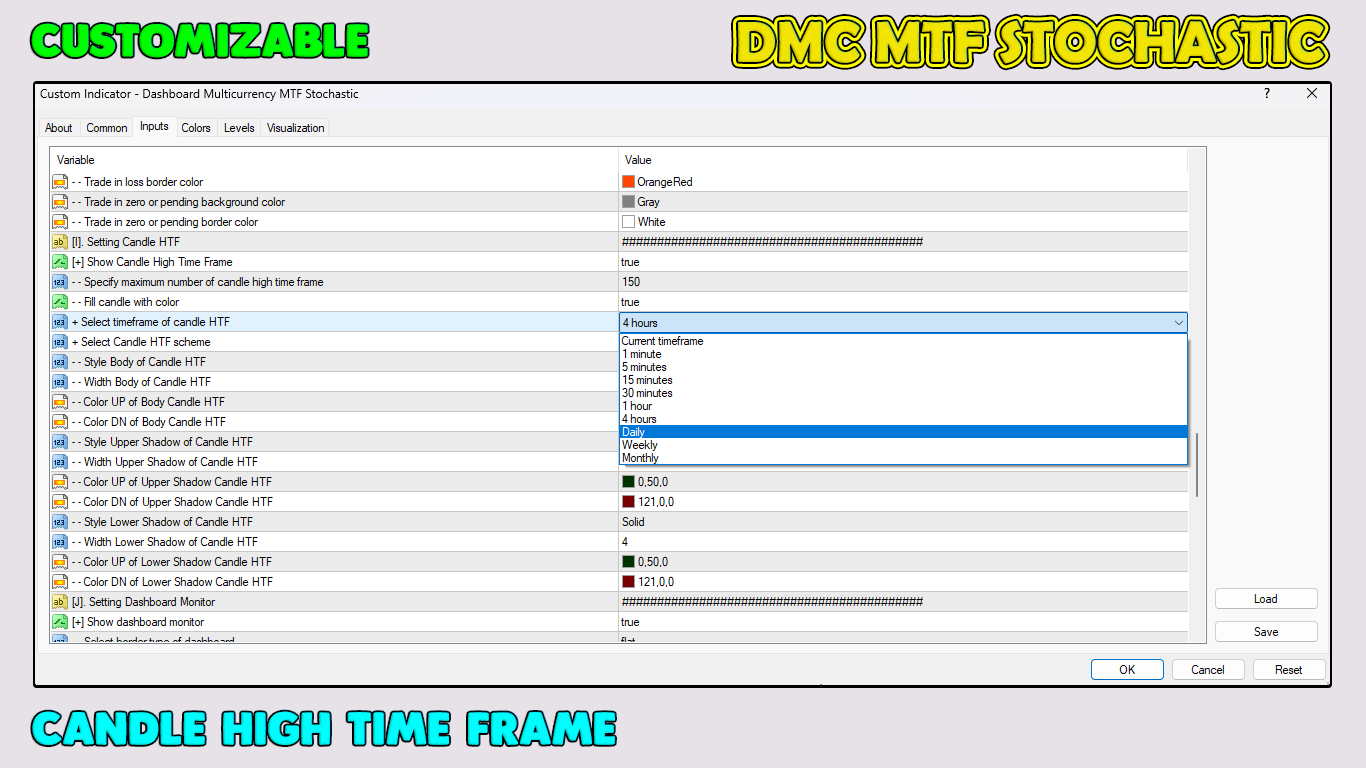
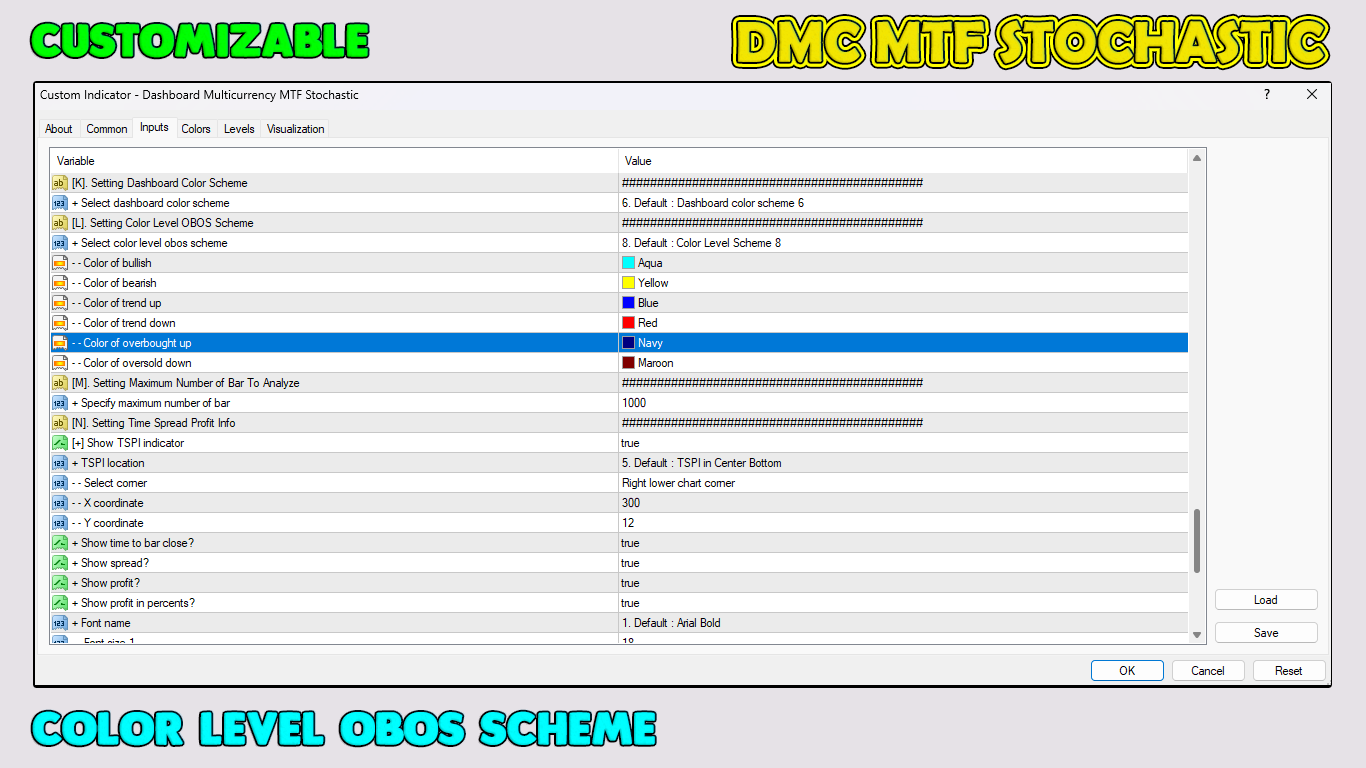
Paramètre personnalisable
Niveau OBOS de couleur personnalisable
Belle palette de 20 couleurs du tableau de bord
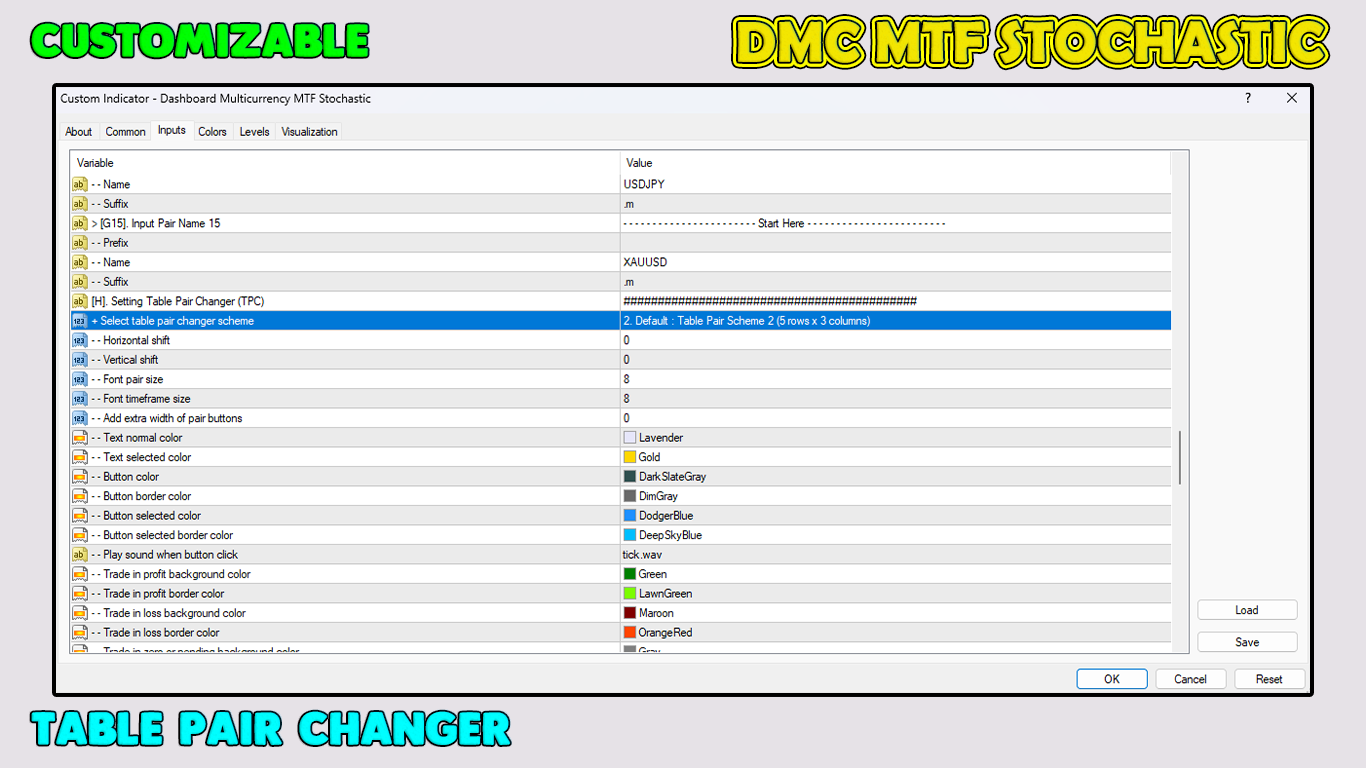
Équipé d'un changeur de paires de devises marche/arrêt
Equipé d'une bougie à délai élevé
Équipé d'informations sur les bénéfices étalés dans le temps
Equipé de l'heure actuelle de l'ordinateur local et de l'heure du courtier
Equipé d'une double courbe stochastique MTF
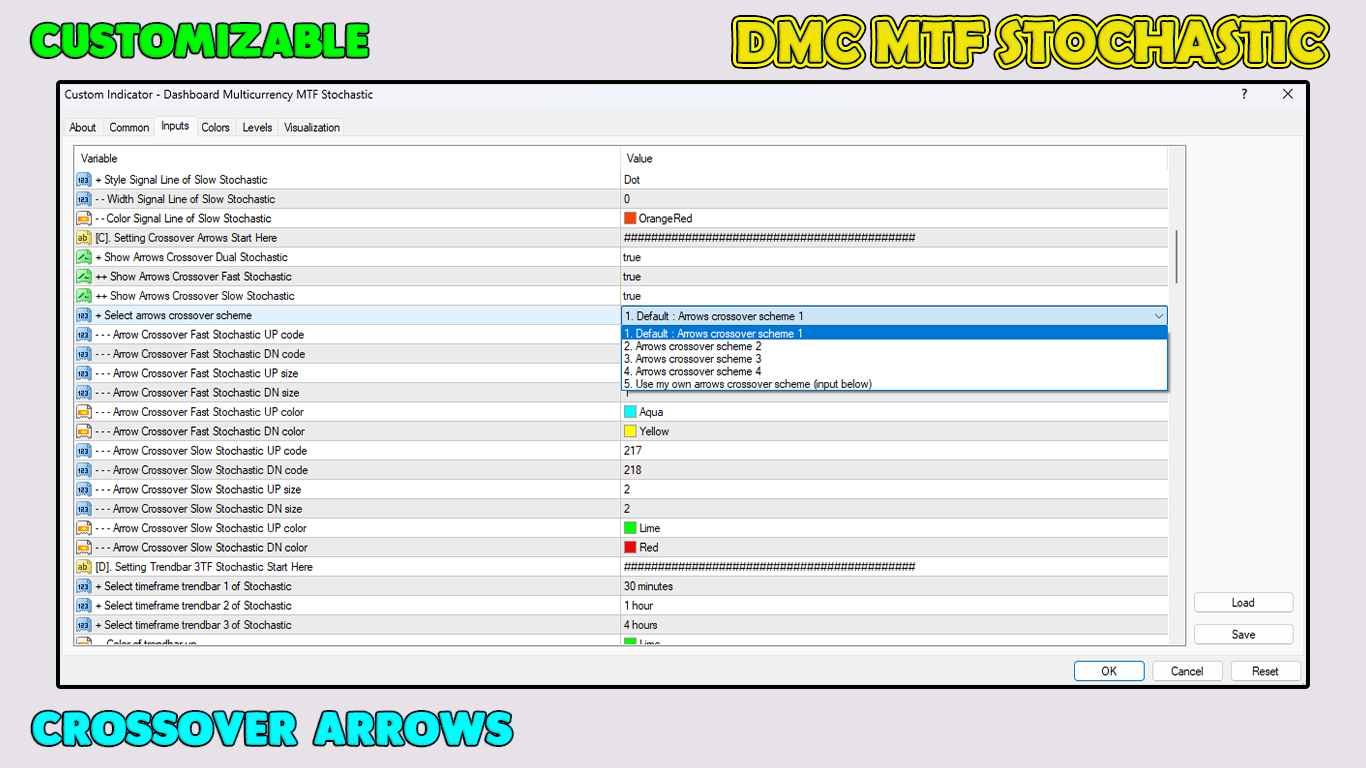
Équipé de flèches croisées de courbe stochastique double MTF
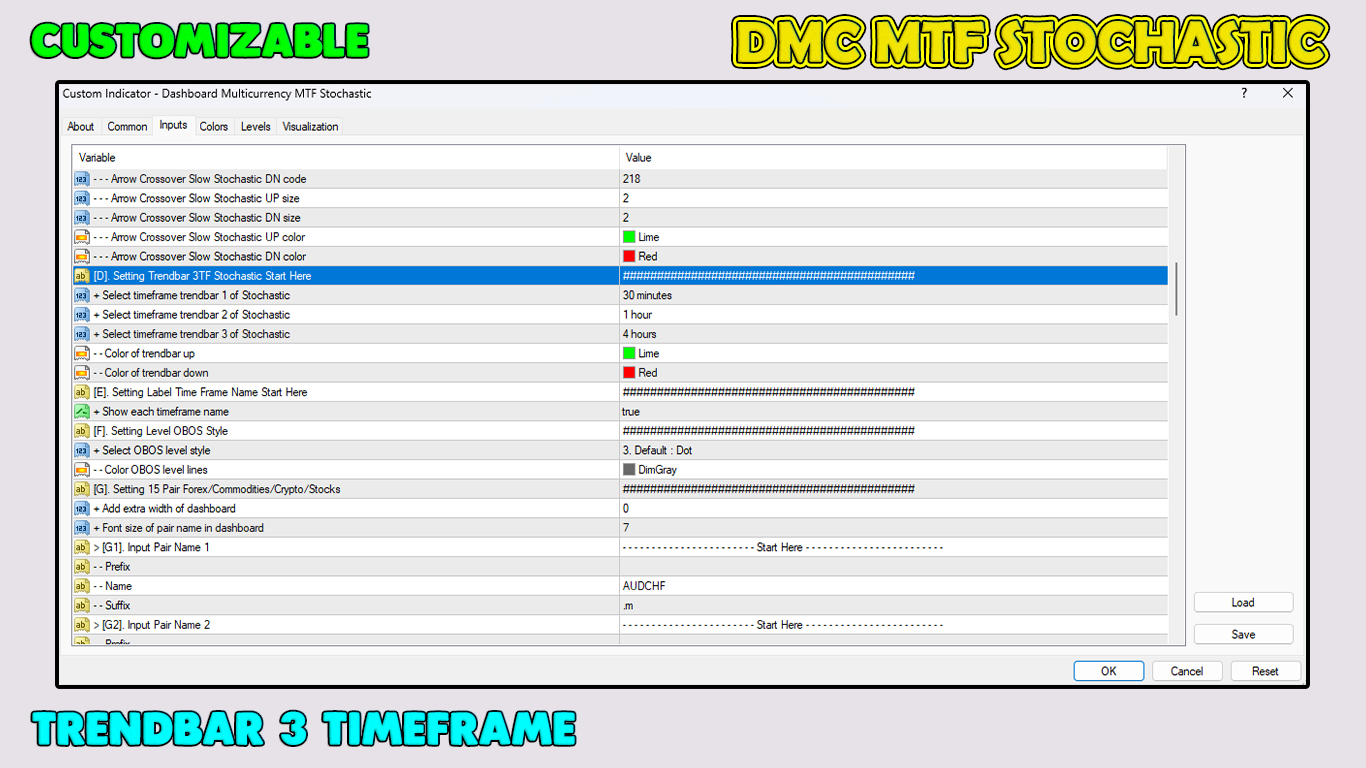
Equipé d'une barre de tendance 3TF stochastique
Cet outil de trading est absolument ce dont tout trader a besoin.

Téléchargez dès aujourd'hui.

Faites des entrées en toute confiance et négociez comme un pro !

Merci.
Produits recommandés
PTW NON REPAINT TRADING SYSTEM + HISTOGRAM Non-Repainting ,   Non-Redrawing   and   Non-Lagging  Trading System. Does the following: - Gives Accurate Entry and Exit Points - Scalping, Day and Swing Trading  - 95% Accuracy  - Targets, where to take profits. - Shows Trends, Support and resistance levels - Works on All Brokers - Works on All Currencies, CFDs and Stocks - It does not place trades for you, it only shows you what trades to place. - It works on All Timeframes - It is for Trend or ran
Fibo Reversals is an indicator which has carefully been put together to attempt to indicate a time period in which an ongoing trend is most probably exhausted and a new trend (actually a reversal trend) inadvertently begins. At this, it should be okay for the manual trader to be on the look out for good trading opportunities. Input Settings Father Fibo  – This Input Determines The Highest Price For The Chosen Input Period. Son Fibo  - This Input Determines The Lowest Price For The Chosen Input
ToolBox 360 is the swiss knife of all indicators. It is full packed with useful tools to help you with your trading. It can be used to find best entry and exit points and help you to decide if you should open a trade or not. It shows market trends, candlestick formations outside / inside bars and you can sett time based allerts. Main features: Time based Fibonacci lines Choose a start and end time and the indicator shows you Fibonacci lines within the selected time range including range high a
Dynamic SR Trend Channel Dynamic SR Trend Channel is a simple indicator for trend detection as well as resistance/support levels on the current timeframe. It shows you areas where to expect possible change in trend direction and trend continuation. It works with any trading system (both price action and other trading system that use indicators) and is also very good for renko charting system as well. In an uptrend, the red line (main line) serves as the support and the blue line serves as the r
Pyro Trend
Oleksii Ferbei
Pyro Trend is a new product that allows you to identify the current market phase (uptrend, downtrend or flat). The indicator is applicable for any data and periods. The middle of the trend wave, as well as the edges, are places of special heat and market behavior; when writing the indicator, an attempt was made to implement precisely finding the middle. Pyro Trend is a trend indicator that uses an original calculation algorithm. This indicator paints arrows in different colors depending on the
WARNING:    This indicator is powerful, very high probability, not based on publically available algorithms. It's a matrix of 10 different entries, from 10 other pairs, determined by a machine learning algorithm and wave analysis (Fourier Series) over 2 years. it can detect major buy and sell signals, as well as trendless, narrow range, hours on the 30minute and H1 chart (for scalping strategies during the usually trendless Asian session), scalping breakout risk is eliminated. It tells you if E
L'indicateur Parabolic SAR & Support/Resistance Levels n'est pas seulement un indicateur d'analyse technique, utilisé dans le trading Forex pour identifier les inversions de tendance potentielles et les points d'entrée et de sortie, mais aussi une stratégie de trading autonome prête à l'emploi. L'indicateur s'appuie sur l'indicateur PSAR en ajoutant des niveaux de support et de résistance dynamiques au graphique, ce qui peut aider les traders à identifier les niveaux de prix clés où le marché
Unlock Smarter Trading with the Bands Breakout! Are you tired of confusing charts and missed opportunities? Get clear, high-probability entry and exit signals right on your chart with the Bands Breakout  indicator! This isn't just another indicator; it's a complete, trend-aware system designed to simplify your trading decisions and focus only on the best moves. Our unique engine combines the momentum power of the EMA 10 with the volatility framework of the Bollinger Bands to find definitive buy
FREE
ROC acceleration-deceleration is the manual system for medium-term scalping. Indicator based on custom ROC system which defines bullish/bearish market and especially  acceleration-deceleration of tendention in the market's main direction. Buy arrow is plotted during bearish market when current trend decelerates and sell  arrow is plotted during bullish market when current trend decelerates. Main Indicator's Features Signals are not repaint,non-late or disappear(exept cases when system recalculat
This indicator allows you to see the strength of the trend on all timeframes. It can be used for all currency pairs. The indicator can be displayed in the form of a column (from left to right): status buy / sell / strong buy / strong sell, strength of the trend in percentage, pips last candle, body candle now, remaining time, and the timeframe of M1 to MN. Information contained below (from left to right): total trend percent, sell percent, buy percent.
Sarangani Venom
Sherwin Dennis Tava Ruiz
sarangani venom is 100% profitable, easy to use indicator, a chart without indicator is stressful and will lead you to many losses, this indicator is pleasing to the eye that will gives you more confident to trade when there is signal, your computer will gives sound and the spider will animate, it can be used to all time frame and to all currency, you have many options, when the candlestick touches to upper line it is buy, when it touches to lower line it is sell, when the rope is pull to buy ar
Global Trend
Vitalii Zakharuk
Global Trend Indicator, shows the signals for entry. Displays both entry points and the trend itself. Shows statistically calculated moments for entering the market with arrows. When using the indicator, the risk factor can be optimally distributed. Settings: Uses all one parameter for settings. Choosing a parameter, it is necessary to visually resemble it so that the appropriate graph has a projection of extremes. Parameters: Length - the number of bars for calculating the indicator. Use
Drawing Pack
John Louis Fernando Diamante
4 (1)
This indicator provides several drawing tools to assist in various methods of chart analysis. The drawings will keep their proportions (according to their handle trendline) across different chart scales, update in real time, and multiple drawings are supported. # Drawing Option Description  1 Grid box draggable boxed grid, user defines rows x colums, diagonal ray option  2 Grid partial or fullscreen grid, sized by handle line  3 Grid flex a diagonal grid, sized and sloped by handle line  4 Cyc
Colored indicator of the linear channel based on the Fibonacci sequence. It is used for making trading decisions and analyzing market sentiment. The channel boundaries represent strong support/resistance levels, as they are the Fibonacci proportion levels. Users can select the number of displayed lines of channel boundaries on the chart by means of the input parameters. Attaching multiple instances of the indicator to the chart with different calculation periods leads to displaying a system of c
CSS " currency strength slope "  is a a multi currency strength indicator that use Forex major currencies, EUR, USD, CAD, AUD, NZD, JPY, CHF, GBP. it use 28 major pairs to calculate the power of every currency using a based moving averages algorithm : you will see volatility clearly between currencies. input: MA Fast & Slow. - MA Mode : simple, exponential, smoothed, linear weighted - Applied Price : close, open, high, low, median price, typical price, weighted price.
Note : The slow loading of the indicator issue has been addressed . This new version loads fast and does not slow the platform. Version 1.3 : We have updated the indicator to include an historical bar scanning option . So instead of scanning all bars in the history (which can make the indicator slow sometimes ) , you can select the maximum number of bars it can scan which can increase the performance and make the indicator faster. This indicator scans the 1-3 Trendline pattern . The indicato
L'indicateur de moyenne mobile R Var est un indicateur de suivi de tendance conçu pour les suiveurs de tendance inconditionnels. Il s'agit d'un indicateur de trading forex très populaire parmi les négociants en actions, ainsi que les négociants en matières premières, et sa popularité découle de sa capacité à fournir de véritables signaux de création d'argent à ses utilisateurs. L'indicateur est composé de points verts et rouges placés sur une ligne de terre de sienne. Le point vert pointe ver
FREE
Using multiple timeframes for analysis with Multi Timeframe Average Directional Index  can provide several significant benefits for traders: Comprehensive Market View: By applying Mtf ADX Standard across different timeframes, traders gain a broader perspective on market dynamics. This allows them to identify trends, patterns, and potential reversal points that might be more apparent or consistent across various scales. Enhanced Pattern Recognition: Multiple timeframes help in identifying repeati
FREE
Indicateur Crypto_Forex « Modèles Marteau et Pendu » pour MT4, sans modification, sans délai. - L'indicateur « Marteau et Pendu » est un indicateur très performant pour le trading Price Action. - L'indicateur détecte les modèles Marteau haussier et Pendu baissier sur le graphique : - Modèle Marteau haussier : signal de flèche bleue sur le graphique (voir images). - Modèle Pendu baissier : signal de flèche rouge sur le graphique (voir images). - Alertes PC, mobile et e-mail. - L'indicateur « Ma
Moving Pivot Average    The pivot indicator compares the selected period with its counterpart from the previous period. The indicator uses very flexible algorithm for pivot value calculating. It allows you to allocate in days a certain time intervals (custom bars) and calculate the average pivot value based on High, Low and Close prices of these bars. How many custom bars will be taken into account is determined by the "Days" setting. The pivot line can be considered an average trend line and us
Master Max
Abdulkarim Karazon
MASTER MA est un indicateur basé sur le croisement des moyennes mobiles, utilisant 3 moyennes mobiles avec des périodes différentes pour générer des signaux, la stratégie est très simple, mais l’indicateur a un tableau de bord de statistiques qui montre des résultats de test de retour instantanés utiles tels que le taux de victoire/les bénéfices totaux gagnés... etc., cet indicateur a des entrées TP et SL en points afin que vous puissiez avoir votre TP et SL souhaités visibles sur le graphique
Niubility Trend  Niubility Trend displays the trend direction for all time frames in real time. You'll see at a glance at which direction the trends are running, how long they last and how powerful they are. All this makes it an easy-to-use trend trading system for beginners, advanced and professional traders. Features Easy to trade Customizable colors and sizes It is non-repainting and non-backpainting It is fantastic as a trailing stop method It implements alerts of all kinds
Atomic CHOCH BOS Trend Indicator v1.4 TRADING AUTOMATION EXPERTS - MT4 tools designed to enhance trader performance. Master the Smart Money Strategy with Precision _____________________________________________________________________________________________________________________________________________________________________________ Smart Market Structure Analysis Unlock the power of smart market structure analysis with the Atomic Break of Structure Change of Character (CHOCH) / Break of Str
Trade Stats
Johannes Schoeman
Does your trading consist of Multiple EA's, Multiple time frames an no clear indication of how each individual strategy or time frame is performing, then this indicator will help. Assign the EA Magic number to this indicator and track it's performance on the chart by selecting on chart the period, today, week, month year or all history to view. Easy visual colour changing header to display the performance of the EA for the respective periods.    Minimize the panel to reduce chart clutter. Add yo
Introduction to Fractal Pattern Scanner Fractal Indicator refers to the technical indicator that makes use of the fractal geometry found in the financial market. Fractal Pattern Scanner is the advanced Fractal Indicator that brings the latest trading technology after the extensive research and development work in the fractal geometry in the financial market. The most important feature in Fractal Pattern Scanner is the ability to measure the turning point probability as well as the trend probabi
The trader uses the Trend for Neuro indicator to determine the market situation. This is a trending algorithm that is convenient to download, install and use. The algorithm with acceptable accuracy generates input signals and output levels. Strategy for trend trading, filtering and all the necessary functions built into one tool! By launching the indicator, the user will see only two types of arrows that can change color to blue during an uptrend, to red during a downtrend there is no uncertaint
FVG - Fair Value Gap The FVG - Fair Value Gap is an advanced MQL4 indicator designed for traders who utilize institutional order flow and Smart Money Concepts to identify market inefficiencies. This indicator automatically detects and highlights Fair Value Gaps (FVGs) on your chart, providing a clear visual representation of potential support and resistance zones, reversal points, and high-probability trading setups. Key Features: Automated FVG Detection: The indicator automatically identifies
Trend Colored Average
Teresinha Moraes Correia
Using colors that reflect the prevailing market direction, the indicator is designed to show when the current trend is still dominant. This helps to filter out potential market noise and guides the trader to avoid false signals. By clearly visualizing trend strength and consistency, the tool assists in identifying higher-probability trade setups. It enhances precision by allowing traders to focus on movements that align with the broader market context. As a result, decision-making becomes more
First Dawn
Innovicient Limited
The First Dawn indicator uses a unique mechanism to search and plot signals. This keeps searching for signals, making it a great indicator for scaping and identification of changes in direction, swing trading and trend trading. The  First Dawn   helps you get early signals. The backtest gives the true picture of how the indicator works with real/demo accounts. Although this is a tiny indicator it is packed with advantageous settings that will help you whether you desire to: Snap the Peaks and
Cet indicateur est un indicateur d'analyse automatique des vagues, parfait pour le trading pratique ! Cas... Remarque :   je n'ai pas l'habitude d'utiliser des noms occidentaux pour l'évaluation des vagues. En raison de l'influence de la convention de dénomination de Tang Lun (Tang Zhong Shuo Zen), j'ai nommé la vague de base comme   un stylo   et la bande d'onde secondaire comme   un segment   . en même temps, le segment a la direction de la tendance.Le   segment de tendance principal   est no
Les acheteurs de ce produit ont également acheté
Indicateur Miraculous – Outil Forex et Binaire 100% Non-Repaint Basé sur le Carré de Neuf de Gann Cette vidéo présente l' Indicateur Miraculous , un outil de trading très précis et puissant, spécifiquement développé pour les traders du Forex et des Options Binaires . Ce qui rend cet indicateur unique est sa fondation sur le légendaire Carré de Neuf de Gann et la Loi de Vibration de Gann , en faisant l'un des outils de prévision les plus précis disponibles dans le trading moderne. L'Indicateur Mi
Découvrez l'Indicateur d'Avion F-16, un outil de pointe pour MT4 conçu pour révolutionner votre expérience de trading. Inspiré par la vitesse et la précision inégalées de l'avion de chasse F-16, cet indicateur combine des algorithmes avancés et une technologie de pointe pour offrir des performances inégalées sur les marchés financiers. Avec l'Indicateur d'Avion F-16, vous surplomberez la concurrence car il fournit une analyse en temps réel et génère des signaux de trading hautement précis. Ses f
Scalper Inside PRO
Alexey Minkov
4.74 (69)
An exclusive indicator that utilizes an innovative algorithm to swiftly and accurately determine the market trend. The indicator automatically calculates opening, closing, and profit levels, providing detailed trading statistics. With these features, you can choose the most appropriate trading instrument for the current market conditions. Additionally, you can easily integrate your own arrow indicators into Scalper Inside Pro to quickly evaluate their statistics and profitability. Scalper Inside
Actuellement 20% de réduction ! La meilleure solution pour tout débutant ou trader expert ! Ce logiciel de tableau de bord fonctionne sur 28 paires de devises. Il est basé sur 2 de nos principaux indicateurs (Advanced Currency Strength 28 et Advanced Currency Impulse). Il donne un excellent aperçu de l'ensemble du marché Forex. Il montre les valeurs de l'Advanced Currency Strength, la vitesse de mouvement des devises et les signaux pour 28 paires de devises dans tous les (9) délais. Imaginez
Dynamic Forex28 Navigator
Bernhard Schweigert
4.43 (7)
Dynamic Forex28 Navigator - L'outil de trading Forex de nouvelle génération. ACTUELLEMENT 49 % DE RÉDUCTION. Dynamic Forex28 Navigator est l'évolution de nos indicateurs populaires de longue date, combinant la puissance de trois en un : Advanced Currency Strength28 Indicator (695 avis) + Advanced Currency IMPULSE avec ALERT (520 avis) + CS28 Combo Signals (Bonus). Détails sur l'indicateur https://www.mql5.com/en/blogs/post/758844 Qu'offre l'indicateur de force de nouvelle génération ? Tout
Volatility Trend System - un système de trading qui donne des signaux pour les entrées. Le système de volatilité donne des signaux linéaires et ponctuels dans le sens de la tendance, ainsi que des signaux pour en sortir, sans redessiner ni retarder. L'indicateur de tendance surveille la direction de la tendance à moyen terme, montre la direction et son changement. L'indicateur de signal est basé sur les changements de volatilité et montre les entrées sur le marché. L'indicateur est équipé de pl
GOLD Impulse with Alert
Bernhard Schweigert
4.64 (11)
Cet indicateur est une super combinaison de nos 2 produits Advanced Currency IMPULSE with ALERT  +   Currency Strength Exotics . Il fonctionne pour tous les cadres temporels et montre graphiquement l'impulsion de force ou de faiblesse pour les 8 principales devises plus un symbole ! Cet indicateur est spécialisé pour montrer l'accélération de la force des devises pour tout symbole comme l'or, les paires exotiques, les matières premières, les indices ou les contrats à terme. C'est le premier
Trend Lines PRO
Roman Podpora
5 (1)
TREND LINES PRO     Cet indicateur permet de comprendre les véritables changements de direction du marché. Il révèle les renversements de tendance et les points de retour des principaux acteurs. Tu vois     Lignes BOS     Détection des changements de tendance et des niveaux clés sur des unités de temps supérieures, sans paramètres complexes ni interférences inutiles. Les signaux restent affichés sur le graphique même après la fermeture de la bougie. Ce que l'indicateur montre : De véritables ch
Entry Points Pro
Yury Orlov
4.62 (172)
Indicateur supérieur pour MT4 fournissant des signaux précis pour entrer dans un trade sans repeindre ! Il peut être appliqué à tous les actifs financiers : forex, cryptocurrencies, métaux, actions, indices.  La version MT5 est ici Il fournira des signaux de trading assez précis et vous dira quand il est préférable d'ouvrir un trade et de le fermer. Regardez la vidéo (6:22) avec un exemple de traitement d'un seul signal qui a rapporté à l'indicateur ! La plupart des traders améliorent leurs
Adaptive Volatility Range [AVR] is a powerful tool for identifying key trend reversal points. AVR accurately reflects the Average True Range (ATR) of volatility, taking into account the Volume-Weighted Average Price (VWAP). The indicator adapts to any market volatility by calculating the average volatility over a specific period, ensuring a stable rate of profitable trades. You receive not just an indicator but a professional automated trading system , AVR-EA . Advantages: Automated Trading Sys
Hidden Cycles
Lev Vladimirovic Marushkin
5 (1)
Christmas Sale! – The Only 100% Universal Tool Grab Hidden Cycles for only $129 (regular price $179). Stop trading against nature! This is your chance to secure the only indicator rooted in the absolute laws that govern the entire universe. Most tools guess—this one reveals the truth. Offer ends soon — Buy another toy or buy the truth. Your choice... Based on Universal Laws — NOT Some Guy’s Algorithm: Let the market adjust to the Hidden Cycles Geometry — not the other way around. Most indicat
Indicateur à l'avance   Elle détermine les niveaux et les zones de retournement du marché , vous permettant d'attendre que le prix revienne au niveau et d'entrer au début d'une nouvelle tendance, et non à sa fin. Il montre   niveaux d'inversion   lorsque le marché confirme un changement de direction et amorce un mouvement plus marqué. L'indicateur fonctionne sans redessinage, est optimisé pour tous les instruments et révèle tout son potentiel lorsqu'il est associé à   TREND LINES PRO   indicat
Currency Strength Exotics
Bernhard Schweigert
4.88 (33)
ACTUELLEMENT 20% DE RÉDUCTION ! La meilleure solution pour tout débutant ou trader expert ! Cet indicateur est spécialisé pour montrer la force de la devise pour tous les symboles comme les paires exotiques, les matières premières, les indices ou les contrats à terme. C'est le premier de son genre, n'importe quel symbole peut être ajouté à la 9ème ligne pour montrer la force réelle de la devise de l'or, l'argent, le pétrole, DAX, US30, MXN, TRY, CNH etc. Il s'agit d'un outil de trading unique
The principle of this indicator is very simple: detecting the trend with Moving Average, then monitoring the return point of graph by using the crossing of Stochastic Oscillator and finally predicting BUY and SELL signal with arrows, alerts and notifications. The parameters are fixed and automatically calculated on each time frame. Example: If you install indicator on EURUSD, timeframe M5: the indicator will detect the main trend with the Moving Average on this timeframe (for example the Moving
Cycle Sniper
Elmira Memish
4.39 (36)
Please contact us after your purchase and we will send you the complimentary indicators to complete the system Cycle Sniper is not a holy grail but when you use it in a system which is explained in the videos, you will feel the difference. If you are not willing to focus on the charts designed with Cycle Sniper and other free tools we provide, we recommend not buying this indicator. We recommend watching the videos about the indiactor and system before purchasing. Videos, settings  and descri
Shogun Trade
Yuki Miyake
5 (1)
SHOGUN Trade [Launch Special] "Special Price" Available Now! To celebrate our major update, we are running a Limited Time Sale . This is your only chance to acquire this ultimate weapon at the lowest possible price. Secure this opportunity before the price returns to normal. ~ "Full Automation" of Chart Monitoring. Conquer the Entire Market with One Tool. ~ Are you still exhausting yourself staring at charts? "Waiting for a chance" is no longer a job for humans. Switching back and forth bet
Supply and Demand Dashboard PRO
Bernhard Schweigert
4.8 (20)
Actuellement 20% de réduction ! Ce tableau de bord est un logiciel très puissant qui fonctionne sur plusieurs symboles et jusqu'à 9 horizons temporels. Il est basé sur notre indicateur principal (Best reviews : Advanced Supply Demand ).   Le tableau de bord donne une excellente vue d'ensemble. Il montre :  Les valeurs d'offre et de demande filtrées, y compris l'évaluation de la force de la zone, Les distances en pips vers/et dans les zones, Il met en évidence les zones imbriquées, Il donne 4
Meravith
Ivan Stefanov
5 (1)
L'indicateur analyse le volume à partir de chaque point et calcule les niveaux d'épuisement du marché pour ce volume. Il se compose de trois lignes : Ligne d'épuisement du volume haussier Ligne d'épuisement du volume baissier Une ligne indiquant la tendance du marché. Cette ligne change de couleur pour refléter si le marché est haussier ou baissier. Vous pouvez analyser le marché à partir de n'importe quel point de départ que vous choisissez. Une fois qu'une ligne d'épuisement du volume est atte
Présentation       Quantum Trend Sniper Indicator   , l'indicateur révolutionnaire MQL5 qui transforme la façon dont vous identifiez et négociez les inversions de tendance ! Développé par une équipe de traders expérimentés avec une expérience commerciale de plus de 13 ans,       Indicateur Quantum Trend Sniper       est conçu pour propulser votre parcours de trading vers de nouveaux sommets grâce à sa manière innovante d'identifier les inversions de tendance avec une précision extrêmement élevée
Quantum Breakout Indicator PRO
Bogdan Ion Puscasu
4.96 (26)
Présentation       Quantum Breakout PRO   , l'indicateur révolutionnaire MQL5 qui transforme la façon dont vous négociez les zones d'évasion ! Développé par une équipe de traders expérimentés avec une expérience de trading de plus de 13 ans,   Quantum Breakout PRO   est conçu pour propulser votre parcours de trading vers de nouveaux sommets grâce à sa stratégie de zone de discussion innovante et dynamique. Quantum Breakout Indicator vous donnera des flèches de signalisation sur les zones d'év
Signal GoldRush Trend Arrow L'indicateur GoldRush Trend Arrow Signal fournit une analyse précise et en temps réel des tendances, spécialement conçue pour les scalpers à haute vitesse et à court terme sur la paire XAU/USD. Conçu spécialement pour les intervalles de temps d'une minute, cet outil affiche des flèches directionnelles indiquant clairement les points d'entrée, ce qui permet aux scalpers de naviguer en toute confiance dans des conditions de marché volatiles. L'indicateur se compose
Presenting one-of-a-kind Gann Indicator for XAUUSD IQ Gold Gann Levels is a non-repainting, precision tool designed exclusively for XAUUSD/Gold intraday trading. It uses W.D. Gann’s square root method to plot real-time support and resistance levels, helping traders spot high-probability entries with confidence and clarity. William Delbert Gann (W.D. Gann) was an exceptional market analyst whose trading technique was based on a complex blend of mathematics, geometry, astrology, and ancient calcul
ACTUELLEMENT 26% DE RÉDUCTION ! !! Cet indicateur est une super combinaison de nos deux indicateurs principaux ( Advanced Currency Strength 28   &  Advanced Currency IMPULSE with ALERT ). Il montre les valeurs de force de la devise pour les TICK-UNITS et les signaux d'alerte pour 28 paires Forex. 11 unités de tic-tac différentes peuvent être utilisées. Ce sont 1, 2, 3, 4, 5, 6, 10, 12, 15, 20 et 30 secondes. La barre de Tick-Unit dans la sous-fenêtre sera affichée et déplacée vers la gauche lo
DÉTECTEUR DE CHOCS DE LIQUIDITÉ (XAUUSD, ÉDITION 1 MINUTE) ==================================================== DESCRIPTION SOMMAIRE : ----------------------------------- Détecte les zones de liquidité institutionnelle créées par des mouvements de prix soudains et fournit une analyse de tendance multi-échelle. DESCRIPTION COMPLÈTE : ----------------- Le Détecteur de Chocs de Liquidité identifie les mouvements de prix significatifs qui indiquent souvent une activité institutionnelle. Lorsqu
MBS Trend Flow
Aliaksandr Alferchyk
TREND FLOW PRO TREND FLOW PRO est un indicateur sans repaint qui affiche la direction du marché. Il identifie les retournements de tendance ainsi que les entrées initiales et répétées des principaux participants du marché. Les marques BOS sur le graphique représentent de véritables changements de tendance et des niveaux clés des unités de temps supérieures. Les données ne sont pas repeintes et restent sur le graphique après la clôture de chaque bougie. Demandez et recevez un guide PDF détaillé a
POWR Rise Coming
Trade Indicators LLC
This indicator is SO SIMPLE… when the green Rise Coming arrow appears, a price drop may be on the way! Plain and easy profits! As you receive more than one 'Rise Coming' text signal in a downtrend, it means momentum is building larger for a bull run. HOW TO USE 1. When the green "Rise Coming" text appears, a price jump may be on the way! This indicator Never Repaints! To get the best setting it's a matter of tweaking the indicator until it gives you the best results. Our recommendation, and what
Unlock hidden profits: accurate divergence trading for all markets Tricky to find and scarce in frequency, divergences are one of the most reliable trading scenarios. This indicator finds and scans for regular and hidden divergences automatically using your favourite oscillator. [ Installation Guide | Update Guide | Troubleshooting | FAQ | All Products ] Easy to trade Finds regular and hidden divergences Supports many well known oscillators Implements trading signals based on breakouts Display
Indicateur unique qui met en œuvre une approche professionnelle et quantitative pour signifier le trading de réversion. Il capitalise sur le fait que le prix dévie et revient à la moyenne de manière prévisible et mesurable, ce qui permet des règles d'entrée et de sortie claires qui surpassent largement les stratégies de trading non quantitatives. [ Installation Guide | Update Guide | Troubleshooting | FAQ | All Products ] Des signaux de trading clairs Étonnamment facile à échanger Couleurs et t
Price Action Entry Alerts
Stephen Sanjeeve Sahayam
5 (3)
Cet indicateur examine chaque barre pour la pression d'achat ou de vente et identifie 4 types de modèles de bougies avec le volume le plus élevé. Ces bougies sont ensuite filtrées à l'aide de plusieurs filtres linéaires pour afficher les signaux d'achat ou de vente. Les signaux fonctionnent mieux, en conjonction avec une direction temporelle plus élevée et lorsqu'ils sont négociés pendant les heures de volume élevé. Tous les filtres sont personnalisables et fonctionnent indépendamment. Peut aff
TPSproTREND PrO
Roman Podpora
4.69 (26)
TPSproTrend PRO       - Il s'agit d'un indicateur de tendance qui analyse automatiquement le marché et fournit des informations sur la tendance et ses évolutions, ainsi que des points d'entrée pour les transactions.       sans redessiner ! ИНСТРУКЦИЯ RUS   -   INSTRUCTIONS   FRA   -   VERSION MT5 Fonctions principales : Signaux d'entrée précis       SANS REPEINTURE ! Une fois qu'un signal apparaît, il reste valide ! C'est une différence majeure par rapport aux indicateurs qui se repeignent et p
Plus de l'auteur
[V 1.00] MTF NRPA 5 Moving Average RTD est sorti ! Tableau de bord en temps réel avec flèche non repeinte. Si vous recherchez le meilleur indicateur de moyenne mobile, vous êtes sur la bonne page. Généralement, les gens installeront deux moyennes mobiles car l'intersection des deux moyennes mobiles (le croisement) déterminera la direction de la prochaine tendance des prix. Si la moyenne mobile rapide croise la moyenne mobile lente et rapide> lente, la tendance est à la hausse. Inversement, si
L'analyse de plusieurs périodes d'une paire de devises dans une seule fenêtre peut vous rendre confus. Pour analyser plusieurs échelles de temps, vous avez besoin d'indicateurs fiables. L'un d'eux utilise 9TF STOCH RSI. J'ai travaillé jour et nuit pour créer un code simple mais fiable et couvrant les neuf périodes de temps dans un seul indicateur. Regardons quelques-uns des avantages de cet indicateur : Histogramme coloré. La couleur de la courbe dans chaque période est différente l'une de
Analyzing multiple time frames of a currency pair in one window can make you confused. To analyze multiple time frames, you need reliable indicators. One of them is using 9TF RSI MA . I've been working day and night to create code that is simple but reliable and covers all nine time frames in just one indicator .  Let's look at some of the advantages of this indicator: Colorful histogram . The color of the curve in each timeframe is different from one another.  Arrows indicating the crossing of
L'analyse de plusieurs périodes d'une paire de devises dans une seule fenêtre peut vous rendre confus. Pour analyser plusieurs échelles de temps, vous avez besoin d'indicateurs fiables. L'un d'eux utilise 9TF Double RSI Double MA. J'ai travaillé jour et nuit pour créer un code simple mais fiable et couvrant les neuf périodes de temps dans un seul indicateur. Regardons quelques-uns des avantages de cet indicateur : Double RSI, c'est-à-dire RSI plus rapide et RSI plus lent. Double MA, c'est-
L'analyse de plusieurs périodes d'une paire de devises dans une seule fenêtre peut vous rendre confus. Pour analyser plusieurs échelles de temps, vous avez besoin d'indicateurs fiables. L'un d'eux utilise 9TF Double CCI Double MA. J'ai travaillé jour et nuit pour créer un code simple mais fiable et couvrant les neuf périodes de temps dans un seul indicateur. Regardons quelques-uns des avantages de cet indicateur : Double CCI, c'est-à-dire CCI plus rapide et CCI plus lent. Double MA, c'est-
Un indicateur CCI précis est disponible. Tableau de bord Trend Bar Smart Level 9TF Double CCI. Double CCI, c'est-à-dire Fast CCI & Slow CCI Pourquoi avez-vous besoin d'une deuxième CCI ? L'utilisation d'indicateurs supplémentaires nous convaincra davantage dans le trading en direct Courbe CCI rapide 9TF 9TF Courbe CCI lente Angle CCI en temps réel 9TF Valeur CCI en temps réel 9TF Direction/phase CCI en temps réel 9TF Barre de tendance 9TF Nouvel algo dans le calcul de la barre de tendance Bout
Un indicateur RSI précis est disponible. Dashboard Trend Bar Smart Level 9TF double rsi. Double RSI, c'est-à-dire RSI rapide et RSI lent Pourquoi avez-vous besoin du deuxième RSI? L'utilisation d'indicateurs supplémentaires nous convaincra davantage dans le trading en direct Courbe RSI 9TF Fast Courbe RSI lent 9tf Angle RSI en temps réel 9TF 9tf Valeur RSI en temps réel 9tf Direction / phase RSI en temps réel Barre de tendance 9tf Nouvel algo dans le calcul de la barre de tendance Bouton ON /
Un indicateur MACD précis est disponible. Barre de tendance du tableau de bord Smart Level 9TF Double MACD. Double MACD, c'est-à-dire rapide (MACD 1) et lent (MACD 2) Pourquoi avez-vous besoin d'un deuxième MACD ? L'utilisation d'indicateurs supplémentaires nous convaincra davantage dans le trading en direct Courbe MACD 1 rapide 9TF Courbe MACD 2 lente 9TF Angle MACD en temps réel 9TF Valeur MACD en temps réel 9TF Direction MACD en temps réel 9TF Un indicateur MACD précis est disponible. Barr
Un indicateur stochastique précis est disponible. Barre de tendance du tableau de bord Smart Level 9TF Dual Stochastic. Stochastique double, c'est-à-dire stochastique rapide et stochastique lent Pourquoi avez-vous besoin d'un deuxième stochastique ? L'utilisation d'indicateurs supplémentaires nous convaincra davantage dans le trading en direct Courbe stochastique rapide 9TF 9TF Courbe stochastique lente Angle stochastique en temps réel 9TF 9TF valeur stochastique en temps réel Direction/phase
Si vous perdez souvent des transactions parce que vous n'utilisez qu'un seul indicateur, essayez cet outil de trading. Cet outil de trading utilise plus d'un indicateur. J'observe souvent des traders qui utilisent uniquement l'indicateur RSI. Très souvent, le marché est survendu mais toujours en baisse ou le marché est suracheté mais toujours en hausse. Pour cette raison, vous devez utiliser plusieurs indicateurs. Présentation de la nouvelle version V 3.40 MTF PPAAF : Flèche d'action précise su
[V 1.00] MTF NRPA 5 RSI RTD est sorti ! Tableau de bord en temps réel avec flèche non repeinte. Si vous en avez assez d'utiliser divers indicateurs RSI mais que vous constatez qu'ils sont inexacts, essayez cet outil. Habituellement, les gens n'installent qu'un seul RSI pour déterminer le niveau d'OBOS dans un laps de temps. La mauvaise nouvelle est que vous ne pouvez pas voir les niveaux et les tendances OBOS sur différentes périodes à la fois. C'est pourquoi j'ai développé cet outil de tradi
Introducing the advanced trading tools of 2023. MTF PPAAF Model S. This is sub window version of my best trading tool : MTF Precise Price Action Arrow Filtered.  Click here to learn more about MTF PPAAF . This trading tool is equipped with various powerful features : MTF = Multi Time Frame = Time Frame can be changed. On/off button. Non Repaint Arrows.  Customizable parameter, color etc.  Can show all time frame (ATF) crossover arrows of fast stochastic main line & fast stochastic signal line (
If you are curious about the position of the stochastic, RSI, CCI curve, whether it is at the OBOS level or not, then this trading tool is for you. Introducing the advanced trading tools of 2024. ATF Trend Following Trend Bar OBOS. This indicator is similar to MTF PPAAF Model S but have two layers.  Click here to learn more about MTF PPAAFS . This trading tool is equipped with various powerful features : MTF = Multi Time Frame = Time Frame can be changed. On/off button. Customizable parameter,
Bonjour les commerçants. Présentation de mon meilleur outil de trading. FIM PPAAF Modèle T. Flèche d'action de prix précise sur plusieurs délais filtrée Modèle T.  Cet outil de trading est mon meilleur travail après des années de création de divers outils de trading. Pourquoi cet outil de trading est-il le meilleur et le plus fiable ?  1. Cet outil utilise 6 indicateurs :  Double CCI = CCI rapide x CCI lent Double stochastique = stochastique rapide (ligne principale stochastique rap
Avec cet outil de trading, vous pouvez analyser 15 marchés simultanément. Présentation du nouvel indicateur de trading 2024 : ️ Tableau de bord multi-devises multi-périodes Double CCI. Il y a au moins deux raisons pour lesquelles j'ai créé cet outil de trading : Premièrement, j'en ai marre de n'observer qu'un seul marché. Deuxièmement, je ne veux pas perdre le moment d’entrée sur un autre marché. C'est pourquoi je souhaite connaître en même temps les autres conditions du marché. Pour cet
Avec cet outil de trading, vous pouvez analyser 15 marchés simultanément. Présentation du nouvel indicateur de trading 2024 : ️ Tableau de bord multi-devises multi-périodes Double RSI. Il y a au moins deux raisons pour lesquelles j'ai créé cet outil de trading : Premièrement, j'en ai marre de n'observer qu'un seul marché. Deuxièmement, je ne veux pas perdre le moment d’entrée sur un autre marché. C'est pourquoi je souhaite connaître en même temps les autres conditions du marché. Pour cet
Looking for a trading tool based on the CCI indicator that can display crossovers arrows on all time frames? Introducing trading indicator : All Time Frame Double CCI Model T ready to help you achieve daily profits. This tool is created using the intersection of two CCI (Double CCI) indicator lines: the main CCI and the signal CCI. Using this tool makes it easier to observe the real-time dashboard and intersections of multiple timeframes simultaneously. Viewing both higher and lower timeframes
Looking for a trading tool based on the CCI indicator that can display crossovers arrows on all time frames? Introducing trading indicator : All Time Frame Double CCI Model S ready to help you achieve daily profits. This tool is created using the intersection of two CCI (Double CCI) indicator lines: the main CCI and the signal CCI. Using this tool makes it easier to observe the real-time dashboard and intersections of multiple timeframes simultaneously. Viewing both higher and lower timeframes
Looking for a trading tool based on the MACD indicator that can display crossovers arrows on all time frames? Introducing trading indicator : All Time Frame MACD Model T ready to help you achieve daily profits. This tool is created using the intersection of two indicator lines of MACD : the main MACD and the signal MACD. Using this tool makes it easier to observe the real-time dashboard and intersections of multiple timeframes simultaneously. Viewing both higher and lower timeframes simultaneou
Looking for a trading tool based on the MACD indicator that can display crossovers arrows on all time frames? Introducing trading indicator : All Time Frame MACD Model S ready to help you achieve daily profits. This tool is created using the intersection of two indicator lines of MACD : the main MACD and the signal MACD. Using this tool makes it easier to observe the real-time dashboard and intersections of multiple timeframes simultaneously. Viewing both higher and lower timeframes simultaneou
Looking for a trading tool based on the Stochastic indicator that can display crossovers arrows on all time frames? Introducing trading indicator : All Time Frame Stochastic Model T ready to help you achieve daily profits. This tool is created using the intersection of two indicator lines of Stochastic  : the main Stochastic  and the signal Stochastic . Using this tool makes it easier to observe the real-time dashboard and intersections of multiple timeframes simultaneously. Viewing both higher
Looking for a trading tool based on the Stochastic indicator that can display crossovers arrows on all time frames? Introducing trading indicator : All Time Frame Stochastic Model S ready to help you achieve daily profits. This tool is created using the intersection of two indicator lines of Stochastic  : the main Stochastic and the signal Stochastic . Using this tool makes it easier to observe the real-time dashboard and intersections of multiple timeframes simultaneously. Viewing both higher
Looking for a trading tool based on the RSI indicator that can display crossovers arrows on all time frames? Introducing trading indicator : All Time Frame Double RSI Model T ready to help you achieve daily profits. This tool is created using the intersection of two RSI (Double RSI) indicator lines: the main RSI and the signal RSI. Using this tool makes it easier to observe the real-time dashboard and intersections of multiple timeframes simultaneously. Viewing both higher and lower timeframes
Looking for a trading tool based on the RSI indicator that can display crossovers arrows on all time frames? Introducing trading indicator : All Time Frame Double RSI Model S ready to help you achieve daily profits. This tool is created using the intersection of two RSI (Double RSI) indicator lines: the main RSI and the signal RSI. Using this tool makes it easier to observe the real-time dashboard and intersections of multiple timeframes simultaneously. Viewing both higher and lower timeframes
Looking for a trading tool based on the moving average indicator that can display crossovers arrows on all time frames? Introducing trading indicator : All Time Frame Two MA Model T ready to help you achieve daily profits. This tool is created using the intersection of two moving average  indicator lines: the main MA1 and the signal MA2. Using this tool makes it easier to observe the real-time dashboard and intersections of multiple timeframes simultaneously. Viewing both higher and lower timef
Looking for a trading tool based on the moving average indicator that can display crossovers arrows on all time frames? Introducing trading indicator : All Time Frame Two MA Model S ready to help you achieve daily profits. This tool is created using the intersection of two moving average indicator lines: the main MA1 and the signal MA2. Using this tool makes it easier to observe the real-time dashboard and intersections of multiple timeframes simultaneously. Viewing both higher and lower timefr
Filtrer:
Aucun avis
Répondre à l'avis