Dashboard Multi Currency MTF Stochastic
- インディケータ
- バージョン: 1.50
- アップデート済み: 6 2月 2025
- アクティベーション: 20

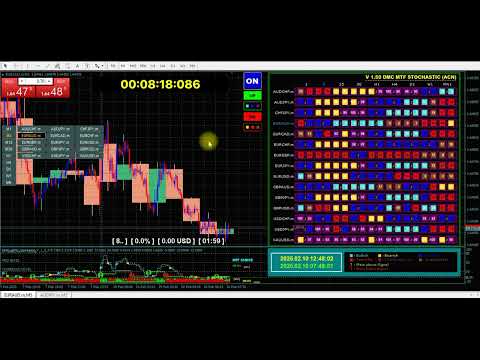
この取引ツールを使用すると、15 の市場を同時にスキャンできます。
新しい取引指標 2024 のご紹介:
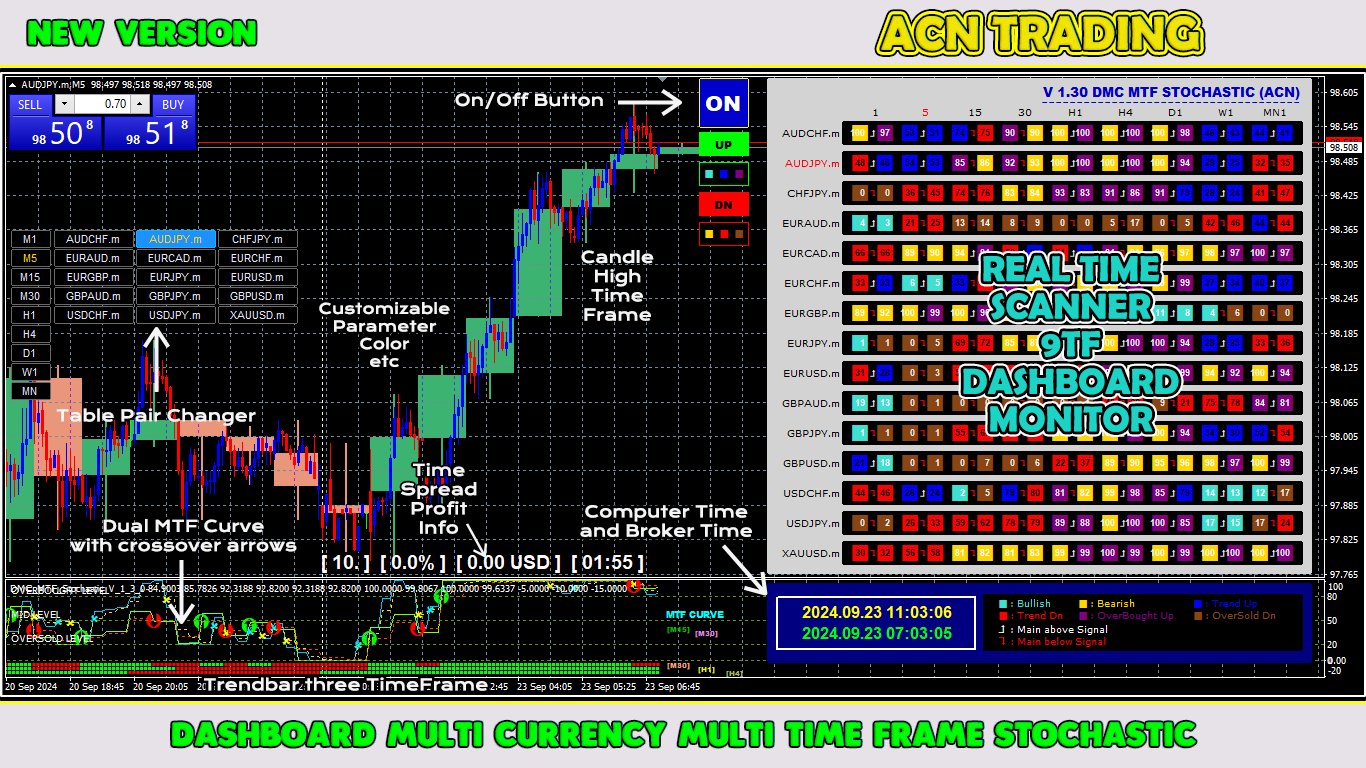
➡️ ダッシュボード マルチ通貨 マルチタイムフレーム 確率的。
私がこの取引ツールを作成した理由は少なくとも 2 つあります。
まず、1 つの市場だけを観察することに飽きました。
次に、別の市場への参入の瞬間を逃したくないです。
だからこそ、他の市況も同時に知りたいのです。
このため、複数の市場の状況を同時にスキャンできるスキャナーが必要です。
私は確率的メインライン > (または <=) 確率的シグナルラインが M1 から H4 (または単に M1 から M30) で始まる市場をよく探します。
私の分析に同意するなら、これがあなたが探していた取引指標です。
市況が上記の要件を満たす瞬間を見逃さないでください。
これは、多くの優れた機能を備えたストキャスティックのスキャナーまたはダッシュボードです。
確率的メインラインのデータを表示可能
確率シグナルラインのデータを表示可能
確率的メインラインとシグナルラインの位置を表示可能(シグナルラインの上のメインラインまたはシグナルラインの下のメインライン)
確率的なメインラインとシグナルラインの両方のデータレベルを表示できます(強気、弱気、上昇トレンド、下降トレンド、買われすぎだが依然として上昇、売られすぎだがまだ下落)
M1からMN1までのリアルタイムデータを表示可能
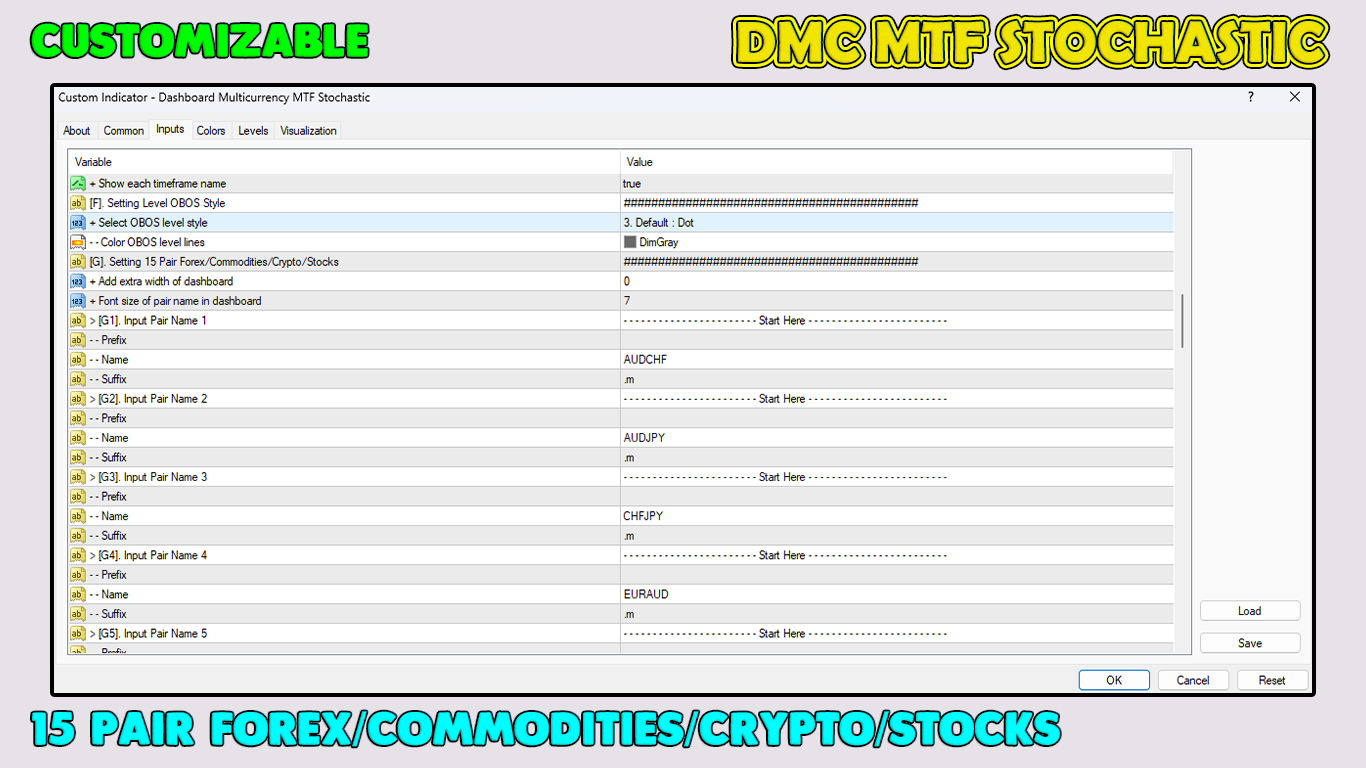
15通貨ペア(多通貨FX/商品/仮想通貨/株式)のデータを表示可能
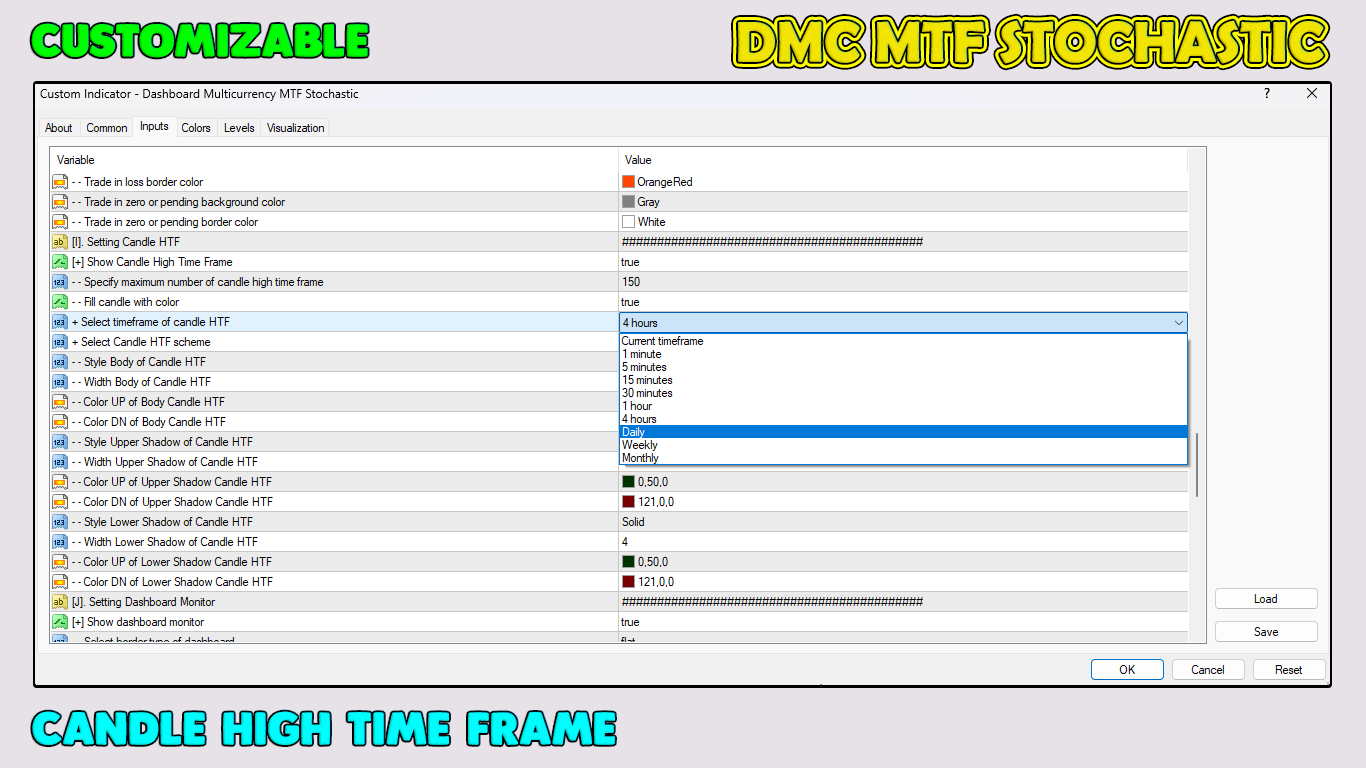
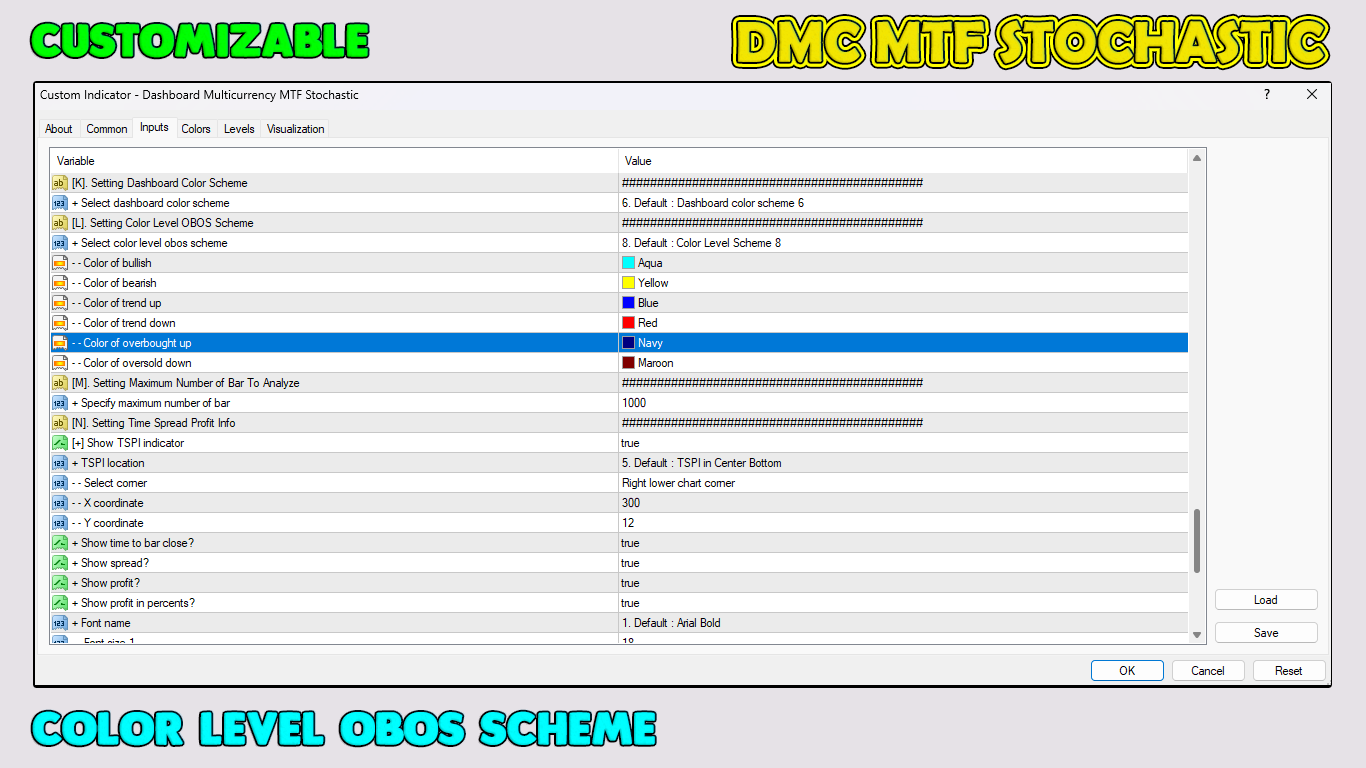
カスタマイズ可能なパラメータ
カスタマイズ可能なカラーOBOSレベル
美しい 20 ダッシュボードの配色
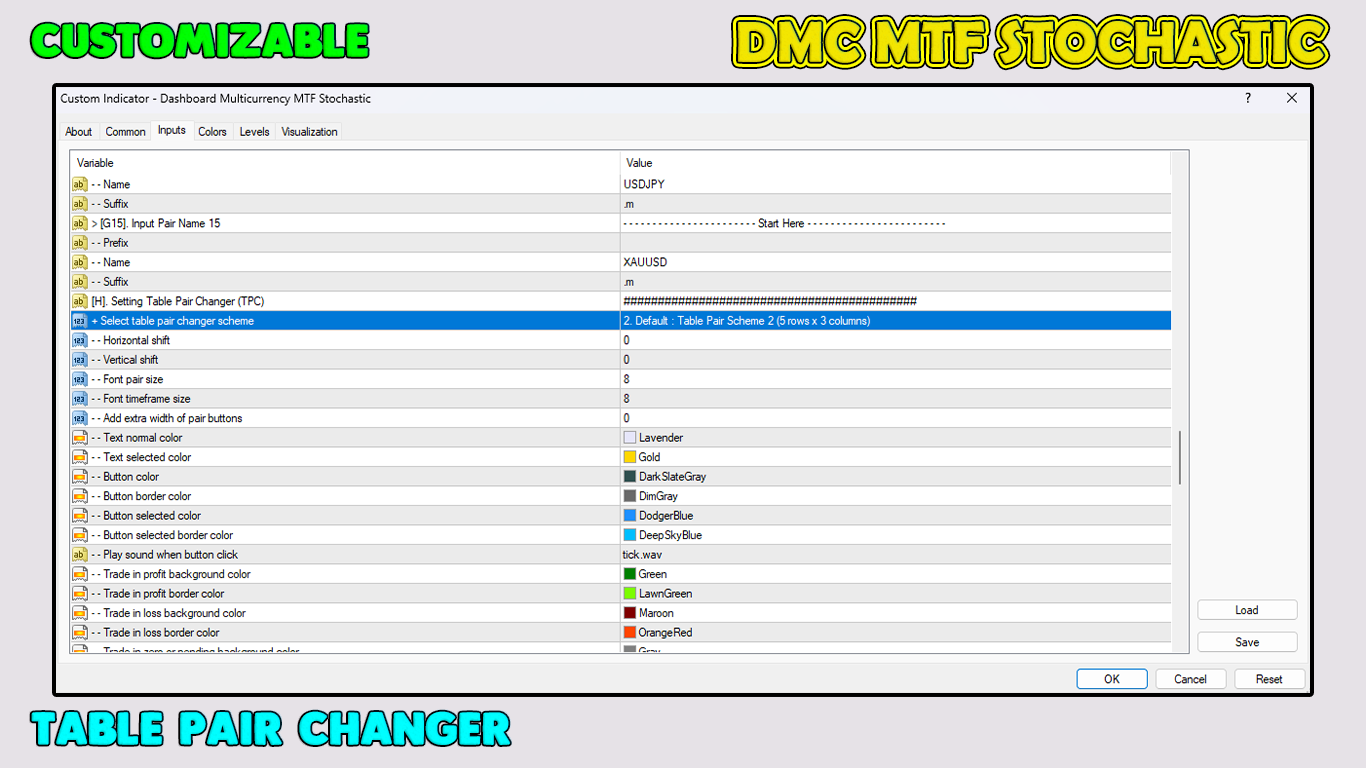
オン/オフ通貨ペアチェンジャーを搭載
ローソク足のハイタイムフレームを搭載
時間差利益情報を搭載
現在のローカルコンピュータ時間とブローカー時間を装備
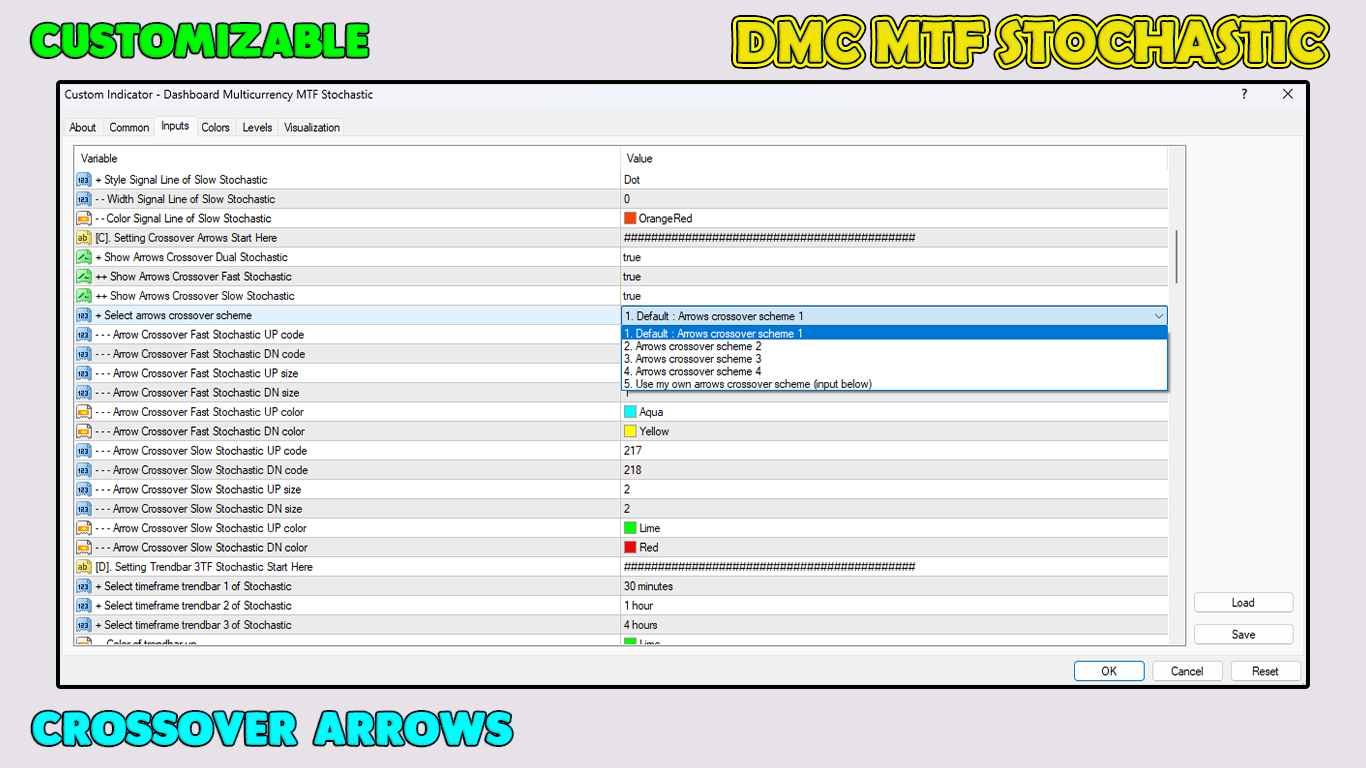
デュアルMTF確率曲線を搭載
デュアルMTF確率曲線のクロスオーバーアローを搭載
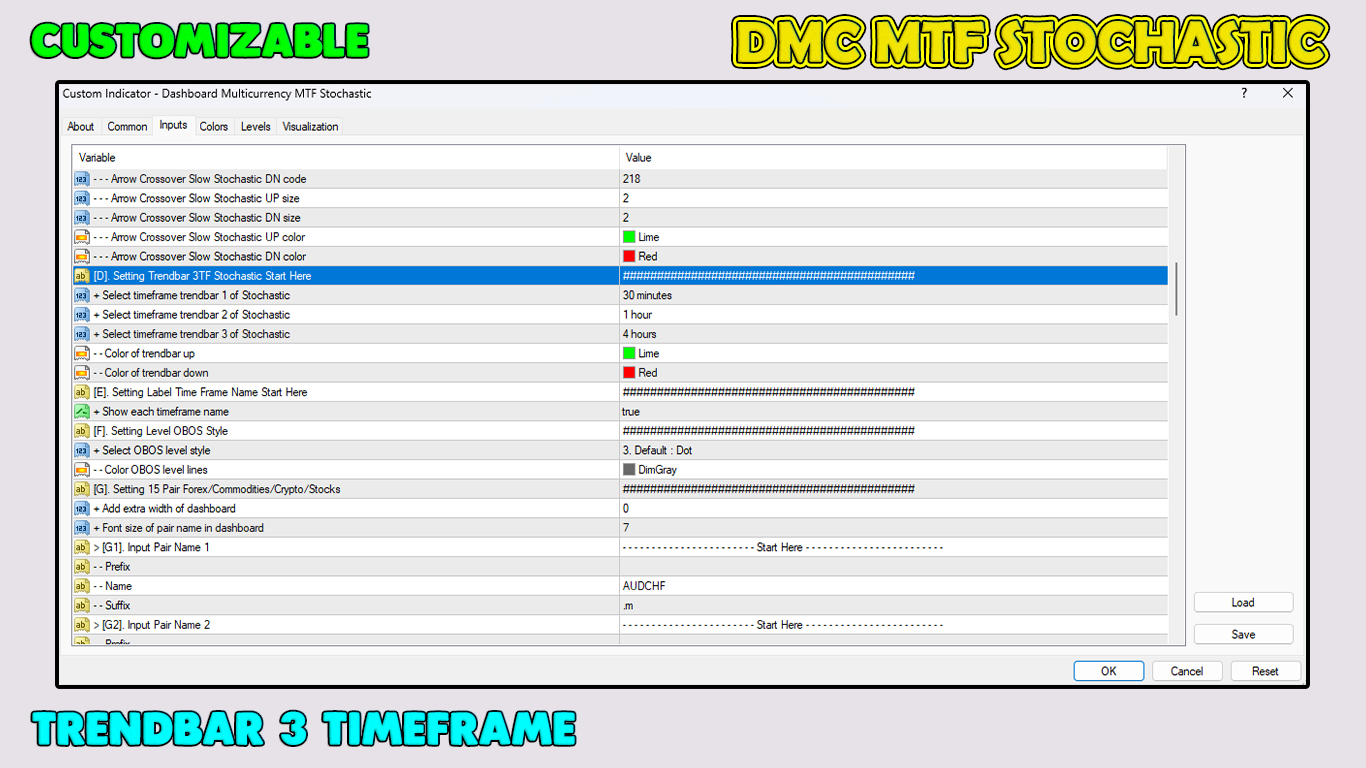
トレンドバー3TFストキャスティクスを搭載
この取引ツールは、すべてのトレーダーが絶対に必要とするものです。
今すぐダウンロードしてください。
自信を持ってエントリーして、プロのように取引しましょう!
ありがとう。