Regardez les tutoriels vidéo de Market sur YouTube
Comment acheter un robot de trading ou un indicateur
Exécutez votre EA sur
hébergement virtuel
hébergement virtuel
Test un indicateur/robot de trading avant d'acheter
Vous voulez gagner de l'argent sur Market ?
Comment présenter un produit pour qu'il se vende bien
Indicateurs techniques pour MetaTrader 4 - 4

The Fair Value Gap (FVG) is a price range where one side of the market liquidity is offered, typically confirmed by a liquidity void on the lower time frame charts in the same price range. Price can "gap" to create a literal vacuum in trading, resulting in an actual price gap. Fair Value Gaps are most commonly used by price action traders to identify inefficiencies or imbalances in the market, indicating that buying and selling are not equal. If you're following the ICT Trading Strategy or Smart
FREE
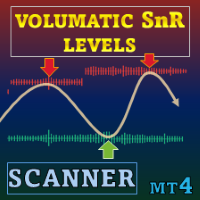
Offre spéciale : ALL TOOLS , seulement $35 chacun ! Nouveaux outils à $30 pendant la première semaine ou les 3 premiers achats ! Trading Tools Channel on MQL5 : Rejoignez mon canal MQL5 pour recevoir les dernières nouvelles Volumatic Support/Resistance Levels Scanner est un indicateur de support/résistance qui ajoute un contexte de volume à la structure des prix. En montrant comment l’activité de trading se concentre autour des pivots récents, il aide les utilisateurs à voir où
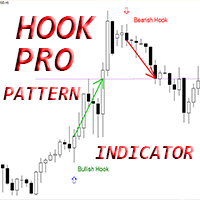
Indicateur Crypto_Forex « Hook Pro pattern » pour MT4, sans refonte, sans délai.
- L'indicateur « Hook Pro pattern » est très performant pour le trading Price Action. - L'indicateur détecte les hooks haussiers et baissiers sur le graphique : - Hook haussier : signal de flèche bleue sur le graphique (voir images). - Hook baissier : signal de flèche rouge sur le graphique (voir images). - Alertes PC, mobile et e-mail. - L'indicateur « Hook Pro pattern » est idéal pour combiner avec les niveaux d

Adaptive Volatility Range [AVR] is a powerful tool for identifying key trend reversal points. AVR accurately reflects the Average True Range (ATR) of volatility, taking into account the Volume-Weighted Average Price (VWAP). The indicator adapts to any market volatility by calculating the average volatility over a specific period, ensuring a stable rate of profitable trades. You receive not just an indicator but a professional automated trading system , AVR-EA . Advantages: Automated Trading Sys

Notre indicateur Basic Candlestick Patterns rend l'identification des principaux modèles de chandeliers plus facile que jamais. Découvrez des figures telles que le marteau, l'étoile du soir, les trois soldats blancs et bien d'autres encore en jetant un simple coup d'œil à votre graphique. Avec une interface intuitive et des indices visuels clairs, notre indicateur vous aide à identifier les opportunités de trading rapidement et avec précision / Version MT5
Dashboard Scanner pour cet indicateur
FREE

Cet indicateur identifie les modèles harmoniques les plus populaires qui prédisent les points d'inversion du marché. Ces modèles harmoniques sont des formations de prix qui se répètent constamment sur le marché des changes et suggèrent des mouvements de prix futurs possibles / Version MT5 gratuite
En outre, cet indicateur dispose d'un signal d'entrée sur le marché intégré, ainsi que de différents take profits et stop losses. Il convient de noter que, bien que l'indicateur de configuration harm
FREE
FX Dynamic : Suivez la volatilité et les tendances grâce à une analyse ATR personnalisable Vue d’ensemble
FX Dynamic est un outil performant s’appuyant sur les calculs de l’Average True Range (ATR) pour fournir aux traders des informations incomparables sur la volatilité quotidienne et intrajournalière. En définissant des seuils de volatilité clairs — par exemple 80 %, 100 % et 130 % — vous pouvez rapidement repérer des opportunités de profit ou recevoir des avertissements lorsque le marché dé
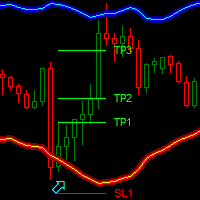
Dark Bands is an Indicator for intraday trading. This Indicator is based on Counter Trend strategy but use also Volatility. We can enter in good price with this Indicator, in order to follow the inversions on the current instrument.
Key benefits
Easily visible take profit/stop loss lines Reliable bands lines with futuristic colors, and Intuitive directional arrows Useful statistics , which indicate the win rate of the signals Plus Package available, leave a feedback to receive
FREE
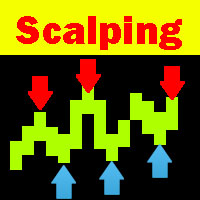
Scalping Explorer is a complete trading system. Our traders have tested and optimized its work for maximum effect. Trading with Scalping Explorer is easy. Open in Metatrader4 windows with currency pairs: EURUSD, GBPJPY, GBPUSD, AUDUSD, USDCHF. We include D1 timeframe on all currency pairs. Add the Scalping Explorer indicator to each window with a currency pair. In the indicator settings, we find the "Signal" parameter and set it to TRUE. Now, as soon as a signal appears on any of the currency p
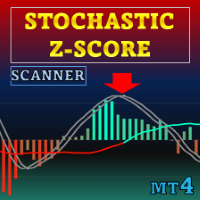
Offre spéciale : TOUS LES OUTILS , seulement 35 $ chacun ! Les nouveaux outils seront à 30 $ pendant la première semaine ou pour les 3 premiers achats ! Chaîne Trading Tools sur MQL5 : rejoignez ma chaîne MQL5 pour recevoir mes dernières actualités Stochastic Z-Score est un oscillateur de momentum qui normalise le prix avec un Z-Score, le borne via une logique stochastique et le lisse avec HMA, tandis que ALMA apporte un contexte long terme. Éléments optionnels : histogramme, band
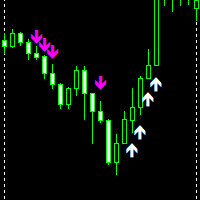
Up down Non-repaint is an MT4 indicator made to give accurate signals without disappearing. Magenta/Pink Arrow is your sell signal. white Arrow is your buy signal. indicator works on all pairs and timeframes 1 minute to Monthly timeframe. indicator is made for scalping do not hold trades for too long once arrows show the same direction you can add more entries all the best.!!
FREE

Découvrez l'Indicateur d'Avion F-16, un outil de pointe pour MT4 conçu pour révolutionner votre expérience de trading. Inspiré par la vitesse et la précision inégalées de l'avion de chasse F-16, cet indicateur combine des algorithmes avancés et une technologie de pointe pour offrir des performances inégalées sur les marchés financiers. Avec l'Indicateur d'Avion F-16, vous surplomberez la concurrence car il fournit une analyse en temps réel et génère des signaux de trading hautement précis. Ses f

L'indicateur affiche le profil de volume horizontal dans la zone spécifiée (BOX) et le volume maximum (POC).
Caractéristiques du produit. 1. Vous pouvez utiliser des ticks ou simplement le prix. 2. Espacement de grille adaptatif (M1-MN). 3. Étape de recherche adaptative à volume élevé (médian) en fonction de la taille de la boîte. 4. Couleur caméléon automatique pour les lignes de boîte et les boutons. 5. Plusieurs boîtes, faciles à créer et à supprimer. 6. Zone de volume de 70 % (activer dans

Breakthrough Solution For Trend Trading And Filtering With All Important Features Built Inside One Tool! Trend PRO's smart algorithm detects the trend, filters out market noise and gives entry signals with exit levels. The new features with enhanced rules for statistical calculation improved the overall performance of this indicator.
Important Information Revealed Maximize the potential of Trend Pro, please visit www.mql5.com/en/blogs/post/713938
The Powerful Expert Advisor Version
Automatin

PPR et Engulfing est un indicateur technique unique conçu pour identifier les modèles "PPR" et "Engulfing" sur les graphiques de devises de la plateforme de trading MetaTrader 4 (MT4). Ces modèles peuvent indiquer des retournements ou des continuations de tendance potentiels, fournissant aux traders des signaux précieux pour entrer et sortir du marché. Caractéristiques principales : Détection automatique des modèles : L'indicateur identifie et marque automatiquement les modèles PPR et Engulfing
FREE

Crystal Smart Volume Aperçu Crystal Smart Volume pour MT4 est un indicateur avancé d’analyse du volume et du delta, conçu pour révéler l’activité des institutions financières cachée derrière les mouvements ordinaires du prix.
Il combine les concepts de Smart Money (SMC) , Volume Spread Analysis (VSA) et la logique Delta afin d’analyser simultanément le comportement du prix et du volume.
L’indicateur identifie des événements clés tels que Buying Climax (Climax d’achat) , Selling Climax (Climax de
FREE
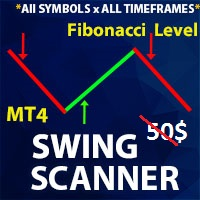
** All Symbols x All Time frames scan just by pressing scanner button ** Discount: The price is $50$, But now it is just $35, Limited time offer is active.
*** Contact me to send you instruction and add you in "Swing scanner group" for sharing or seeing experiences with other users. Swing EA: https://www.mql5.com/en/market/product/124747 Introduction: Swing Scanner is the indicator designed to detect swings in the direction of the trend and possible reversal swings. The indicator studies sev

ICT, SMC, SMART MONEY CONCEPTS, SMART MONEY, Smart Money Concept, Support and Resistance, Trend Analysis, Price Action, Market Structure, Order Blocks, BOS/CHoCH, Breaker Blocks , Momentum Shift, Supply&Demand Zone/Order Blocks , Strong Imbalance, HH/LL/HL/LH, Fair Value Gap, FVG, Premium & Discount Zones, Fibonacci Retracement, OTE, Buy Side Liquidity, Sell Side Liquidity, BSL/SSL Taken, Equal Highs & Lows, MTF Dashboard, Multiple Time Frame, BigBar, HTF OB, HTF Market Structure,

VeMAs est un outil de trading innovant conçu pour améliorer votre stratégie de trading en analysant la dynamique des volumes et la structure du marché. Que vous soyez un trader débutant ou expérimenté, VeMAs vous donne une longueur d'avance. L'indicateur VeMAs est disponible pour seulement 50 $. Le prix d'origine de l'indicateur est de 299 $.
OFFRE LIMITÉE DANS LE TEMPS. Version MT5
Here are some blogs on the VeMAs indicator
Le volume et la structure du marché sont quelques-uns des principaux
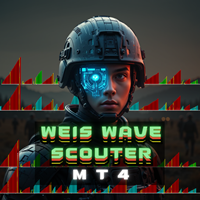
WeisWaveScouter is a powerful and accurate indicator designed to help traders detect key market movements based on price and volume waves. Built for the MetaTrader 4 platform, WeisWaveScouter provides detailed analysis of bullish and bearish waves, as well as highlighting volume spikes, giving you a clear view of market conditions.
Key Features: Bullish and Bearish Waves: Easily identify bullish and bearish movements with waves clearly differentiated by customizable colors.
Volume Spikes: Det

TopBottom Checker est un indicateur qui détermine les bas et les hauts du prix. L'indicateur peut être utilisé avec n'importe quelle paire de devises. L'indicateur fonctionne sur n'importe quel laps de temps de M1 à D1. L'indicateur peut être utilisé comme un système de trading autonome ou dans le cadre de tout système de trading que vous utilisez, car cet indicateur fonctionne avec les aspects du marché qui sont très importants pour absolument n'importe quelle stratégie. Les signaux indicateurs
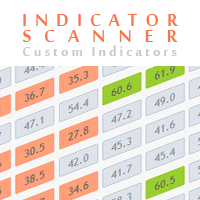
Advanced Indicator Scanner is a multi-symbol multi-timeframe scanner that works with hundreds of custom indicators available across the web including mql5 website market and codebase indicators.
Advanced Indicator Scanner features:
Scans your indicator in 28 customizable instruments and 9 timeframes. Monitors up to 2 lines(buffers) of an indicator. Showing of indicator value on buttons. You can choose between 3 alert modes: Single symbol and timeframe Multiple timeframes of a symbol Multiple
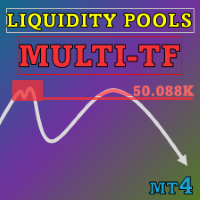
Special offer : ALL TOOLS , just $35 each! New tools will be $30 for the first week or the first 3 purchases ! Trading Tools Channel on MQL5 : Join my MQL5 channel to update the latest news from me L’indicateur Liquidity Pools est un outil avancé qui identifie et marque les zones de liquidité potentielles sur le graphique en analysant les zones de hauts et bas avec des touches fréquentes de mèches, le nombre de revisites et le volume échangé dans chaque zone. Cet outil offre aux tr

Description (MT4)
Cet indicateur détecte les moments de reentry du prix après qu’une bougie ait percé à l’extérieur des bandes de Bollinger, en combinant ce signal avec une confirmation RSI optionnelle pour réduire les faux positifs.
Un signal Buy ReEntry est généré lorsque le prix est descendu sous la bande inférieure puis revient à l’intérieur, avec éventuellement la confirmation que le RSI vient de sortir d’une condition de survente.
Un signal Sell ReEntry se produit lorsque le prix est mont
FREE

RSI Divergence Full +10 other divergence indicators
Contact me after payment to send you the User-Manual PDF File. Download the MT5 version here. Also you can download the >>> Hybrid Trading EA <<< that is designed and implemented based on RSI Divergence Indicator. RSI is a pretty useful indicator in itself but it's even more effective when you trade divergence patterns with that. Because the divergence signal of the RSI indicator is one of the most powerful signals among the indicators. Di

TDST Sniper Improved: The Support & Resistance Indicator That Never Repaints Stop chasing levels that disappear. Most indicators lie to you—they redraw, repaint, and change their mind after the fact. TDST Sniper Improved doesn't play games. What you see is what you get. Forever. Based on the legendary work of Thomas DeMark (popularized by James Pearl), this indicator identifies high-probability support and resistance clusters that hold their ground across all timeframes—from M5 scalping to We

Ou M Oving A S upport R MOYENNE Bandes ésistance.
L'indicateur de bandes MASR est une moyenne mobile entourée de deux bandes qui fonctionnent ensemble comme niveaux de support et de résistance. Statistiquement, les bandes MASR contiennent des bougies de prix 93% du temps. Voici comment il est calculé par étapes : 1. La première étape consiste à calculer le plus haut (HHV) et le plus bas (LLV) pour une période de temps X.
2. La deuxième étape consiste à diviser HHV par LLV pour obtenir la larg
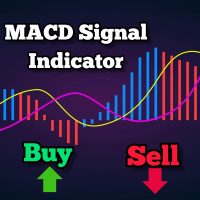
Il s'agit d'un indicateur de suivi de tendance basé sur le MACD, fournissant des signaux d'achat lorsque au-dessus des 200 MA et des signaux de vente lorsque en dessous. Le signal est généré lorsque le MACD croise la ligne zéro. L'indicateur affiche également un niveau de support et de résistance pouvant être utilisé comme stop-loss. Les paramètres ajustables incluent la période MA, le MACD fast EMA, le slow EMA et l'intervalle de support-résistance. Il trace les points les plus bas et les plus
FREE

STOP GAMBLING. START CALCULATING.
Are you tired of messy charts, repainting indicators, and false signals that get you into trades when the market is flat? Andy Universal Sniper Pro is not the usual "magic" indicator. It is a complete Algorithmic Trading System designed for manual scalping on Gold (XAUUSD), Indices, and Forex. The philosophy is simple: Cleanliness and Precision. The indicator hides background noise and shows you only two things: WHERE TO GO (The Map): Automatically draws Sup

Indicateur Crypto_Forex SCALPING SNIPER PRO pour MT4, système de trading sans retouche. Scalping Sniper Pro est un système avancé (indicateur) qui affiche précisément la dynamique des prix !
- Améliorez vos méthodes de trading avec l'indicateur professionnel Scalping Sniper Pro pour MT4. PC and Mobile alerts. - Ce système fournit des signaux très précis mais rares, avec un taux de réussite pouvant atteindre 90 %. - Le système utilise plusieurs paires pour rechercher des signaux afin de compen
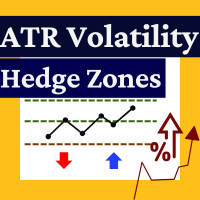
Cet indicateur alerte l'utilisateur lorsque l'ATR dépasse une valeur définie ou enregistre des variations significatives en pourcentage, détectant ainsi les pics/chutes de volatilité. Particulièrement utile pour: Les systèmes de trading basés sur la volatilité, Les systèmes Recovery Zone ou Grid Hedge. La volatilité étant cruciale pour ces systèmes, l'indicateur trace directement sur le graphique :
Les zones d'entrée
Les points de ré-entrée
Les niveaux de take profit
Permettant des backtests rap

"Auto FIBO Pro" Crypto_Forex indicator - est un excellent outil auxiliaire dans le trading !
- L'indicateur calcule et place automatiquement sur le graphique les niveaux de Fibo et les lignes de tendance locales (couleur rouge). - Les niveaux de Fibonacci indiquent les zones clés où le prix peut s'inverser. - Les niveaux les plus importants sont 23,6 %, 38,2 %, 50 % et 61,8 %. - Vous pouvez l'utiliser pour le scalping inversé ou pour le trading en grille de zones. - Il existe également de nomb

Version 1.6 ! Volume Strength 28 is better , easier to use and more awesome ! Based on complaint we got from the reviews, we understood many don't know how to really use the time frame setting on the input menu thus they have complaints of volatility, thus we have designed an Automatic Time Frame selection system that is suitable for novice traders.! The design of the indicator has been changed along with some calculation metrics. Based on complaints of high volatility we have been getting ,we

Indicator for determining flat and trend.
If the price is below any of the two histograms and two lines (red and blue), this is a sell zone.
When purchasing this version of the indicator, MT5 version for one real and one demo account - as a gift (to receive, write me a private message)!
If the price is above any of the two histograms and two lines (red and blue), this is a buy zone. MT5 version: https://www.mql5.com/en/market/product/70409 If the price is between two lines or in the zone of

A trend indicator based on the Hull Moving Average (HMA) with two periods. The Hull Moving Average is an improved variant of the moving average, which shows the moment of trend reversal quite accurately. It is often used as a signal filter. Combination of two types of Hull Moving Averages makes a better use of these advantages: HMA with a slow period identifies the trend, while HMA with a fast period determines the short-term movements and signals in the trend direction.
Features The movement d
FREE

Découvrez le secret pour réussir le trading Forex avec notre indicateur MT4 personnalisé!
Strategy with RangeBars https://youtu.be/jBaDCAPTtHc
Vous êtes-vous déjà demandé comment réussir sur le marché du Forex, gagnant régulièrement des bénéfices tout en minimisant les risques? Voici la réponse que vous avez recherchée! Permettez-nous d'introduire notre indicateur MT4 propriétaire qui révolutionnera votre approche du trading.
Polyvalence unique
Notre indicateur est spécialement conçu pour les
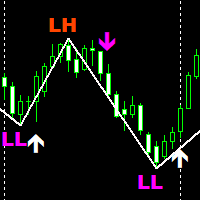
SMC Traders is a non-repaint indicator that is based on Price Action The indicator uses current market structure to predict future reversals. The indicator can be used with our free Market structure zig zag which can be found here: https://www.mql5.com/en/market/product/91579 Please note to find the HH AND HL CLINK ON LINK ABOVE Timeframes: 15 minutes for scalping 1 Hour for swing trading Purple Arrow look for sells in conjunction with LL White Arrow look for buys in conjunction with HL
FREE
Pipfinite creates unique, high quality and affordable trading tools. Our tools may or may not work for you, so we strongly suggest to try the Demo Version for MT4 first. Please test the indicator prior to purchasing to determine if it works for you. We want your good reviews, so hurry up and test it for free...we hope you will find it useful.
Attention This trading tool is specifically designed to help grid, martingale, averaging, recovery and hedging strategies. If you are not familiar with th

Impulse Zone Hunter – Outil de Trading de Précision Impulse Zone Hunter est un indicateur MT4 haute performance conçu pour offrir aux traders un avantage visuel clair dans l’identification des mouvements de marché à forte probabilité.
Il se concentre sur les zones de Supply & Demand , les Order Blocks et le ChoCH (Change of Character) , en affichant des signaux précis directement sur le graphique . Fonctionnalités clés 1. Trading en mode double Affichage au choix des zones Supply & Demand ou des

Actuellement 40% de réduction !
Ce tableau de bord est un logiciel très puissant qui fonctionne sur plusieurs symboles et jusqu'à 9 horizons temporels. Il est basé sur notre indicateur principal (Best reviews : Advanced Supply Demand ).
Le tableau de bord donne une excellente vue d'ensemble. Il montre : Les valeurs d'offre et de demande filtrées, y compris l'évaluation de la force de la zone, Les distances en pips vers/et dans les zones, Il met en évidence les zones imbriquées, Il donne 4
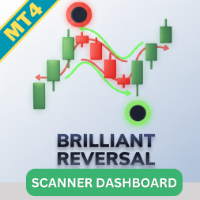
Le Brilliant Reversal Multicurrency Scanner MT4 est un outil puissant conçu pour aider les traders à surveiller plusieurs paires de devises et cadres temporels à l'aide de l'indicateur Brilliant Reversal. Ce scanner simplifie l'identification des renversements potentiels du marché en fournissant un balayage en temps réel et des alertes directement depuis un tableau de bord centralisé. Que vous tradiez des paires majeures, mineures ou exotiques, cet outil offre une couverture complète du marché e

Contact me for instruction, any questions! Introduction Chart patterns are an essential tool traders and investors use to analyze the future price movements of securities. One such pattern is the triple bottom or the triple top pattern, which can provide valuable insights into potential price reversals. This pattern forms when a security reaches a low price level three times before reversing upward or reaches a high price level three times before reversing downward.
Triple Top Bottom P

L'indicateur Renko de base est un outil puissant pour les traders à la recherche d'une perspective claire et concise du marché. Notre indicateur simplifie non seulement la visualisation des tendances, mais offre également des alertes précises pour les renversements, fournissant un avantage stratégique dans votre trading / Version MT5 gratuite
Caractéristiques Entièrement personnalisable: Adaptez l'indicateur à vos préférences grâce à des options de personnalisation avancées. Des couleurs aux
FREE

The presented indicator analyzes the direction of the short-term and long-term trend for specified periods, taking into account the volatility of the market. This approach allows combining high sensitivity of the indicator with a high probability of execution of its signals. The principle of use is extremely simple: the indicator histogram is greater than 0 - a buy signal / the indicator histogram is less than 0 - a sell signal. The indicator allows you to configure two types of parameters: fast

Protect against whipsaws: revolutionize your swing trading approach Swing Trading is the first indicator designed to detect swings in the direction of the trend and possible reversal swings. It uses the baseline swing trading approach, widely described in trading literature. The indicator studies several price and time vectors to track the aggregate trend direction and detects situations in which the market is oversold or overbought and ready to correct. [ Installation Guide | Update Guide | Tro

The Market Sessions indicator is a popular tool among forex and stock traders for visually representing global trading sessions on a price chart. It highlights the time periods for major trading sessions — such as the Asian (Tokyo) , European (London) , and American (New York) sessions — directly on the chart. This helps traders identify when markets open and close, allowing for better decision-making based on session-specific trading behavior. - Asian Session (Default: 00:00-09:00) - Lo
FREE
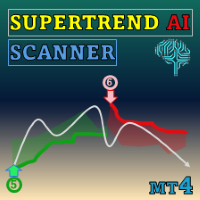
Special offer : ALL TOOLS , just $35 each! New tools will be $30 for the first week or the first 3 purchases ! Trading Tools Channel on MQL5 : Join my MQL5 channel to update the latest news from me Découvrez la puissance de l'IA avec le SuperTrend AI Clustering avec Scanner , un outil révolutionnaire pour MetaTrader 4 (MT4). Cet indicateur redéfinit l'analyse du marché en combinant le clustering K-means avec l'indicateur SuperTrend largement populaire, offrant aux traders un avanta
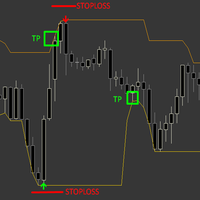
The Sure Reverse Channel is a dynamic non repaint trend indicator with entry arrows, the indicator focuses on catching a reverse swing in the market by using channel and price action formula, the indicator comes with built-in money management . HOW TO TRADE : Open buy trade when buy arrow pops up and set your SL below arrow, for TP you have TP which is opposite band. Open sell trade when sell arrow pops up and set your SL above arrow, for TP you have TP which is opposite band. band.
Why is
FREE

"Ppr PA" is a unique technical indicator created to identify "PPR" patterns on the currency charts of the MT4 trading platform. These patterns can indicate possible reversals or continuation of the trend, providing traders with valuable signals to enter the market.
Features: Automatic PPR Detection: The indicator automatically identifies and marks PPR patterns with arrows on the chart. Visual Signals: Green and red arrows indicate the optimal points for buying and selling, respectively. Ar
FREE

Profil du marché Forex (FMP en abrégé) Ce que ce n'est pas :
FMP n'est pas l'affichage TPO classique à code alphabétique, n'affiche pas le calcul global du profil de données du graphique et ne segmente pas le graphique en périodes et ne les calcule pas.
Ce qu'il fait :
Plus important encore, l'indicateur FMP traitera les données situées entre le bord gauche du spectre défini par l'utilisateur et le bord droit du spectre défini par l'utilisateur. L'utilisateur peut définir le spectre en tiran
FREE
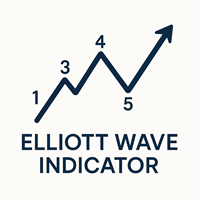
Indicateur de la théorie des vagues d'Elliott pour MetaTrader 4 L'indicateur basé sur la théorie des vagues d'Elliott a été conçu selon l'un des concepts professionnels du marché du Forex. Cet indicateur trace la structure du marché sous forme de vagues et compte les pics en tant que vagues ascendantes et descendantes de 1 à 5. Les utilisateurs peuvent visualiser les vagues et recevoir des alertes lorsqu'un nouveau numéro est généré. Deux types de vagues sont inclus : vague principale et vague s
FREE

L'indicateur trouve les niveaux de volume de prix maximum et minimum (profil de marché) sur l'histogramme de travail pour le nombre de barres spécifié. Profil composite. La hauteur de l'histogramme est entièrement automatique et s'adapte à n'importe quel outil et période. L'algorithme de l'auteur est utilisé et ne répète pas les analogues connus. La hauteur des deux histogrammes est approximativement égale à la hauteur moyenne de la bougie. Smart alert vous permet de vous informer sur le prix

PINBAR SCANNER PRO with TREND and RSI + CCI OSCILLATORS filter This indicator has been designed to automatically and constantly scan entire market to find high probability pinbar formations, so you can just wait for the perfect trading opportunity come to you automatically.
PINBAR is the strongest candle reversal pattern known in technical analysis. It shows excellent areas to determine potential entries and exits with opportunity to use excellent risk and reward ratios. It includes an RSI and

First time on MetaTrader, introducing IQ Star Lines - an original Vedic Astrology based indicator. "Millionaires don't use astrology, billionaires do" . - J.P. Morgan, Legendary American financier and banker.
IQ Star Lines, an unique astrological indicator purely based on Vedic astrology calculations, published for the first time on Metatrader. This unique tool plots dynamic planetary grid lines based on real-time stars, constellations, and celestial movements, which allows you to plot t

Title: SMC Structure for EURUSD Description: This indicator is designed to map market structures based on Smart Money Concepts (SMC). It identifies Swing Structure, Internal Structure, Order Blocks, and Fair Value Gaps (FVG). The tool is optimized for performance to manage resources efficiently on the MetaTrader platform. Key Features: 1. Market Structure Mapping Identifies Major Swing Structure with BOS (Break of Structure) and CHoCH (Change of Character). Displays Internal Structure to visual
FREE
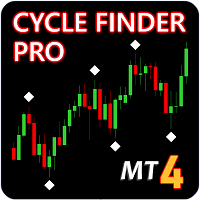
Update - Version 4.0 now includes trend change signal. Indicator will tell you the current trend on all charts. Update - Version 5.0 now includes alerts for mt4, push and email notifications.
Cycle Finder Pro is a chart reading indicator and is designed for trend and pattern traders . Chart reading is time consuming and complex and requires knowledge of price action , cyclicity, and time frame correlation . Cycle Finder Pro reads all this in one simple indicator so you can spot trend and char

Un modèle de graphique en triangle symétrique représente une période de contraction et de consolidation avant que le prix ne soit forcé de casser à la hausse ou de s'effondrer. Une cassure de la ligne de tendance inférieure marque le début d'une nouvelle tendance baissière, tandis qu'une cassure de la ligne de tendance supérieure indique le début d'une nouvelle tendance haussière. Obtenez le tableau de bord pour surveiller tous les instruments et les délais que vous échangez contre des modèles
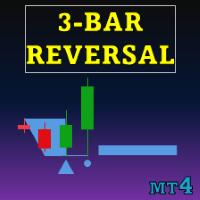
Special offer : ALL TOOLS , just $35 each! New tools will be $30 for the first week or the first 3 purchases ! Trading Tools Channel on MQL5 : Join my MQL5 channel to update the latest news from me L'Indicateur de Modèle de Renversement en Trois Barres offre un outil puissant pour les traders, identifiant et mettant en évidence automatiquement les modèles de renversement en trois barres directement sur le graphique des prix. Cet indicateur est une ressource précieuse pour détecter
This index is based on the secondary development of supertrend, adding the combination index of Ma mean line user-defined algorithm, NRP, MTF three index weighted realization function.
There are two colors in the batch marking, orange for short and green for long.
Supertrend index is the first artificial intelligence indicator in the whole network --- signal light trading strategy.
It imitates the uncertain concept judgment and reasoning thinking mode of human brain. For the description
FREE
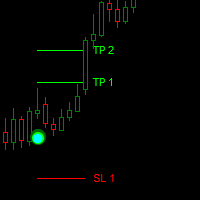
Dark Point is an Indicator for intraday trading. This Indicator is based on Trend Following strategy, also adopting the use of the atr to determine the right volatility. We can enter in good price with this Indicator, in order to follow the strong trend on the current instrument. If you love Dark Point, consider adding some power: Dark Power
Key benefits
Easily visible take profit/stop loss lines Intuitive directional points/arrows by colors Useful statistics , which indicate the win ra
FREE

The indicator automatically identifies the 1-2-3 pattern on the chart. The indicator is able to monitor the formation of pattern in real time. It informs the trader when the pattern is completely formed (when the price breaks the line in point 2) and displays the completed patterns in history. The patterns are never redrawn. The indicator can identify patterns on any instruments (currency pairs, stock market, gold, etc.) without the need to adjust to each instrument. Simple and clear visualizati

Scalper System est un indicateur convivial conçu pour détecter les zones de consolidation du marché et anticiper les mouvements de rupture. Optimisé pour l'unité de temps M1, il est particulièrement performant sur les actifs très volatils comme l'or (XAUUSD). Bien que conçu à l'origine pour l'unité de temps M1, ce système est performant sur toutes les unités de temps grâce à sa stratégie robuste basée sur l'action des prix.
Pourquoi Scalper System ? Flèches d'achat et de vente Prix d'entrée sa

Simple QM Pattern is a powerful and intuitive trading indicator designed to simplify the identification of the Quasimodo (QM) trading pattern. The QM pattern is widely recognized among traders for effectively signaling potential reversals by highlighting key market structures and price action formations. This indicator helps traders easily visualize the QM pattern directly on their charts, making it straightforward even for those who are new to pattern trading. Simple QM Pattern includes dynamic
FREE

The Only 100% Universal Tool! Stop trading against nature! This is your chance to secure the only indicator rooted in the absolute laws that govern the entire universe. Most tools guess—this one reveals the truth. Buy another toy or buy the truth. Your choice...
Based on Universal Laws — NOT Some Guy’s Algorithm: Let the market adjust to the Hidden Cycles Geometry — not the other way around.
Most indicators are based on a man-made formula. They often lag, fail over time, or need constant re-o
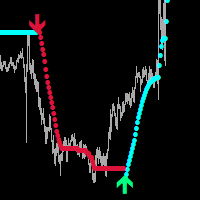
Global Parabolic MT4
Indicator for scalping on M1-M5.
A very good indicator for your trading system, it can be used as a standalone
trading system, I recommend using it together with - System Trend Pro The indicator does not repaint and does not change its data.
Settings:
Change the FILTER parameter for accurate market entries.
Any questions? Need help?, I am always happy to help, write me in private messages or
In telegram
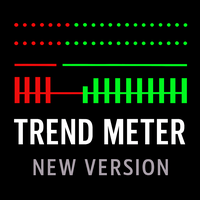
Indicateur d’analyse de tendance multi-devises pour MetaTrader 4, visualisant la direction et la force de la tendance sur plusieurs unités de temps. À des fins d’analyse uniquement. TREND METER – INDICATEUR D’ANALYSE DE TENDANCE MULTI-DEVISES (MT4) Trend Meter est un indicateur technique d’analyse de tendance conçu pour visualiser la direction de la tendance, sa force et son alignement sur plusieurs unités de temps et symboles. L’indicateur est destiné à l’analyse visuelle uniquement et n’ouvre
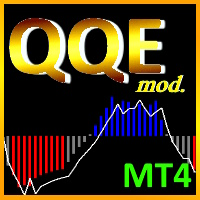
The Quantitative Qualitative Estimation (QQE) indicator is derived from Wilder’s famous Relative Strength Index (RSI). In essence, the QQE is a heavily smoothed RSI.
Modification of this version: ( converted from tradingview script by Mihkell00, original from Glaz, 100% identical output)
So there are Two QQEs. One that is shown on the chart as columns, and the other "hidden" in the background which also has a 50 MA bollinger band acting as a zero line.
When both of them agree - y
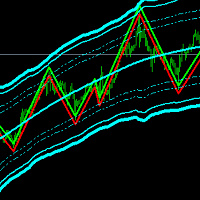
Channel Trend Bands – A Comprehensive Indicator for Market Analysis MetaTrader 5 Version
Simple to Use, Effective in Application User-Friendly and Suitable for All Traders This indicator stands out due to its straightforward functionality. Whether you're a beginner exploring the market or an experienced trader refining your strategy, this tool offers valuable insights. Using a Triangular Moving Average (TMA) with additional ATR-based bands , it provides structured market data to support well-i
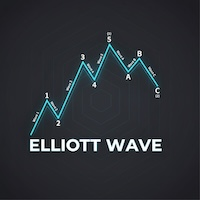
Théorie des Vagues d'Elliott Automatisée 1. Comptage automatique et réduction des biais (Objectivité) Normalement, le comptage des vagues d'Elliott implique beaucoup "d'imagination". Cet indicateur aide en : Trouvant les Vagues d'Impulsion (1-2-3-4-5) : Utilise des règles strictes pour montrer la structure théoriquement correcte. Trouvant les Vagues Correctives (A-B-C) : Aide à repérer les retracements pour entrer dans la tendance. 2. Analyse Multi-Degrés Analyse 3 niveaux de profondeur simultan

Williams Precision Prime – Precision Meets Legend Williams Precision Prime is a high-performance trend-following indicator that bridges the gap between Larry Williams' time-tested logic and modern algorithmic filtering, all wrapped in the exclusive Peak Precision design. Engineered for traders who demand clarity, stability, and mathematically sound entries, this system utilizes a triple-layer EMA strategy (100, 50, and 21) to identify high-probability "Cross-Momentum" setups within a confirmed d
FREE
Le MetaTrader Market est le meilleur endroit pour vendre des robots de trading et des indicateurs techniques.
Il vous suffit de développer une application pour la plateforme MetaTrader avec un design attrayant et une bonne description. Nous vous expliquerons comment publier votre produit sur Market pour le proposer à des millions d'utilisateurs de MetaTrader.
Vous manquez des opportunités de trading :
- Applications de trading gratuites
- Plus de 8 000 signaux à copier
- Actualités économiques pour explorer les marchés financiers
Inscription
Se connecter
Si vous n'avez pas de compte, veuillez vous inscrire
Autorisez l'utilisation de cookies pour vous connecter au site Web MQL5.com.
Veuillez activer les paramètres nécessaires dans votre navigateur, sinon vous ne pourrez pas vous connecter.