适用于MetaTrader 4的技术指标 - 4
iPump 指标是一种多功能指标, 结合了三类指标的优点。
多个 TF 上的同时趋势检测 定义阻力和支撑区域 确定超买和超卖区域 指标功能: 定义趋势 对于希望客观评估当前市场方向并避免主观性的所有交易者来说,此功能将是必需的。在一瞬间,您将能够在最重要的时间范围内比较趋势的方向,这将变得清晰直观。 确定支撑位和阻力位 使用 iPump 指标,您将能够在几秒钟内评估资产的潜在价格障碍。
而且该指标会告诉您您面前的级别是什么类型: 测试水平(阻力/支撑) 反转水平 弱水平 未测试级别 确定超买和超卖区域 对于此任务,该指标具有非滞后和非重绘信号振荡器,显示资产的当前状态,基于此数据,您可以:
确切地知道哪些区域何时值得购买 什么时候出售资产会很有趣的区域 振荡器优势: 独特的计算算法 该算法实际上能够帮助我和我的同事以及我的同事进行交易,该算法用于 Pump and Dump Expert Advisor。 无需重绘 当超卖或超买价格高于平常时,该指标将准确显示信号。这将使您能够及时就开仓的可取性做出决定 毫不拖延 该指标每秒处理有关价格状态的报价的传入数据,这使交易者可以随时掌

MT5 version | Owl Smart Leve Indicator | Owl Smart Levels策略 | FAQ
Fractals Indicator 是作者 Bill Williams 交易策略的要素之一。 它用於在價格圖表上搜索價格反轉點,從而搜索支撐位和阻力位。 Full Fractals Indicator 是改進的 Fractals,幾乎所有交易終端的工具包中都有。 唯一的區別是,為了構建分形,我們在主蠟燭的左側使用了 5 根蠟燭,在主蠟燭的右側使用了 2 根蠟燭(參見圖 1)。 除了基本構造之外,Full Fractals 還尋找價格已停止一段時間的水平。 Telegram 聊天: @it_trader_chat 新的 Expert Advisor Prop Master - 在您的交易终端中进行测试 https://www.mql5.com/zh/market/product/115375
Full Fractals Indicator 表示什麼。 分形在價格圖表上顯示為關鍵蠟燭上的向上和向下箭頭。 基於這些點,您可以自由地建
FREE
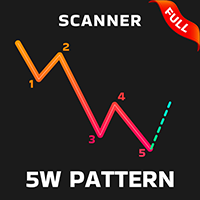
Contact me after payment to send you the User-Manual PDF File. 5W Pattern introduction The 5W pattern occurs when the price forms an alternating 5-wave cycle with its volatility. In fact, the 5W pattern is a price series of alternating HH or LL (higher high or lower low), which is the main characteristic of a trend. The pattern of 5W should have the characteristic of non-overlapping waves, also the points of the pattern are usually formed in Fibonacci levels. The completed pattern of 5W actua

Crystal Smart Volume 概述 Crystal Smart Volume 是一款专为 MT4 平台开发的高级成交量与 Delta 分析指标,用于揭示隐藏在普通价格波动背后的机构交易活动。
它结合了 Smart Money Concepts (SMC) 、 Volume Spread Analysis (VSA) 和 Delta 逻辑 ,以同时分析价格与成交量的行为。
该指标能够识别关键市场事件,例如 Buying Climax(买入高潮) 、 Selling Climax(卖出高潮) 、 Weak Candles(弱势蜡烛) 以及 High-Volume Reversals(高成交量反转) ,帮助交易者精确捕捉市场的潜在转折点。 系统内置 TBR(Trap Break Reversal) 、 STBR(Sweep Trap Break Reversal) 与 EVR(Engulf Volume Reversal) 等反转形态识别模块,同时包含专业的六色成交量柱状图和实时 Delta 计算。
该指标拥有简洁直观的图形界面与极低的 CPU 占用率,非常适合专业日内交易员及依
FREE

Pulse Scalping Line - an indicator for identifying potential pivot points. Based on this indicator, you can build an effective Martingale system. According to our statistics, the indicator gives a maximum of 4 erroneous pivot points in a series. On average, these are 2 pivot points. That is, the indicator shows a reversal, it is erroneous. This means that the second signal of the indicator will be highly accurate. Based on this information, you can build a trading system based on the Martingale
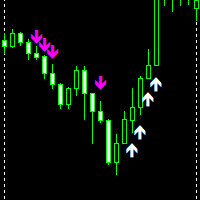
Up down Non-repaint is an MT4 indicator made to give accurate signals without disappearing. Magenta/Pink Arrow is your sell signal. white Arrow is your buy signal. indicator works on all pairs and timeframes 1 minute to Monthly timeframe. indicator is made for scalping do not hold trades for too long once arrows show the same direction you can add more entries all the best.!!
FREE

PPR 和 Engulfing 是一个独特的技术指标,设计用于在 MetaTrader 4 (MT4) 交易平台上的货币图表中识别 "PPR" 和 "吞没" 模式。这些模式可以指示潜在的趋势反转或延续,为交易者提供宝贵的入市和出市信号。 主要特点: 自动模式检测 :指标自动识别并在图表上用箭头标记 PPR 和 吞没模式。 视觉信号 :绿色向上箭头表示买入点,而红色向下箭头表示卖出点。 可自定义箭头颜色 :用户可以通过指标设置选择看涨和看跌信号的箭头颜色。 模式选择 :三种操作模式——仅 PPR、仅 吞没或两种模式同时。 如何使用: 附加到图表 :将指标应用到所需的货币对或金融工具图表。 分析信号 :监控图表上箭头的出现,以确定买入和卖出机会。 做出决定 :结合其他分析工具使用指标信号,以提高交易决策的准确性。 交易策略: PPR 和 Engulfing 可以集成到各种交易策略中。交易者可以将此指标与其他技术指标和趋势分析方法结合使用,以提高交易效率。 其他产品: 您可以在 卖家页面 找到其他有用的工具和指标。 参数: 模式选择 :选择要分析的模式(PPR、吞没、两者)。 UpArrow
FREE
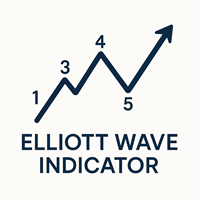
Meta Trader 4的艾略特波浪理论指标 艾略特波浪理论指标基于外汇市场中的专业概念开发,可以绘制市场结构为波浪形态,并标注1至5的上升和下降波浪,让用户能够清晰看到艾略特波浪,并在新波浪出现时收到提醒。此指标包含主波浪和子波浪,可用两种不同颜色区分大波浪和小波浪,用户还可以启用或禁用任一波浪。 主要特点 双波浪识别 : 同时识别主波浪和子波浪,全面展现市场走势。 自动波浪计数 : 根据高点和低点自动标注1至5波,简化分析过程。 可自定义参数 : 可分别为主波浪和子波浪设置深度、偏差和回撤参数,适应不同交易策略。 提醒系统 : 在特定波浪计数时接收提醒,及时把握交易机会。 指标设置 历史限制 : 最大处理柱数 : 设置处理的最大K线数量(默认:1000)。 标签偏移 : 波浪标签的水平偏移(像素): 设置波浪标签的水平偏移量(默认:10像素)。 主波浪设置 : 波长 : 设置主波浪的长度(默认:30)。 波动偏差 : 设置主波浪的偏差(默认:3)。 回撤步长 : 设置主波浪的回撤步长(默认:3)。 绘制波浪 : 启用或禁用主波浪绘制。 绘制波浪编号 : 启用或禁用主
FREE
MT5 版本下载地址:
https://www.mql5.com/en/market/product/50538 Telegram 频道和群组:
https://t.me/bluedigitsfx VIP 群组权限:
请将任何付费产品的付款凭证发送至我们的私信 推荐经纪商:
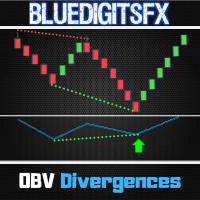
https://bit.ly/BlueDigitsFxStarTrader BlueDigitsFx OBV Divergence — 强大的 MT4 指标,用于识别 OBV 背离并预测市场反转 BlueDigitsFx OBV Divergence 指标通过分析价格和累计能量指标(OBV),自动识别看涨和看跌背离,提前发出潜在趋势反转或延续的信号。通过突出价格行为与成交量之间的背离模式,帮助交易者发现高概率的入场和出场点。 主要功能 自动检测看涨和看跌 OBV 背离 适用于所有时间周期和货币对 可自定义背离信号提醒,包括弹窗、邮件和推送通知 图表上清晰的视觉信号,便于快速识别 轻量且优化设计,确保 MT4 平稳运行 优势 结合成交量和价格分析,提升入场和出场时机 相较于仅基于价格的背离指标,减少错误信号

标题:BBMA 结构指南 - BBMA 结构指南
描述: BBMA 结构指南是一款专业的 MQL4 指标,旨在帮助交易者更轻松、更高效地理解 BBMA 结构的演变。BBMA,即“布林带移动平均”,以“领先一步”的口号而闻名,强调了深入理解市场结构的重要性。
通过 BBMA 结构指南,您可以快速识别驱动价格波动的基本市场结构模式。这将帮助您做出更准确、更有效的交易决策。该指标清晰直观地呈现信息,使您能够更自信地迈出交易中的下一步。
主要特点: - **深入理解:** BBMA 结构指南提供清晰的市场结构视图,让您更好地理解市场动态。 - **易于使用:** 设计有直观界面,所有经验水平的交易者都能轻松使用该指标。 - **强有力的信号:** 该指标提供 BBMA 系统中的重要信号,如**CSAK**(蜡烛强劲方向)和 **MHV**(市场失去交易量)。 **CSAK** 信号指示存在方向强劲的蜡烛,而 **MHV** 信号指示市场正在失去交易量。
交易设置: BBMA 结构指南还介绍了两个重要的交易设置,即**MHV 设置**(市场失去交易量)和 **再次进入**。MHV 设置

该指标可以评估金融工具的波动性,并高效地发出价格变动方向发生重大变化的信号。 该指标直观、易于使用。 指标信号是在条形图形成完成后生成的,此时指标相对于零点的位置发生改变。 指标从不重新绘制信号。 指标信号必须通过价格超过指标相对于零的位置改变的条的最大值/最小值来确认。 该指标允许您向移动终端发送电子邮件和消息。 可配置指标参数: Sensitivity - 指标对金融工具波动性的敏感度; Signal_on_Chart - 指标不仅在指标窗口中显示信号,还在价格图表上显示信号; UP_Symbol_Type -价格图表上显示的“上涨”信号的符号类型; DN_Symbol_Type - 价格图表上显示的“下跌”信号的符号类型; UP_Symbol_Distance - 从图表到价格图表上显示的“上涨”信号符号的距离; DN_Symbol_Distance - 从图表到价格图表上显示的“下降”信号符号的距离; UP_Symbol_Size - 价格图表上显示的“上涨”信号符号的大小; DN_Symbol_Size - 价格图表上显示的“下降”信号符号的大小; UP_Symbol_C

首先,值得强调的是,这个交易工具是非重绘、非重画和非滞后的指标,非常适合专业交易。
在线课程,用户手册和演示。 智能价格行动概念指标是一个非常强大的工具,既适用于新手,也适用于经验丰富的交易者。它将超过20个有用的指标合并到一个指标中,结合了高级交易思想,如内圈交易员分析和智能资金概念交易策略。该指标侧重于智能资金概念,提供有关大型机构交易方式的见解,帮助预测它们的动向。
它在流动性分析方面尤其擅长,有助于理解机构的交易方式。它擅长预测市场趋势,并仔细分析价格波动。通过将您的交易与机构策略对齐,您可以更准确地预测市场走向。该指标多才多艺,擅长分析市场结构,识别重要的订单区块,并识别各种模式。
它擅长识别BOS和CHoCH等模式,理解动量的转变,并突出显示供需强劲的关键区域。它还擅长发现强大的不平衡,并分析价格创造更高高点或更低低点的模式。如果您使用斐波那契回撤工具,该指标可以满足您的需求。它还可以识别相等的高点和低点,分析不同的时间框架,并通过仪表板显示数据。
对于使用更高级策略的交易者,该指标提供了工具,如公平价值差指标和优惠和折扣区域的识别。它特别关注高时间框架订单区块,并
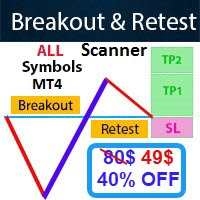
- Real price is 80$ - 40% Discount (It is 49$ now) Contact me for instruction, add group and any questions! - Non-repaint - I just sell my products in Elif Kaya profile, any other websites are stolen old versions, So no any new updates or support. - Lifetime update free Related product: Bitcoin Expert
Introduction The breakout and retest strategy is traded support and resistance levels. it involves price breaking through a previous level. The break and retest strategy is designed to help tr

Gold Scalper Super is an easy-to-use trading system. The indicator can be used as a standalone scalping system on the M1 time frame, as well as part of your existing trading system. Bonus: when purchasing an indicator, Trend Arrow Super is provided free of charge, write to us after purchase. The indicator 100% does not repaint!!! If a signal appears, it does not disappear! Unlike indicators with redrawing, which lead to the loss of a deposit, because they can show a signal and then remove it.
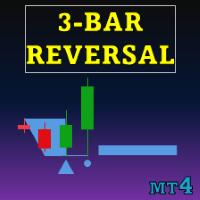
Special offer : ALL TOOLS , just $35 each! New tools will be $30 for the first week or the first 3 purchases ! Trading Tools Channel on MQL5 : Join my MQL5 channel to update the latest news from me 三条反转形态指标 为交易者提供了一个强大的工具,自动识别并在价格图上标出三条反转形态。该指标是一种有价值的资源,用于检测潜在的趋势反转,并通过集成的趋势指标提高信号准确性。 查看MT5版本: Three Bar Reversal Pattern MT5 查看更多产品: 所有产品 关键特性 自动形态识别: 该指标扫描三条反转形态,并以清晰的视觉信号显示,帮助识别潜在的趋势反转点。 基于形态的支撑和阻力水平: 当反转形态得到确认且价格走势与其一致时,指标会扩展形态的边界,建立通常上边界作为阻力,下边界作为支撑的水平。 趋势过滤选项: 此指标允许用户从多个关键指标(包括

Delta Swing Pro - Multi-Timeframe Trend Consensus System for MT4 Concept: Capturing the Moment of Perfect Alignment The greatest adversary in trading is the "contradiction" between different timeframes. It is common to find a 5-minute chart showing a bullish trend while the 1-hour chart remains bearish. This conflict creates market noise that leads many traders into unprofitable traps. Delta Swing Pro is engineered to synchronize these varying timeframe vectors. It identifies the rare moments

本指标是基于 SuperTrend的二次开发,加入了MA均线自定义算法、 nrp、 mtf三种指标 加权 实现功能的组合指标。 指标线分两种颜色,橙色代表做空,绿色代表做多。
SuperTrend指标是 全网首款仿人工智能指标------信号灯交易策略。 模仿人脑的不确定性概念判断、推理思维方式,对于模型未知或不能确定的描述系统,以及强非线性、大滞后的控制对象,应用模糊集合和模糊规则进行推理,表达过渡性界限或定性知识经验,模拟人脑方式,实行模糊综合判断,推理解决常规方法难于对付的规则型模糊信息问题。模糊逻辑善于表达界限不清晰的定性知识与经验,它借助于隶属度函数概念,区分模糊集合,处理模糊关系,模拟人脑实施规则型推理,解决因“排中律”的逻辑破缺产生的种种不确定问题。 SuperTrend是一个非常不错的交易系统,其主要原理是采用ATR通道突破策略(类似于肯特通道)。 真实波动幅度均值(ATR)是优秀的交易系统设计者的一个不可缺少的工具,它称得上是技术指标中的一匹真正的劲马。每一位系统交易者都应当熟悉ATR及其具有的许多有用功能。其众多应用包括:参数设置,入市,止损,获利等,甚至是资金管
FREE
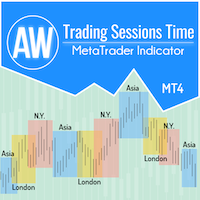
为了方便交易者获取市场表现数据并更好地制定交易策略,我们开发了交易时段指标。各个交易所的开盘时间会影响交易,因为它会影响市场活动和交易量。这些因素决定了不同工具的波动性和交易机会。 AW 交易时段指标显示亚洲、伦敦和纽约市场的交易时间。交易者可以显示或隐藏不同的时区以获得更好的体验。在图表上,您可以看到距离交易时段结束的时间,以及交易时段的大小。图表上数据的显示具有灵活的图形调整,适合不同风格的交易图表。
更多产品 -> 这里
优点:
显示亚洲、伦敦和纽约交易时段, 如果有必要,以数字显示会话大小, 开启后,显示交易时段结束的时间, 可以单独禁用交易时段, 图表上可自定义的会话边框样式 如果需要,可以在图表上显示垂直线 可以用纯色显示会话 自定义会话文本(颜色、偏移量、名称)
输入变量:
主要设置 Number_of_Days-显示指标的天数。
Show_Session_Size_in_Points - 启用后,指标将显示每个交易时段规模的数字值(以点为单位)。
Show_Time_Until_end_of_Session - 在图表的右上角显示或隐藏会话结束的时间。
Show
FREE
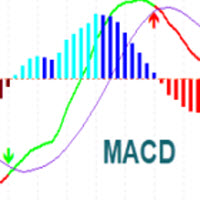
MACD Indicator It has MACD line, Signal line, and Histogram. The Histogram has 4 colors based on Direction Above and Below the Zero Line, showing its movement direction as simple as possible. Allows Show MACD & Signal Line, Show Change In color of MACD Line based on cross of Signal Line. Show Dots at Cross of MacD and Signal Line, Turn on and off Histogram. Enjoy your trading experience, and feel free to share your comments and reviews.
If you are interested in this indicator, you might
FREE

Swing Trading 是第一个旨在检测趋势方向的波动和可能的反转波动的指标。它使用在交易文献中广泛描述的基准摆动交易方法。该指标研究多个价格和时间向量,以追踪总体趋势方向,并检测市场超卖或超买并准备好进行修正的情况。 [ 安装指南 | 更新指南 | 故障排除 | 常见问题 | 所有产品 ]
市场波动的利润不会被窃取 指示器始终显示趋势方向 彩色价格带代表机会基准 彩色虚线表示可能的反转波动 该指标分析其自身的质量和性能 它实现了一个多时间仪表板 可定制的趋势和波动周期 它实现了电子邮件/声音/推送警报 指示器为非重涂或重涂
什么是摇摆交易 摇摆交易是一种尝试在一天到一周内从证券中获得收益的交易方式,尽管某些交易最终可以保持更长的寿命。摇摆交易者使用技术分析来买入弱点和卖出力量,并有耐心等待这些机会的发生,因为在发生一波抛售浪潮之后购买证券而不是陷入抛售更有意义。
机会基准 关于历史数据的大量研究证明,适合于波动交易的市场倾向于在基线价格带上下交易,基线价格带由图表显示,使用平均真实区间计算得出。波动交易者使用基线,该策略是购买常态和卖出躁狂,或做空常态并掩盖沮丧。在没有疲

The Market Sessions indicator is a popular tool among forex and stock traders for visually representing global trading sessions on a price chart. It highlights the time periods for major trading sessions — such as the Asian (Tokyo) , European (London) , and American (New York) sessions — directly on the chart. This helps traders identify when markets open and close, allowing for better decision-making based on session-specific trading behavior. - Asian Session (Default: 00:00-09:00) - Lo
FREE
Special offer : ALL TOOLS , just $35 each! New tools will be $30 for the first week or the first 3 purchases ! Trading Tools Channel on MQL5 : Join my MQL5 channel to update the latest news from me I. 介绍
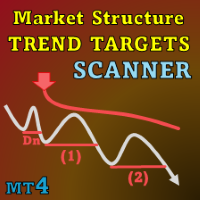
Market Structure Trend Targets Scanner 是一个强大的工具,用于分析市场趋势、识别突破点,并通过动态止损管理风险。通过跟踪之前的高点和低点以确定突破点,这个工具帮助交易者以直观的方式快速识别市场趋势和潜在的反转。 查看更多MT5版本: Market Structure Trend Targets MT5 Scanner 查看更多产品: 所有 产品 II. 主要特点 通过顺序编号识别突破点 清晰区分上升趋势 当价格突破之前的高点,以及下降趋势当价格突破之前的低点。 用入场价标记初始突破 ,而后续的突破标记为(1, 2,
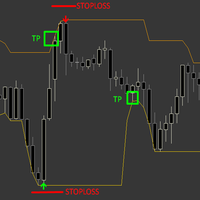
The Sure Reverse Channel is a dynamic non repaint trend indicator with entry arrows, the indicator focuses on catching a reverse swing in the market by using channel and price action formula, the indicator comes with built-in money management . HOW TO TRADE : Open buy trade when buy arrow pops up and set your SL below arrow, for TP you have TP which is opposite band. Open sell trade when sell arrow pops up and set your SL above arrow, for TP you have TP which is opposite band. band.
Why is
FREE
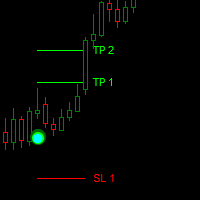
Dark Point is an Indicator for intraday trading. This Indicator is based on Trend Following strategy, also adopting the use of the atr to determine the right volatility. We can enter in good price with this Indicator, in order to follow the strong trend on the current instrument. If you love Dark Point, consider adding some power: Dark Power
Key benefits
Easily visible take profit/stop loss lines Intuitive directional points/arrows by colors Useful statistics , which indicate the win ra
FREE

基本 Renko 指标是交易者寻求清晰简明的市场观点的有力工具。我们的指标不仅简化了趋势可视化,还能提供准确的反转警报,为您的交易提供战略优势/ 免费 MT5 版本
功能 完全可定制: 利用高级定制选项,根据您的业务偏好定制指标。从颜色到方框大小设置,您都可以完全控制图表上的信息显示方式。 反转提醒: 利用我们的反转警报,第一时间了解市场方向的潜在变化。这样,您就可以及时做出明智的决定,最大限度地提高利润,减少损失。
输入 Size of the boxes: 方框大小(基于点数) Bullish box colour: 看涨方框颜色 Bearish box colour: 看跌方框颜色 Box opacity: 不透明度(0 到 100 之间)。透明度越低,透明度越高 Text colour: 计算每个方框中柱状图数量的数字颜色 Font size: 数字文本的大小 Max Bars: 指标进行计算的最大条数(0 表示所有可用条数) Pop-up Alert: 出现反转时提醒 MT4 终端 Email alert: 出现反转时发送电子邮件提醒
FREE

TMA Currency Meter is the ultimate currency meter. Based on the Triangular Moving Average of all available symbols, this indicator shows which currencies are strong, strengthening, weak or weakening. Experienced as well as novice traders will see the strong and weak currencies in the blink of an eye, and know which trade possibilities to explore further. TMA Currency Meter is a true Multi Timeframe indicator. It is easy to show the currency strengths for a higher timeframe than the chart timefra

Looking for a powerful yet lightweight swing detector that accurately identifies market structure turning points?
Want clear, reliable buy and sell signals that work across any timeframe and any instrument?
Buy Sell Arrow MT Swing is built exactly for that — precision swing detection made simple and effective. This indicator identifies Higher Highs (HH) , Higher Lows (HL) , Lower Highs (LH) , and Lower Lows (LL) with remarkable clarity. It is designed to help traders easily visualize market str

Special offer : ALL TOOLS , just $35 each! New tools will be $30 for the first week or the first 3 purchases ! Trading Tools Channel on MQL5 : Join my MQL5 channel to update the latest news from me Supertrend Fakeout 指标是经典 Supertrend 指标的增强版本,旨在提供更可靠的趋势信号。通过引入诸如 Fakeout Index Limit 和 Fakeout ATR Mult 等高级功能,该指标有助于过滤掉由于短期价格波动或市场噪声引起的假趋势反转。 查看更多 MT5 版本: Supertrend Fakeout MT5 查看更多产品: 所有产品 工作原理 Supertrend Fakeout 指标基于 平均真实范围 (ATR) 和一个乘数来识别趋势。 当价格高于 Supertrend 线时,表示上升趋势。 当价格低于 Supertr
FREE

ICT,SMC,智能货币概念,支撑和阻力,趋势分析,价格行为,市场结构,订单区块,突破区块,动量转变,强大的不平衡,HH/LL/HL/LH,公允价值差距,FVG,溢价和折扣区域,斐波那契回撤,OTE,买方流动性,卖方流动性,流动性空白,市场交易时间段,NDOG,NWOG,银弹,ICT模板。 在金融市场中,准确的市场分析对于投资者来说至关重要。为了帮助投资者更好地理解市场趋势和流动性,我们提供了一份使用教程,旨在实现高级市场分析功能。以下是一些功能的简要介绍和实现方法: 1. 显示高时间框架市场结构: 通过设置参数,您可以在图表上显示高时间框架市场结构。这将帮助您更好地理解市场的整体走势和结构。您可以根据自己的需求设置时间周期,并在图表上显示市场结构。 2. 显示流动性: 流动性是市场的重要指标之一。通过设置参数,您可以在图表上显示买方和卖方的流动性。您可以自定义文本和颜色,以便更好地识别不同的流动性水平。您还可以选择显示伦敦AM会话和纽约午餐时间的流动性。 3. 显示公平价值差距: 公平价值差距是指市场价格与公平价值之间的差异。通过设置参数,您可以在图表上显示公平价值

该指标从极值开始构建三周期信号和反转形态 123。信号出现在第二根蜡烛的开口处。 该形态可以通过不同方式(测试点 3、突破等)进行交易。退出通道或突破趋势线是寻找入场点的主要触发因素。 图标根据斐波那契水平着色。黄色图标表示对某一水平的测试,在该水平上信号会被放大。 使用多币种仪表盘,您可以跟踪 123 形态是在哪些货币对上发现的,以及有多少个条形图跟随该形态。 基于分形之字形。可重新绘制。因此,请在博客链接 - 123 Fractal Trading With UPD1 中研究该策略。
输入参数。
Bars Count – 显示历史记录。 Tooltip – 将鼠标悬停在对象上时是否显示工具提示。 Show Semaphore – 启用或禁用信号灯。 Show 123 – 启用或禁用显示 123 模式。
Period 1, 2, 3 - 信号周期。 Period 1, 2, 3 Visual – 启用或禁用单独周期的显示。
Arrow Coeff Period – 用于计算的条数。 Arrow Coeff – 平均烛台值的系

或 (TDO),它是一种使用“ 纯动量 ”原理衡量价格变化率的指数。
当证券价格从 10 上涨到 15 时,价格变化率为 150%,但当它从 15 回落到 10 时,价格变化率仅为 33.3%。这就是为什么像“价格变化率”(ROC) 或“动量”这样的技术分析指标给出的上升价格走势读数高于下降价格走势读数的原因。 TDO 解决了这个问题,以帮助交易者正确读取动量。
重要信息
TDO 用户手册: https://www.mql5.com/en/blogs/post/717970 TDO 常见问题: https://www.mql5.com/en/blogs/post/722015 TDO 视频库: https://www.mql5.com/en/blogs/post/722018 TDO Expert Advisor 示例: https://www.mql5.com/en/blogs/post/731141
TDO 特性
TDO 以百分比计算纯动量,因此它用于比较来自不同市场的不同证券。 (例如:将 EURUSD 与 Gold & Dow Jones Industrial 进行比较)

ADR 反轉指標一目了然地顯示當前價格相對於其正常平均每日範圍的交易位置。當價格超過您選擇的平均範圍和高於它的水平時,您將通過彈出窗口、電子郵件或推送獲得即時警報,以便您可以快速跳入回調和反轉。該指標在圖表上在平均每日範圍極值處繪製水平線,並在這些水平之上延伸,這些水平附加了價格超過它們的數學概率。下面的更多細節...... ADR 警報儀表板補充指標並監控所有配對也可在此處獲得: https://www.mql5.com/en/market/product/62756
MT5 版本也可在此處獲得: https://www.mql5.com/en/market/product/64477/
大約 60% 的時間價格在其正常的平均每日範圍 (ADR) 內交易並推高這些水平通常是價格急劇波動的指標,通常會出現回調(獲利了結)走勢。您可以通過交易從每日範圍的頂部或底部回落到最近的支撐位或阻力位來利用這些急劇波動。
收集了超過 20 年的歷史數據,以找出主要外匯對和一系列交叉盤的價格超出特定 ADR 水平的平均百分比。該數據表明價格僅在 3% 的時間內超過其 ADR 的 200%,這

Simple QM Pattern is a powerful and intuitive trading indicator designed to simplify the identification of the Quasimodo (QM) trading pattern. The QM pattern is widely recognized among traders for effectively signaling potential reversals by highlighting key market structures and price action formations. This indicator helps traders easily visualize the QM pattern directly on their charts, making it straightforward even for those who are new to pattern trading. Simple QM Pattern includes dynamic
FREE
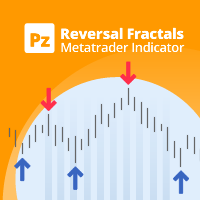
这是我著名的指标反转分形的最新版本,该指标在近十年前首次发布。它检查分形的价格结构以确定市场中可能的反转点,为已经拥有基本或技术估值模型的头寸交易者提供时机。 [ 安装指南 | 更新指南 | 故障排除 | 常见问题 | 所有产品 ] 反转分形可以开始长期趋势 指标不重绘
它实现了各种警报 可定制的颜色和尺寸 该指标是一个反应或滞后信号,因为分形是奇数条柱的形成,中间的柱是最高或最低的,并且当分形中的所有柱关闭时,指标绘制。但是,具有预先存在的方向偏差的交易者会发现该指标非常有用,可以提早进入点。 该指标不是简化的信号指标,也不是完整的交易系统。请不要这样评估或审查它。
输入参数 分形中的条:每个分形中的条数。必须是奇数,例如 3, 5, 7, 9, 11, 13, ...
最大历史柱线:指标加载时要评估的过去柱线的数量。
颜色:自定义箭头和线条的颜色和大小。 警报:启用或禁用各种警报。
支持 我很乐意提供免费产品,但由于我的时间有限,它们没有任何形式的支持。我很抱歉。
作者 Arturo López Pérez,私人投资者和投机者、软件工程师和 Point Zero Tradi
FREE

Reversal Zones Pro is an indicator specifically designed to accurately identify key trend reversal zones. It calculates the average true range of price movement from the lower to upper boundaries and visually displays potential zones directly on the chart, helping traders effectively identify important trend reversal points. Key Features: Reversal Zone Identification: The indicator visually displays potential reversal zones directly on the chart. This helps traders effectively identify importan

PROFESSIONAL FOOTPRINT CHART INDICATOR
A Footprint Chart is an advanced order flow visualization tool that displays the volume traded at each price level within a candlestick. Unlike traditional candlestick charts that only show open, high, low, and close prices, footprint charts reveal the battle between buyers and sellers at every price level. KEY CONCEPT: Footprint charts show WHERE volume occurred, not just HOW MUCH volume occurred. This is critical for understanding institutional activ
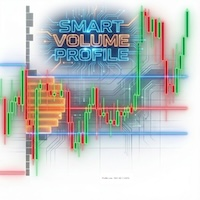
Chinese (Simplified) 扫描 "Smart Money" (成交量标记): 箭头指示异常成交量(高于平均水平),并以清晰的红/绿颜色区分。这有助于识别主力资金(Smart Money)的入场点,并过滤掉虚假信号。 关键警报 (Alerts): 无需时刻盯着屏幕。当价格穿越 POC 线(成交量控制点)时,系统会立即发出警报,这通常是决定趋势延续或反转的关键点。 即时市场结构 (Developing Profile): 显示当前正在形成的价格周期的分布图。让您一目了然地看到价格是正在脱离累积区,还是正在被拉回均值。 Chinese (Simplified) 该指标非常适合专注于 Price Action (价格行为) 和 Volume Analysis (量价分析) 的交易者,因为它能将普通的裸K图表转化为一张清晰的**“作战地图”**,直观地告诉您: 关键点位在哪里: (通过 Pivot 和 POC 判断) 谁在主导市场: (观察绿色/红色的成交量标记) 是否值得入场: (利用成交量与突破形态的相互验证)

特惠 : ALL TOOLS ,每个仅 $35 ! 新工具 在 发布首周 或 前 3 次购买 期间仅售 $30 ! Trading Tools Channel on MQL5 :加入我的频道获取最新动态 RSI Shift Zone Scanner 通过将 RSI 信号与价格行为联系起来,识别市场情绪可能变化的时刻。当 RSI 突破预设阈值(默认超买 70、超卖 30)时,指标会在图表上直接绘制通道。通道标记了情绪可能反转的区域,可视为潜在支撑或阻力。 查看 MT5 版本: RSI Shift Zone MT5 Scanner 更多产品: All P roducts 当 RSI 突破上/下阈值时,将生成新的通道。 通道边界固定在突破蜡烛的最高价和最低价,中线显示其平均值。 每个通道至少保留用户设定的条数(默认 15),仅保留显著变化。 颜色指示多头或空头背景。 Technical details 标准 RSI 计算(默认周期 14)。 检测 RSI 上穿上阈值和下穿下阈值。 通道绘制在主图,为历史情绪变化提供清晰地图。 达到最小条数且出现新通道后,旧区域消

It is FREE on EURUSD chart. All Symbols version! Contact me for any questions Introduction The breakout and retest strategy is traded support and resistance levels. it involves price breaking through a previous level. The break and retest strategy is designed to help traders do two main things, the first is to avoid false breakouts. Many false breakouts start with a candlestick that breaks out of a level but ends with an immediate candlestick that brings the price back into the level. The
FREE

我们的基本蜡烛图形态指标让识别主要蜡烛图形态变得前所未有的简单。只要看一眼图表,就能发现锤子、黄昏之星、三白兵等形态。凭借直观的界面和清晰的视觉提示,我们的指标可帮助您快速准确地识别交易机会/ MT5 版本
该指标的仪表盘扫描器:( Basic Candlestick Patterns Dashboard )
指标特点 准确性 : 自动识别主要蜡烛图形态,无需手动搜索。 自定义 : 根据自己的交易偏好调整参数,以适应自己的交易风格。
包括谐波形态 看涨形态 Hammer Inverse hammer Bullish engulfing Morning star 3 White soldiers 看跌形态 Hanging man Shooting star Bearish engulfing Evening star 3 Black crows
主要输入 Show only confirmed patterns :该选项允许仅显示已被蜡烛图确认的形态,建议将其设为默认值。 Max bars :计算指标时需要回溯的条数。 Pop-up alert: 向 MT4 终端发出警
FREE

MCAD stands for M ulti C urrency A ccumulation/ D istribution, so please don't confuse it with the well-known MACD. MCAD calculates relative strengths of Accumulation/Distribution of volumes for plain Forex currencies (that is their synthetic behaviour extracted from Forex pairs), market indices, CFDs and other groups of tickers. It uses standard Accumulation/Distribution formula ( Wikipedia's article ) and can apply it either to tick volumes, or to pseudo-real volumes ( volume surrogates , intr

该指标筛选每个柱的买入或卖出压力,并识别 4 种具有最高交易量的蜡烛形态。然后使用多个线性过滤器过滤这些蜡烛以显示买入或卖出信号。结合更高的时间框架方向以及在高交易量时段进行交易时,信号效果最佳。所有过滤器都是可定制的并且独立工作。单击按钮即可查看单个方向的信号。 该指标还包含最重要的价格行为和智能货币概念,可以帮助您的决策过程。 信号和交易教育集于一工具之中。
特征 : 信号不会重新绘制。 识别吞没蜡烛、拒绝蜡烛、扩展范围蜡烛和 Pinbar 蜡烛。 显示每个有效信号的多个入场点、止损和多个止盈水平。 按高容量会话进行过滤。 按支撑/阻力位和蜡烛结构过滤。 按 MACD 柱状图过滤。 ICT 买方和卖方流动性水平(亚洲突袭/伦敦突袭/犹大摇摆)。 洁净空间或间隙检测。 识别停止搜寻级别。 基于纯粹的价格行为自动绘制支撑/阻力位。 前一日高点和前日低点。 心理数字和整点、半点和四分之一点的图表水平。 显示基于动态移动平均线的价格交叉和回调。 每日开盘价。 识别 HH、HL、LL 和 LH 点。 内置蜡烛倒计时和符号传播。 内置损益信息面板。 私人导师小组访问。 包括教育、分析和支持

外汇市场概况(简称FMP) 这不是什么:
FMP 不是经典的字母编码 TPO 显示,不显示整体图表数据配置文件计算,并且不将图表分段并计算它们。
它能做什么 :
最重要的是,FMP 指示器将处理位于用户定义频谱左边缘和用户定义频谱右边缘之间的数据。 用户只需用鼠标拉动指示器的每一端即可定义频谱。 当指标右边缘被拉到实时柱并进一步(到未来)时,指标被认为是“实时的”(它会更新新柱) 该指标将一个“锚点”对象放在它所附加的图表上,然后将该锚点与硬盘驱动器上的文件相关联。 这允许您在图表上运行一个持续的 FMP,您的设置在重新启动时持续存在,直到图表 - 或指标 - 关闭。 FMP 指标可以在一个图表上运行多个自身实例,并且您可以命名它们。(名称在指标数据中显示为半透明,以便您能够区分它们) 指标的数据窗口被快速切换控件包围,当它们的状态发生变化时,这些控件会更新该图表的指标设置的“内存”。 左手柄、右手柄和数据窗口的显示可以自定义。您可以从 13 种不同的样式组合中进行选择,或者选择每个部分的单独样式(从 13 种中选择)。 您可以选择显示与光谱左侧对齐、在中间对称居中、与光谱右侧
FREE

Dark Support Resistance is an Indicator for intraday trading. This Indicator is programmed to identify Support and Resistance Lines , providing a high level of accuracy and reliability.
Key benefits
Easily visible lines Only the most important levels will be displayed Automated adjustment for each timeframe and instrument Easy to use even for beginners Never repaints, never backpaints, Not Lag 100% compatible with Expert Advisor development All types of alerts available: Pop-up, Email, Push

Introducing the Delta Volume Profile Indicator - Unleash the Power of Institutional Precision! Technical Indicator: Are you ready to trade like the pros? The Delta Volume Profile Indicator is no ordinary tool. It’s a high-precision, cutting-edge indicator that puts the power of institutional-grade trading in your hands. This unique indicator analyses delta volume distribution in real-time, revealing the market's hidden buy/sell imbalances that the biggest financial institutions rely on to antic

A trend indicator based on the Hull Moving Average (HMA) with two periods. The Hull Moving Average is an improved variant of the moving average, which shows the moment of trend reversal quite accurately. It is often used as a signal filter. Combination of two types of Hull Moving Averages makes a better use of these advantages: HMA with a slow period identifies the trend, while HMA with a fast period determines the short-term movements and signals in the trend direction.
Features The movement d
FREE
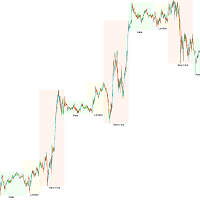
交易时段 KillZone —— 掌握市场时间的力量
成功的交易者都明白一个真理:时机就是一切。不同的交易时段带来不同的活跃度、波动性和机会。为了帮助您清晰掌握并利用这些变化,我们开发了 交易时段 KillZone 指标。 该指标会高亮显示亚洲、伦敦和纽约时段的活跃时间,让您完整了解市场最活跃的时刻。您可以自由定制显示效果 —— 显示或隐藏特定时段、添加或移除时段名称、更改颜色,甚至设定图表上可见的 KillZone 数量。 开始非常简单:将指标复制到 MetaTrader 5 文件夹,加载到图表上,即可立刻看到交易时段的分布。通过个性化设置,您随时掌握最佳交易时机。 交易时段 ICT KillZone 指标 不仅仅是一个视觉工具,而是帮助您理解全球市场节奏、提升交易精度的实用助手。若您想要精准把握入场时机,这个指标(结合合适的经纪商)将为您带来真正的优势。
FREE

Apollo Pips 是用于交易任何货币对的高度准确的趋势反转指标。它最初是为交易 XAUUSD 而开发的,但实践表明该指标可以成功地用于其他货币对. 推荐时间框架 H1. 但该指标也可以与其他时间框架一起使用。只需尝试不同的图表即可找到合适的交易对和交易时间框架。 从技术上讲,该指标绝对可以用于任何时间框架和货币对。您可以交易货币、金属、石油、股票、加密货币。 只有当信号被确认时,指示器才会发出警报。因此,如果您看到警报,您可以安全地使用接收到的信号. 指标不会重新绘制其信号!箭头可能会闪烁,直到信号被确认。确认信号后,箭头不再改变位置! 购买后,一定要写信给我!我将与您分享使用该指标的建议。还有丰厚的红利等着你!

The Trend_Scalper_Arrows_Entry&Exit trend indicator perfectly follows the trend, indicates entry search zones, indicates entry signals with arrows, and also indicates zones for fixing market orders with vertical lines. An excellent indicator for both beginners in Forex trading and professionals.
All lines, arrows, alerts can be disabled.
See all indicator parameters on the screenshot.

Introducing the Volume Order Blocks indicator, a game-changing tool designed for traders who demand precision and clarity in their market analysis. This advanced indicator not only identifies order blocks but also integrates crucial volumetric data, allowing you to gauge the strength of these blocks with unparalleled accuracy. MT5 version - https://www.mql5.com/en/market/product/121238/ Key Features of the Volume Order Blocks: Bullish & Bearish Order Blocks: Easily visualize and dif

多时间框架供需直方图
描述:
多时间框架供需直方图是一款强大且简洁的指标,可显示多个时间框架(特别是 H4 和 D1)下的市场供需强度。它通过直方图突出显示买方或卖方的主导地位,使交易者能够快速识别关键的市场压力区域。 主要特点: H4 与 D1 直方图: 清晰展示高时间框架的市场力量。 直方图变化提醒: 可选通知,当供需发生变化时提醒交易者。 图表整洁: 仅关注最重要的信号,避免杂乱。 可自定义显示: 可启用或禁用各时间框架的直方图,可选择是否接收提醒。 推荐使用 15 分钟图表: 非常适合日内波段交易设置。 与 Ultimate Scalpers Zone 指标结合效果最佳: 多重确认交易信号。 优势: 快速识别高概率支撑和阻力区域。 一眼掌握多时间框架的市场动量。 为活跃交易者提供清晰、精确且可操作的见解。
FREE
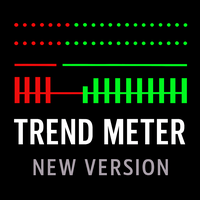
用于 MetaTrader 4 的多货币趋势分析指标,可在多个时间周期上显示趋势方向和趋势强度。仅用于分析。 TREND METER – 多货币趋势分析指标 (MT4) Trend Meter 是一种技术趋势分析指标,用于在多个时间周期和交易品种上可视化趋势方向、趋势强度和趋势一致性。 该指标仅用于可视化分析,不会自动执行交易。 概念 市场趋势可能因时间周期和交易品种而异。
Trend Meter 将多个内部趋势计算结果整合,并以紧凑的可视化形式显示,帮助快速评估市场状况。 该指标关注: 是否存在趋势 趋势方向 相对趋势强度 多个趋势模块之间的一致性 指标结构 Trend Meter 由三个独立的趋势模块组成: Trend Meter 1 对趋势变化反应较早 对短期变化更敏感 Trend Meter 2 主要趋势逻辑 中等灵敏度 适用于短线和日内分析 Trend Meter 3 更强的过滤 仅显示较清晰的趋势条件 每个模块都可以单独启用或禁用。
用户可以观察有多少趋势模块方向一致。 多时间周期与多品种支持 多时间周期分析 兼容所有 MT4 品种 无重绘 CPU 占用低 自定义

Gold Trend M1 - Optimized Scalping Tool for Gold (XAUUSD) Gold Trend M1 is a high-frequency trading indicator for the MetaTrader 4 platform, specifically optimized for the M1 timeframe on the Gold market. It combines a powerful SuperTrend trend filter with buy/sell signals derived from Heiken Ashi calculation logic, helping traders identify precise and disciplined entry points for optimal trading performance.
Key Features Optimized for M1 Scalping: Specifically developed for high-speed scalping

描述(MT4)
该指标检测价格在烛台突破布林带外之后重新进入带内的时刻(ReEntry),并可选地结合 RSI 确认以减少虚假信号。
当价格先跌破下轨后回到带内时,会产生 买入 ReEntry(Buy ReEntry) 信号,可选地确认 RSI 刚刚退出超卖区域。
当价格先突破上轨后再回到带内时,会产生 卖出 ReEntry(Sell ReEntry) 信号,可选地确认 RSI 刚刚退出超买区域。
信号在图表上以箭头标记,略微偏置绘制在高点/低点之外以增强可见性。 主要特性 手动计算布林带(简单移动平均 + 标准差)。 可选的 RSI 过滤器用于确认有效的 ReEntry(从超卖/超买中退出)。 基于价格在外部游走后回归带内的买/卖 ReEntry 信号。 买卖信号使用不同箭头区分显示。 完全可配置的参数:布林带周期、偏差、RSI 周期、超买/超卖阈值、时间框架。 采用 MT4 传统的 RSI 实现(每个 shift 用 iRSI 读取),若 RSI 不可用或不可靠,智能回退不会阻塞信号。 时间框架说明:如果分析的时间框架与图表不同,时间对齐是基础的;在多时间框架场景下,信号在时间上
FREE

Vital Structure MT4 用于市场结构分析的指标:HH / HL / LH / LL 摆动标注、自动趋势线,以及多时间周期(MTF)支撑与阻力关键水平。 Vital Structure 是一款面向使用价格行为(Price Action)、市场结构、趋势线、支撑阻力和多时间周期分析的交易者的图表分析工具。它可识别已确认的摆动点,按结构(HH/HL/LH/LL)进行分类,绘制基于结构的趋势线,并绘制更高时间周期的关键水平,帮助可视化趋势与重要的价格反应区域。 主要功能 1) 市场结构(HH / HL / LH / LL) 使用可配置的回看窗口(lookback window)检测摆动高点与摆动低点 将摆动分类为:更高高点(HH)/ 更低高点(LH)/ 更高低点(HL)/ 更低低点(LL) 可选:摆动箭头与文字标签 可选:基于 ATR 的过滤,以在高波动市场中减少较小摆动 2) 自动趋势线(基于结构) 从最近的摆动点构建趋势线 根据检测到的结构绘制上升趋势线或下降趋势线 当趋势线被突破时,可保留历史线(虚线样式),并继续寻找新的趋势线 3) MTF 支撑与阻力关键水平 扫描高于
FREE

The Hydra Multi Trend Dashboard is a powerful market scanning tool designed for MetaTrader 4 and MetaTrader 5. It monitors up to 25 currency pairs or assets simultaneously across all 9 standard timeframes (M1 to Monthly). Using a proprietary Special Trend Formula , the dashboard filters out market noise and provides clear, visual Bullish or Bearish signals, allowing traders to identify trend alignments at a glance without switching charts. Setup & Guide:
Download MT5 Version here. Exclusivel

Contact me after payment to send you the User-Manual PDF File.
Triangle Pattern
Sometimes the price cannot make higher highs or lower lows and it moves in a converging price range and waves are shorter than before until the movement creates a geometric shape of a symmetrical triangle, which indicates It is maybe the end of the trend. The triangle pattern is a well-known in forex and the trading plan and strategy of many traders is based on it.
The Triangle Pattern Scanner Indicator It is usu

自动化艾略特波浪理论 (Automated Elliott Wave) 1. 自动数浪并减少主观偏见 (客观性) 通常,艾略特波浪的计数往往带有很强的“主观想象”或个人观点。该指标通过以下方式提供帮助: 寻找推动浪 (Impulse Wave 1-2-3-4-5): 使用严格的规则(例如:第3浪不能是最短的,第4浪不能与第1浪重叠),为您展示理论上正确的价格结构。 寻找调整浪 (Corrective Wave A-B-C): 帮助捕捉价格回调的时机,以便顺势再次入场。 2. 多层次分析 (Multi-Degree Analysis) 该指标不仅仅关注单一时间框架,而是同时分析3个深度的波浪级别,提供3D市场视图: 微浪 (Minor): 用于观察快速波动。 中浪 (Intermediate): 用于观察主要趋势。 主浪 (Primary): 用于观察市场大局。 优点: 您可以根据自己的交易风格开启或关闭每个级别的显示。 3. 寻找价格目标和入场点 (Targeting & Entry) 当系统发现完整的波浪时,它不仅会标记波浪,还会帮助制定交易计划: 斐波那契预测 (Fibonacci

移动平均货币强度仪表板 是一个强大而全面的指标,可以深入了解多个交易品种和时间范围内的货币动量。这个强大的工具利用移动平均线来识别最新的交叉点,并有效地跟踪当前价格的货币强度。凭借其直观的设计和用户友好的界面,该仪表板为寻求做出明智决策的交易者提供了大量信息。
该仪表板的主要功能之一是它能够在扫描仪模式下运行,允许用户扫描市场以寻找潜在机会。该指标的综合仪表板将所有信号显示为按钮,使您可以方便地访问所需的信息。只需单击按钮即可打开带有交叉线的新图表,该交叉线可更详细地显示信号。此外,组模式功能可以显示组织成组的符号,提供货币关系的结构化视图。
通过可定制的参数,移动平均货币强弱仪表板可以满足个人交易偏好。交易者可以选择不同的点值计算方法,例如使用蜡烛的开盘价或收盘价,甚至移动平均线本身。这种灵活性确保了该指标与不同的交易策略保持一致。
为了增强用户体验,仪表板的设计考虑了视觉美感。代表货币对和时间范围的按钮以清晰且有组织的方式显示,并具有可定制的颜色和字体设置。看涨、看跌和中性信号在视觉上有所区别,使市场趋势一目了然。该指标还提供各种警报选项,包括弹出警报、移动通知、电子邮件警

您是否厌倦了在图表上手动绘制斐波那契水平?您是否正在寻找一种方便有效的方法来确定交易中的关键支撑位和阻力位?别再犹豫了! 隆重推出 DrawFib Pro,这是一款可自动执行 ibonacci 水平的 终极 MetaTrader 4 指标 在图表上绘制,并在突破这些水平时及时发出警报。借助 DrawFib Pro,您可以增强交易策略、节省时间并做出更明智的决策。 我的斐波那契指标: WH Advanced Gartley Pattern MT4 || WH Price Wave Pattern MT4 主要特征:
自动化 斐波那契绘图. 可定制 参数 . 准确的 和 可靠的. 实时 警报. 用户 友好 接口 . 对于任何寻求高效、可靠且用户友好的方式在图表上自动绘制斐波那契的交易者来说,DrawFib Pro 是必备工具。 DrawFib Pro 能够提供实时警报并支持各种时间范围,使交易者能够做出更准确、更及时的决策。节省宝贵的时间和精力,同时提高您的交易绩效。立即使用 DrawFib Pro 释放自动斐波那契分析的力量!
FREE

Introducing our exciting new Price Retest indicator! Get instant alerts when the price retests, giving you a powerful edge in your trading strategy. Remember to do your own analysis before making any moves in the market. MT5 Version - https://www.mql5.com/en/market/product/118159/ Join To Learn Market Depth - https://www.mql5.com/en/channels/suvashishfx
Here’s a detailed explanation of how the Price Retest indicator works, its components, and how you can incorporate it into your trading str
FREE

Dashboard for Ma Speedometer: https://www.mql5.com/en/market/product/116784
Non standard attitude to the standard moving average indicator. The essence of the indicator is to determine the strength and speed of the price direction by determining the tilt angle of the moving average. A point is taken on the fifteenth MA candle and a point on the last closed MA candle, a straight line is drawn between them, it is movable and on a hemisphere shows an angle of inclination from 90 degrees to -90. a

多时间框架锯齿形调整浪指标。 它显示支撑/阻力水平线及其突破,并绘制当前的市场目标。 它还可以显示分形指标的线条和其他时期(最多季度)的蜡烛。指标——连接关键低点和高点以显示趋势线。
该指标重新绘制最后一个(当前)点,并且在某些情况下可以更改最后 2-3 个点。
所有线条均绘制为对象(不是指标缓冲区,但有可能接收 EA 的数据)。 在 Expert Advisor 中使用时,您可以使用 iCustom 读取 ZigZag 点。
设置 Mode — 根据计算支撑位和阻力位 — Zig Zag — ZigZag 指标; — ZigZag Close — 之字折线收盘指标; — Fractals — 分形指标; — High-Low of the period — 通过高低水平构建指标。 时间范围在Period参数中指定; — Candles only — 仅绘制蜡烛; Depth — 如果最后一根蜡烛的偏差小于(或大于)前一根,则 Zigzag 将不会绘制第二个最大值(或最小值)的烛台的最小数量; Deviation — 锯齿形形成局部顶部/底部的两个相邻烛台的最高点/最
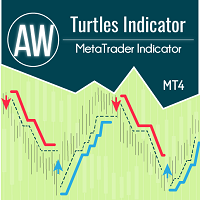
该指标根据海龟系统工作,通常假设时间间隔为 20 到 55 根蜡烛。在给定时间间隔内监视趋势。在突破支撑位或阻力位时进场。退出信号是价格突破同一时间区间趋势的相反方向。 优点:
工具:货币对、股票、商品、指数、加密货币 时间范围:经典 D1,也适用于任何时间范围 交易时间:全天候 资金管理策略:每笔交易风险不超过1% 使用追加订单时,每增加一个仓位的风险为0.25% MT5 indicator version -> HERE / AW Turtles EA MT4 -> HERE / More products -> HERE 参赛规则: 1)较短的条目: 入场条件是突破 20 日高点或低点。
如果先前的信号成功,则跳过交易。
笔记!如果之前的交易以盈利结束,我们会跳过入场。如果突然发现突破有利可图,那么稍后突破55日通道后我们就进场。 当价格突破该通道时,我们进入交易。 2)长期进场(如果由于上述原因错过了20日突破): 价格突破唐奇安通道的 55 天高点或低点。 笔记!在方法 2 中,不使用前一笔交易的过滤器,我们总是输入。 退出策略: 止损 1) 在经典版本
FREE

ADX arrow
该指标将 ADX indicator (平均方向移动指数)的信号显示为图表上的点。
这便于信号的视觉识别。 该指示器还具有警报(弹出消息框)和向电子邮件发送信号。
参数 Period -平均周期。 Apply to -用于计算的价格:关闭,开放,高,低,中位数(高+低)/2,典型(高+低+关闭)/3,加权关闭(高+低+关闭+关闭)/4。 Alert -启用/禁用警报。 EMail -启用/禁用向电子邮件发送信号。 Period - averaging period. Apply to - price used for calculations: Close, Open, High, Low, Median (high+low)/2, Typical (high+low+close)/3, Weighted Close (high+low+close+close)/4. Alert - enable/disable alerts. EMail - enable/disable sending s

Title: SMC Structure for EURUSD Description: This indicator is designed to map market structures based on Smart Money Concepts (SMC). It identifies Swing Structure, Internal Structure, Order Blocks, and Fair Value Gaps (FVG). The tool is optimized for performance to manage resources efficiently on the MetaTrader platform. Key Features: 1. Market Structure Mapping Identifies Major Swing Structure with BOS (Break of Structure) and CHoCH (Change of Character). Displays Internal Structure to visual
FREE

The Key level wedge indicator automatically draws rising wedge pattern and falling wedge pattern for you on the chart. This pattern is really good when used as a confirmation entry at key support & resistance, supply & demand and reversal zones.
Advantages
The Key level wedge block DOES NOT RE-PAINT, giving you confidence when a signal appears and also helps when looking back. The Key level wedge includes an on/off button on the chart to easily keep the charts clean after analysis by just o
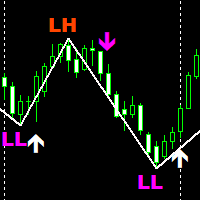
SMC Traders is a non-repaint indicator that is based on Price Action The indicator uses current market structure to predict future reversals. The indicator can be used with our free Market structure zig zag which can be found here: https://www.mql5.com/en/market/product/91579 Please note to find the HH AND HL CLINK ON LINK ABOVE Timeframes: 15 minutes for scalping 1 Hour for swing trading Purple Arrow look for sells in conjunction with LL White Arrow look for buys in conjunction with HL
FREE

移动平均收敛发散(MACD)交易策略是一种流行的技术分析工具,用于识别动量和趋势方向的变化。MACD的计算方法是将26期指数移动平均线(EMA)减去12期EMA。然后在MACD上方绘制一个9期EMA,称为“信号线”,以充当买入和卖出信号的触发器。 当MACD线在信号线上方时,MACD被认为处于看涨区域,在下方时处于看跌区域。交易者经常使用这些信息来确定潜在的买入和卖出机会。 MACD是一种多功能指标,可以用多种方式使用,其中一些常见的用法包括: 交叉:当MACD线穿过信号线时,出现看涨交叉;当MACD线穿过信号线下方时,出现看跌交叉。 发散:当MACD正在创造新高时,而基础证券没有创造新高时,出现看涨发散;当MACD正在创造新低时,而基础证券没有创造新低时,出现看跌发散。 趋势跟踪:当MACD在零线上方时,出现看涨趋势;当MACD在零线下方时,出现看跌趋势。 需要注意的是,MACD是一种滞后指标,应与其他技术指标和分析结合使用才能做出交易决策。
FREE

Gendel Gendut is Binary Option Indicator From @realTatino Trade with expaired time Pairs : All Forex Pair Time Frame : M5 only Trade Time All Time Alert : Alert Message, Alert Email, Alerts Push Buffer : 4 Buffer (0,2 (Buy) || 1,3 (Sell) Broker Suitable : All Broker Binary With Forex Pair Auto Trade : Yes Repaint : NO Delay : NO Other Binary Indicator : https://www.mql5.com/en/market/product/70915 https://www.mql5.com/en/market/product/71054
https://www.mql5.com/en/market/product/57755
etc IND
MetaTrader市场是您可以下载免费模拟自动交易,用历史数据进行测试和优化的唯一商店。
阅读应用程序的概述和其他客户的评论,直接下载程序到您的程序端并且在购买之前测试一个自动交易。只有在MetaTrader市场可以完全免费测试应用程序。
您错过了交易机会:
- 免费交易应用程序
- 8,000+信号可供复制
- 探索金融市场的经济新闻
注册
登录