YouTube'dan Mağaza ile ilgili eğitici videoları izleyin
Bir alım-satım robotu veya gösterge nasıl satın alınır?
Uzman Danışmanınızı
sanal sunucuda çalıştırın
sanal sunucuda çalıştırın
Satın almadan önce göstergeyi/alım-satım robotunu test edin
Mağazada kazanç sağlamak ister misiniz?
Satış için bir ürün nasıl sunulur?
MetaTrader 4 için teknik göstergeler - 4

Version 1.6 ! Volume Strength 28 is better , easier to use and more awesome ! Based on complaint we got from the reviews, we understood many don't know how to really use the time frame setting on the input menu thus they have complaints of volatility, thus we have designed an Automatic Time Frame selection system that is suitable for novice traders.! The design of the indicator has been changed along with some calculation metrics. Based on complaints of high volatility we have been getting ,we

Gösterge, üç dönemlik bir semafor ve ekstremumdan 123 ters dönüş formasyonu oluşturur. Sinyal ikinci mumun açılışında gelir. Bu formasyon farklı şekillerde alınıp satılabilir (test noktası 3, kırılma ve diğerleri). Kanaldan çıkış veya trend çizgisinin kırılması, bir giriş noktası bulmak için ana tetikleyicidir. Simgeler Fibonacci seviyelerine göre renklendirilmiştir. Sarı simgeler, sinyalin güçlendirildiği bir seviyenin test edildiğini gösterir. Çoklu para birimi kontrol panelini kullanarak 123

Have you ever asked yourself why your supply and demand zones fail , even when everything looks “perfect”? The truth is, you're not wrong — you're just watching the reaction, not the reason. It's not like those random currency strength meters that rely on lagging indicators like RSI, CCI, or similar tools mashed together to guess strength or weakness. That approach reacts to the past — not the cause. Pairs like EURUSD or USDJPY are just the outcomes . The real drivers? Currency indices and inst

Temel Renko göstergesi, net ve özlü bir piyasa perspektifi arayan yatırımcılar için güçlü bir araçtır. Göstergemiz yalnızca trend görselleştirmeyi basitleştirmekle kalmaz, aynı zamanda tersine dönüşler için doğru uyarılar sunarak ticaretinizde stratejik bir avantaj sağlar / Ücretsiz MT5 Sürümü
Özellikler Tamamen Özelleştirilebilir: Gelişmiş özelleştirme seçenekleriyle göstergeyi iş tercihlerinize göre uyarlayın. Renklerden kutu boyutu ayarlarına kadar, bilgilerin grafiğinizde nasıl görüntülen
FREE
TW Trend Sniper: En iyi trend stratejisi
Gelişmiş teknik analiz tekniklerinin akıllı bir kombinasyonunu kullanan TW Trend Sniper göstergesi, piyasa trendlerini doğru bir şekilde belirlemenize ve karlı işlemler için zamanında sinyaller almanıza yardımcı olur. Trade Wizards'ın tescilli formülü, Fiyat Hareketi analizi, Fibonacci seviyeleri ve diğer teknik analiz araçlarıyla birlikte size kesin ve güvenilir işlem sinyalleri sağlar. Bu gösterge, profesyonel tüccarlar ve yetenekli programcıların işb
This indicator analyzes in parallel price charts for multiple currency pairs on all timeframes and notifies you as soon as a double tops or double bottoms pattern has been identified.
Definition Double Top / Double Bottom pattern Double Top is a trend reversal pattern which are made up of two consecutive peaks that are more and less equal with a trough in-between. This pattern is a clear illustration of a battle between buyers and sellers. The buyers are attempting to push the security but are

Protect against whipsaws: revolutionize your swing trading approach Swing Trading is the first indicator designed to detect swings in the direction of the trend and possible reversal swings. It uses the baseline swing trading approach, widely described in trading literature. The indicator studies several price and time vectors to track the aggregate trend direction and detects situations in which the market is oversold or overbought and ready to correct. [ Installation Guide | Update Guide | Tro

[The Ultimate Evolution] ONI STRENGTH v20.01: Abandon Analysis, Focus on Execution ONI STRENGTH has evolved even further. The transformation from the initial version to the current v15.00 is dramatic. It has evolved from a mere "information display tool" into a "signal-driven weapon" that tells you exactly when to win. Before diving into the features, here is how we perfected this tool: Logic Evolution: From contradictory signals to "Sync Logic." No more entering when strength and price disagre

Trend ile Uyumlu İşlemlerinizi H4 & M30 Turning Point PRO ile Maksimize Edin! Tahmin ve grafik karmaşasına elveda deyin. Bu premium gösterge, yüksek zaman dilimlerinde trend tespiti ile kısa vadeli dönüş noktası sinyallerini birleştirerek size net alım ve satım fırsatları sunar. Tüccarlar Neden Seviyor: H4 EMA200 Trend Eğilimi: Baskın trendi anında görün. Sadece trend yönünde işlem yapın. M30 İşlem Okları: Trend, yapı ve volatilite ile doğrulanan yüksek olasılıklı dönüş noktalarını bekleyin. Akı

Apollo Pips , herhangi bir döviz çiftinde işlem yapmak için son derece doğru bir trend tersine çevirme göstergesidir. Başlangıçta XAUUSD ticareti için geliştirilmiştir, ancak uygulama, göstergenin diğer çiftlerde başarıyla kullanılabileceğini göstermiştir. Önerilen zaman çerçevesi H1. Gösterge, yalnızca sinyal onaylandığında uyarı verir. Bu nedenle, bir uyarı gördüyseniz, alınan sinyali güvenle kullanabilirsiniz. Gösterge sinyallerini YENİDEN ÇİZİMİYOR! Ok, sinyal onaylanana kadar yanıp sönebili

GoldRush Trend Ok Sinyali
GoldRush Trend Ok Sinyali göstergesi, XAU/USD'de yüksek hızlı, kısa vadeli scalperlar için özel olarak tasarlanmış hassas, gerçek zamanlı trend analizi sağlar.
1 dakikalık zaman dilimi için özel olarak tasarlanan bu araç, net giriş noktaları için yön okları gösterir ve scalper'ların değişken piyasa koşullarında güvenle hareket etmelerini sağlar.
Gösterge, PRIMARY ve SECONDARY uyarı oklarından oluşur. PRIMARY sinyalleri, trend yönündeki değişikliği gösteren Beyaz ve

Professional Histogram (PH), Forex, CFD'ler ve ikili opsiyon ticareti yapmak için oldukça verimli ve güvenilir bir araçtır.
PH, hem yeni başlayanlar hem de deneyimli tüccarlar için kullanımı ve yapılandırması kolaydır.
Çoğu göstergenin aksine, Professional Histogram daha uzun trendler bulur ve daha az yanlış sinyal verir.
Bir alım veya satım sinyali göründüğünde, zamanında bir pozisyon açmanıza ve her zaman PC'nizin başında oturmaktan kaçınmanıza olanak tanıyan bir uyarı tetiklenir.
Ticar

Introducing Order Blocks Breaker , a brand-new way to identify and leverage order blocks in your trading strategy. After developing multiple order block tools with unique concepts, I’m proud to present this tool that takes things to the next level. Unlike previous tools, Order Blocks Breaker not only identifies order blocks but also highlights Breaker Order Blocks —key areas where the price is likely to retest after a breakout. MT5 - https://www.mql5.com/en/market/product/124102/ This tool inco

Special offer : ALL TOOLS , just $35 each! New tools will be $30 for the first week or the first 3 purchases ! Trading Tools Channel on MQL5 : Join my MQL5 channel to update the latest news from me Supertrend Fakeout Göstergesi, klasik Supertrend göstergesinin geliştirilmiş bir versiyonudur ve daha güvenilir trend sinyalleri sunmak için tasarlanmıştır. Fakeout Index Limit ve Fakeout ATR Mult gibi gelişmiş özellikler sayesinde, bu gösterge kısa vadeli fiyat dalgalanmaları veya piyas
FREE
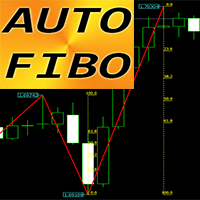
"Otomatik FIBO" Kripto-Forex göstergesi, alım satımda harika bir yardımcı araçtır!
- Gösterge, Fibo seviyelerini ve yerel trend çizgilerini (kırmızı renk) otomatik olarak hesaplar ve grafik üzerine yerleştirir. - Fibonacci seviyeleri, fiyatın tersine dönebileceği önemli alanları gösterir. - En önemli seviyeler %23,6, %38,2, %50 ve %61,8'dir. - Ters scalping veya bölgesel grid ticareti için kullanabilirsiniz. - Otomatik FIBO göstergesini kullanarak mevcut sisteminizi geliştirmek için birçok fır

A trend indicator based on the Hull Moving Average (HMA) with two periods. The Hull Moving Average is an improved variant of the moving average, which shows the moment of trend reversal quite accurately. It is often used as a signal filter. Combination of two types of Hull Moving Averages makes a better use of these advantages: HMA with a slow period identifies the trend, while HMA with a fast period determines the short-term movements and signals in the trend direction.
Features The movement d
FREE

TMA Currency Meter is the ultimate currency meter. Based on the Triangular Moving Average of all available symbols, this indicator shows which currencies are strong, strengthening, weak or weakening. Experienced as well as novice traders will see the strong and weak currencies in the blink of an eye, and know which trade possibilities to explore further. TMA Currency Meter is a true Multi Timeframe indicator. It is easy to show the currency strengths for a higher timeframe than the chart timefra

Looking for a powerful yet lightweight swing detector that accurately identifies market structure turning points?
Want clear, reliable buy and sell signals that work across any timeframe and any instrument?
Buy Sell Arrow MT Swing is built exactly for that — precision swing detection made simple and effective. This indicator identifies Higher Highs (HH) , Higher Lows (HL) , Lower Highs (LH) , and Lower Lows (LL) with remarkable clarity. It is designed to help traders easily visualize market str

Special offer : ALL TOOLS , just $35 each! New tools will be $30 for the first week or the first 3 purchases ! Trading Tools Channel on MQL5 : Join my MQL5 channel to update the latest news from me ICT’nin Inversion Fair Value Gap (IFVG) konseptinin gücünü Inversion Fair Value Gaps Indicator ile keşfedin! Bu son teknoloji araç, Fair Value Gaps (FVG) analizini bir adım öteye taşıyarak ters çevrilmiş FVG bölgelerini tanımlar ve gösterir — fiyat düzeltmesinden sonra oluşan önemli dest

ICT, SMC, Akıllı Para Kavramı, Destek ve Direnç, Trend Analizi, Fiyat Hareketi, Piyasa Yapısı, Emir Blokları, Kırıcı Bloklar, Momentum Değişimi, Güçlü Dengesizlik, HH/LL/HL/LH, Adil Değer Boşluğu, FVG, Prim ve İndirim Bölgeleri, Fibonacci Retracement, OTE, Alış Tarafı Likidite, Satış Tarafı Likidite, Likidite Boşlukları, Piyasa Oturumları, NDOG, NWOG, Gümüş Mermi, ict şablonu
Finansal piyasada doğru piyasa analizi yatırımcılar için çok önemlidir. Yatırımcıların piyasa trendlerini ve likiditeyi d

Title: SMC Structure for EURUSD Description: This indicator is designed to map market structures based on Smart Money Concepts (SMC). It identifies Swing Structure, Internal Structure, Order Blocks, and Fair Value Gaps (FVG). The tool is optimized for performance to manage resources efficiently on the MetaTrader platform. Key Features: 1. Market Structure Mapping Identifies Major Swing Structure with BOS (Break of Structure) and CHoCH (Change of Character). Displays Internal Structure to visual
FREE
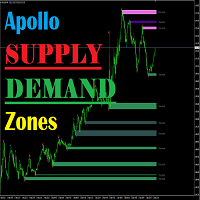
Apollo Arz Talep Bölgeleri, destek ve direnç seviyelerini hesaplayan bir göstergedir. Gösterge, hangi stratejiyi kullandıklarına bakılmaksızın kesinlikle tüm tüccarlar için faydalı olacaktır. Bu gösterge, ticaret sisteminizin ana unsurlarından biri olabilir. Gösterge, hem mevcut zaman dilimindeki seviyeleri hesaplar hem de MTF modunda çalışarak daha yüksek bir zaman dilimindeki seviyeleri gösterir. Bu gösterge kesinlikle herhangi bir zaman diliminde ve herhangi bir ticaret aracıyla kullanılabili

Simple QM Pattern is a powerful and intuitive trading indicator designed to simplify the identification of the Quasimodo (QM) trading pattern. The QM pattern is widely recognized among traders for effectively signaling potential reversals by highlighting key market structures and price action formations. This indicator helps traders easily visualize the QM pattern directly on their charts, making it straightforward even for those who are new to pattern trading. Simple QM Pattern includes dynamic
FREE
Volumatic Fair Value Gaps is a precision-engineered indicator for identifying, analyzing, and visualizing Fair Value Gaps (FVGs) backed by volume intelligence. This tool goes beyond standard FVG plotting by dissecting volume dynamics inside each gap using lower-timeframe sampling , offering clear insight into whether bulls or bears dominate the imbalance. Designed for technical traders, this indicator overlays high-probability gaps only, visualizes bullish vs. bearish volume compositio

Elliott Wave Trend was designed for the scientific wave counting. This tool focuses to get rid of the vagueness of the classic Elliott Wave Counting using the guideline from the template and pattern approach. In doing so, firstly Elliott Wave Trend offers the template for your wave counting. Secondly, it offers Wave Structural Score to assist to identify accurate wave formation. It offers both impulse wave Structural Score and corrective wave Structure Score. Structural Score is the rating to sh

ADX göstergesi trendi ve gücünü belirlemek için kullanılır. Fiyatın yönü +DI ve -DI değerleriyle, ADX değeri ise trendin gücünü gösterir. +DI -DI'nin üzerindeyse piyasa yükseliş trendindedir, tam tersi ise düşüş trendindedir. ADX 20'nin altında ise kesin bir yön yoktur. Gösterge bu seviyeyi kırdığı anda orta güçte bir trend başlıyor. 40'ın üzerindeki değerler güçlü bir trendi (düşüş trendi veya yükseliş trendi) gösterir.
Ortalama Yönlü Hareket Endeksi (ADX) göstergesinin çoklu para birimi ve ç
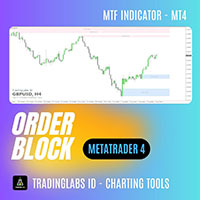
Order Block + Fair Value Gap (FVG) Indicator Multi-Timeframe Order Block + FVG Tool In the ICT (Inner Circle Trader) concept, Order Blocks (OB) + Fair Value Gaps (FVG) are among the most critical areas used by professional traders to read market structure, identify supply & demand zones, and spot high-probability entry points. The Order Block + FVG Indicator automatically detects and displays both Order Block zones and Fair Value Gaps directly on your MT4 charts. With multi-timeframe support, yo
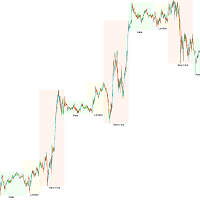
İşlem Seansı KillZone — Piyasa zamanlamasının gücünü açığa çıkarın
Başarılı trader’lar bir gerçeği bilir: zamanlama her şeydir. Her işlem seansı farklı aktivite, volatilite ve fırsatlar sunar. Bu değişimleri net görmek ve değerlendirmek için Trading Session KillZone Göstergesi’ni geliştirdik. Bu gösterge, Asya, Londra ve New York seanslarının aktif saatlerini öne çıkarır ve size piyasanın en canlı olduğu zamanların tam resmini sunar. Görünümü kişiselleştirebilirsiniz — belirli seansları göster/
FREE
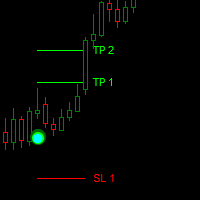
Dark Point is an Indicator for intraday trading. This Indicator is based on Trend Following strategy, also adopting the use of the atr to determine the right volatility. We can enter in good price with this Indicator, in order to follow the strong trend on the current instrument. If you love Dark Point, consider adding some power: Dark Power
Key benefits
Easily visible take profit/stop loss lines Intuitive directional points/arrows by colors Useful statistics , which indicate the win ra
FREE

It is FREE on EURUSD chart. All Symbols version! Contact me for any questions Introduction The breakout and retest strategy is traded support and resistance levels. it involves price breaking through a previous level. The break and retest strategy is designed to help traders do two main things, the first is to avoid false breakouts. Many false breakouts start with a candlestick that breaks out of a level but ends with an immediate candlestick that brings the price back into the level. The
FREE

PROFESSIONAL FOOTPRINT CHART INDICATOR
A Footprint Chart is an advanced order flow visualization tool that displays the volume traded at each price level within a candlestick. Unlike traditional candlestick charts that only show open, high, low, and close prices, footprint charts reveal the battle between buyers and sellers at every price level. KEY CONCEPT: Footprint charts show WHERE volume occurred, not just HOW MUCH volume occurred. This is critical for understanding institutional activ

OrderFlow Absorption – MT4 için Profesyonel Delta ve Absorpsiyon Sinyal Göstergesi OrderFlow Absorption ile gerçek emir akışı analizinin gücünü keşfedin – MetaTrader 4 için nihai delta histogramı ve absorpsiyon sinyal göstergesi. Fiyat hareketlerinin arkasında gerçekte neler olduğunu görmek isteyen traderlar için tasarlanan bu araç, piyasayı hareket ettiren gizli alım/satım baskısını ve absorpsiyon olaylarını ortaya çıkarır. Özellikler Delta Histogramı Görselleştirme: Alım ve satım baskısını a

Semboller: USDCHF, USDJPY, XAUUSD, GBPUSD, EURUSD, AUDUSD, GBPJPY ( USDCHF_H1’i seviyorum )
Zaman Dilimleri: H1, H4, D1
Önemli Özellikler: Yeniden çizim yok, gecikme yok, yön sinyali, çoklu onay
Güvenlik: Sinyaller stop loss, take profit içerir ve risk–ödül kuralına uygundur
Dahil: Ücretsiz Çoklu Zaman Dilimi Tarayıcısı (Bu ürünü satın aldıktan sonra, özel mesajla ekran görüntüsünü göndermeniz yeterlidir. Tarayıcı dosyasını size bizzat göndereceğim.)
Tam ticaret sistemi konsepti: Makaley

The Key level wedge indicator automatically draws rising wedge pattern and falling wedge pattern for you on the chart. This pattern is really good when used as a confirmation entry at key support & resistance, supply & demand and reversal zones.
Advantages
The Key level wedge block DOES NOT RE-PAINT, giving you confidence when a signal appears and also helps when looking back. The Key level wedge includes an on/off button on the chart to easily keep the charts clean after analysis by just o

Scalpers Zone – Nihai Arz/Talep + Stokastik Ret & Üçlü Dokunuş Göstergesi Scalpers Zone, yüksek olasılıklı scalping girişleri arayan traderlar için tasarlanmıştır. Günlük ve 7 günlük arz/talep bölgelerini tespit eder ve bu bölgelerin mükemmel şekilde hizalandığı alanları vurgular; böylece en güçlü potansiyel dönüş noktalarını işaretler. Kripto ve altın gibi volatil varlıklar için, bölge kalınlığı daha iyi görünürlük ve hassasiyet sağlamak amacıyla artırılabilir. Ana Özellikler: Hizalanmış Bölge
This index is based on the secondary development of supertrend, adding the combination index of Ma mean line user-defined algorithm, NRP, MTF three index weighted realization function.
There are two colors in the batch marking, orange for short and green for long.
Supertrend index is the first artificial intelligence indicator in the whole network --- signal light trading strategy.
It imitates the uncertain concept judgment and reasoning thinking mode of human brain. For the description
FREE

Introducing our exciting new Price Retest indicator! Get instant alerts when the price retests, giving you a powerful edge in your trading strategy. Remember to do your own analysis before making any moves in the market. MT5 Version - https://www.mql5.com/en/market/product/118159/ Join To Learn Market Depth - https://www.mql5.com/en/channels/suvashishfx
Here’s a detailed explanation of how the Price Retest indicator works, its components, and how you can incorporate it into your trading str
FREE

Smart Liquidity Levels Indicator (Multi-Timeframe) Identify Untouched Liquidity Zones with Precision The Smart Liquidity Levels Indicator is a professional trading tool designed to help traders visualize untouched liquidity highs and lows from higher timeframes directly on the chart. This indicator automatically scans historical candles on a selected higher timeframe (HTF) and plots liquidity levels that have NOT yet been taken by price , allowing traders to anticipate high-probability rea

The Market Sessions indicator is a popular tool among forex and stock traders for visually representing global trading sessions on a price chart. It highlights the time periods for major trading sessions — such as the Asian (Tokyo) , European (London) , and American (New York) sessions — directly on the chart. This helps traders identify when markets open and close, allowing for better decision-making based on session-specific trading behavior. - Asian Session (Default: 00:00-09:00) - Lo
FREE

The Hydra Multi Trend Dashboard is a powerful market scanning tool designed for MetaTrader 4 and MetaTrader 5. It monitors up to 25 currency pairs or assets simultaneously across all 9 standard timeframes (M1 to Monthly). Using a proprietary Special Trend Formula , the dashboard filters out market noise and provides clear, visual Bullish or Bearish signals, allowing traders to identify trend alignments at a glance without switching charts. Setup & Guide:
Download MT5 Version here. Exclusivel

Özel teklif : ALL TOOLS , her biri sadece $35 ! Yeni araçlar $30 olacak; ilk hafta veya ilk 3 satın alma için! Trading Tools Channel on MQL5 : En güncel haberlerimi almak için MQL5 kanalım’a katılın Liquidation Reversal Signals Z-score hacim uç değerlerini ve Supertrend durum değişimlerini birleştirerek yönlü likidasyon fazlarını işaretlemek ve dönüş noktalarını doğrulamak için tasarlanmış bir göstergedir. Trend yalnızca “renk değiştirirken” her seferinde bir ok
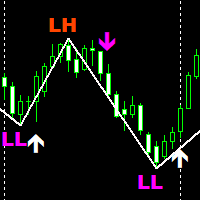
SMC Traders is a non-repaint indicator that is based on Price Action The indicator uses current market structure to predict future reversals. The indicator can be used with our free Market structure zig zag which can be found here: https://www.mql5.com/en/market/product/91579 Please note to find the HH AND HL CLINK ON LINK ABOVE Timeframes: 15 minutes for scalping 1 Hour for swing trading Purple Arrow look for sells in conjunction with LL White Arrow look for buys in conjunction with HL
FREE

Forex Piyasası Profili (kısaca FMP) Bu ne değildir:
FMP, klasik harf kodlu TPO ekranı değildir, genel grafik veri profili hesaplamasını görüntülemez ve grafiği periyotlara bölmez ve hesaplamaz.
Bu ne yapar :
En önemlisi, FMP göstergesi, kullanıcı tanımlı spektrumun sol kenarı ile kullanıcı tanımlı spektrumun sağ kenarı arasında bulunan verileri işleyecektir. Kullanıcı, fare ile göstergenin her iki ucunu çekerek spektrumu tanımlayabilir. Göstergeler sağ kenar canlı çubuğa ve daha uzağa (gelec
FREE

Visit our all-new Stein Investments Welcome Page to get the latest information, updates and trading strategies. Do you want to become a constantly profitable 5-star forex trader? Then get our Stein Investments trading tools and send us a screenshot to get your personal invitation to our exclusive trading chat with 500+ members.
FX Trend displays the trend direction, duration, intensity and the resulting trend rating for all time frames in real time.
You'll see at a glance at which dire
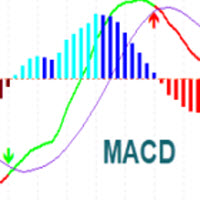
MACD Indicator It has MACD line, Signal line, and Histogram. The Histogram has 4 colors based on Direction Above and Below the Zero Line, showing its movement direction as simple as possible. Allows Show MACD & Signal Line, Show Change In color of MACD Line based on cross of Signal Line. Show Dots at Cross of MacD and Signal Line, Turn on and off Histogram. Enjoy your trading experience, and feel free to share your comments and reviews.
If you are interested in this indicator, you might
FREE
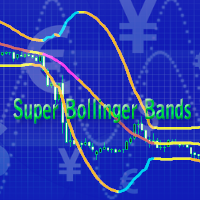
This is a forward-looking indicator for trading on all instruments. An advanced version of Bollinger Bands indicator created by outstanding analyst John Bollinger. One of the main differences of Super Bollinger Bands indicator from its predecessor consists in displaying upper and lower bands behavior on the middle line with some specific colors. Thus, the indicator gives a trader some visual information about trend development at the moment, and not in the past, as majority of other indicators d
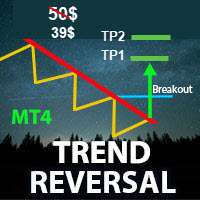
** All Symbols x All Timeframes scan just by pressing scanner button ** Discount: The price is $50$, But now it is just $39, Limited time offer is active.
*** Contact me to send you instruction and add you in "Trend Reversal group" for sharing or seeing experiences with other users. Introduction: Trendlines are the most famous technical analysis in trading . Trend lines continually form on the charts of markets across all the different timeframes providing huge opportunities for trader

LH ve HL kesintilerini bulmak için saf fiyat eylemiyle yapılan gelişmiş hesaplama.
Piyasada size büyük bir geri dönüş noktası verecektir.LH ve HL sinyalleri trengle çıkışları için de kullanılabilir.
Koparma gerçekleştiğinde, güçlü bir geri dönüş olduğunu gösterir.Hareketli Ortalamalar için güzel bir filtre.Bunu trend göstergeleriyle kullanmanızı şiddetle tavsiye ederim.
Destek ve direnç, arz talep göstergeleri için ekstra bir onay olarak kullanılabilir.
Daha fazla ayrıntı aşağıdaki forex iş p

Chart Patterns Detect 15 patterns (Ascending Triangle, Descending Triangle, Rising Wedge, Falling Wedge, Bullish Flag, Bearish Flag, Bullish Rectangle, Bearish Rectangle Symmetrical triangle, Head and Shoulders, Inverted Head and Shoulders, Triple top, Triple Bottom, Double Top, Double Bottom) Use historical data to calculate the probability of each pattern to succeed (possibility to filter notification according to the chance of success) gives graphic indication about the invalidation level and
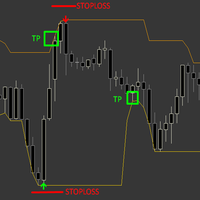
The Sure Reverse Channel is a dynamic non repaint trend indicator with entry arrows, the indicator focuses on catching a reverse swing in the market by using channel and price action formula, the indicator comes with built-in money management . HOW TO TRADE : Open buy trade when buy arrow pops up and set your SL below arrow, for TP you have TP which is opposite band. Open sell trade when sell arrow pops up and set your SL above arrow, for TP you have TP which is opposite band. band.
Why is
FREE
Currency RSI Scalper - is a professional indicator based on the popular Relative Strength Index (RSI) indicator. Although the RSI indicator works fine for an interval of the market, it fails to generate profitable signals when the market conditions change, and hence it produces wrong signals resulting in big losses. Have you ever thought about an adaptive RSI indicator that adapts its based on the market conditions? The presented indicator implements an optimization algorithm that finds the

Gendel Gendut is Binary Option Indicator From @realTatino Trade with expaired time Pairs : All Forex Pair Time Frame : M5 only Trade Time All Time Alert : Alert Message, Alert Email, Alerts Push Buffer : 4 Buffer (0,2 (Buy) || 1,3 (Sell) Broker Suitable : All Broker Binary With Forex Pair Auto Trade : Yes Repaint : NO Delay : NO Other Binary Indicator : https://www.mql5.com/en/market/product/70915 https://www.mql5.com/en/market/product/71054
https://www.mql5.com/en/market/product/57755
etc IND

Grafiklerinize manuel olarak Fibonacci seviyeleri çizmekten sıkıldınız mı? Ticaretinizdeki temel destek ve direnç seviyelerini belirlemenin uygun ve etkili bir yolunu mu arıyorsunuz? Başka yerde arama! Otomatik fibonacci seviyeleri yapan nihai MetaTrader 4 göstergesi olan DrawFib Pro ile tanışın grafikleriniz üzerinde çizim yapar ve bu seviyeler aşıldığında zamanında uyarılar sağlar. DrawFib Pro ile ticaret stratejilerinizi geliştirebilir, zamandan tasarruf edebilir ve daha bilinçli
FREE
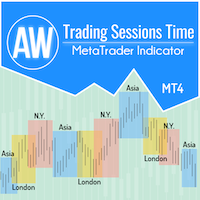
For the convenience of traders in obtaining data on the performance of markets and better formulating trading strategies, we have developed a trading session indicator. The opening hours of various exchanges affect trading as it affects market activity and trading volumes. These factors determine the volatility and trading opportunities of different instruments. The AW Trading Sessions Time indicator displays the trading hours of the Asian, London and New York markets. Traders can show or hide
FREE
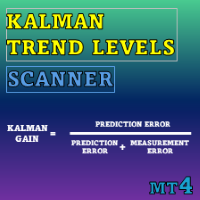
Special offer : ALL TOOLS , just $35 each! New tools will be $30 for the first week or the first 3 purchases ! Trading Tools Channel on MQL5 : Join my MQL5 channel to update the latest news from me Kalman Trend Levels , ileri düzey Kalman filtre teknolojisini kullanan, trend takipli bir gösterge olup traderlara güçlü analitik sinyaller sunar. Hassasiyet ve uyarlanabilirlik için tasarlanmış bu araç, yalnızca kritik destek ve direnç bölgelerini belirlemekle kalmaz, aynı zamanda piyas
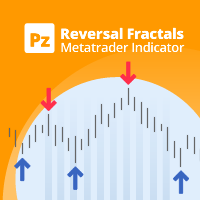
Bu, neredeyse on yıl önce ilk kez yayınlanan ünlü göstergem Reversal Fractals'ın en son yinelemesi. Piyasadaki olası geri dönüş noktalarını belirlemek için fraktalların fiyat yapısını inceler ve halihazırda temel veya teknik bir değerleme modeline sahip konumsal tüccarlara zamanlama sağlar. [ Kurulum Kılavuzu | Güncelleme Kılavuzu | Sorun Giderme | SSS | Tüm Ürünler ] Ters fraktallar uzun trendleri başlatabilir Gösterge yeniden boyanmıyor
Her türlü uyarıyı uygular Özelleştirilebilir renkler ve
FREE

IX Power: Endeksler, Emtialar, Kripto Paralar ve Forex Piyasaları için İçgörüler Genel Bakış
IX Power , endeksler, emtialar, kripto paralar ve forex sembollerinin gücünü analiz etmek için tasarlanmış çok yönlü bir araçtır. FX Power , tüm kullanılabilir döviz çiftlerinin verilerini kullanarak döviz çiftleri için maksimum doğruluk sağlarken, IX Power yalnızca temel sembolün piyasa verilerine odaklanır. Bu, IX Power 'ı forex dışındaki piyasalar için ideal ve daha basit forex analizleri için güven

Gösterge, mevcut fiyat yönünü ve piyasa oynaklığını belirlemenizi sağlar. Traders Dynamic Index'in bu sürümü, geçmiş verilerin yeniden çizilmesini ortadan kaldırdı, algoritma hesaplama hızı optimize edildi, daha hassas ayarlamalar için daha fazla harici parametreye ve genişletilmiş işlevselliklere sahiptir: ilk osilatör seçimi ve ortalamaların yumuşatma yöntemleri eklendi . parametreler: Mode Osc - tahmin osilatör seçimi Period Osc - kullanılan osilatörün hesaplama periyodu Price Osc - salınım h

Açıklama (MT4)
Bu gösterge, bir mum çubuğunun Bollinger Bantları'nın dışına çıkmasının ardından fiyatın tekrar içeri girdiği “reentry” anlarını tespit eder ve yanlış pozitifleri azaltmak için isteğe bağlı bir RSI teyidiyle birleştirir.
Buy ReEntry sinyali, fiyat alt banda inip sonra tekrar içeri döndüğünde üretilir; isteğe bağlı olarak RSI’nın oversold (aşırı satım) durumundan çıkmış olmasıyla teyit edilir.
Sell ReEntry sinyali ise fiyat üst bandın üzerine çıkıp tekrar içeri döndüğünde ve RSI’n
FREE

Altın Trend - bu iyi bir hisse senedi teknik göstergesidir. Gösterge algoritması, bir varlığın fiyat hareketini analiz eder ve oynaklığı ve potansiyel giriş bölgelerini yansıtır.
En iyi gösterge sinyalleri:
- SATIŞ için = kırmızı histogram + kırmızı KISA işaretçi + aynı yönde sarı sinyal oku + kırmızı trend yön oku. - AL için = mavi histogram + mavi UZUN işaretçi + aynı yönde aqua sinyal oku + mavi trend yön oku.
Göstergenin faydaları:
1. Gösterge yüksek doğrulukta sinyaller üretir. 2.

Öncelikle, bu Ticaret Aracının Non-Repainting, Non-Redrawing ve Non-Lagging Gösterge olduğunu vurgulamakta fayda var, bu da onu profesyonel ticaret için ideal hale getiriyor. Çevrimiçi kurs, kullanıcı kılavuzu ve demo. Akıllı Fiyat Hareketi Kavramları Göstergesi, hem yeni hem de deneyimli tüccarlar için çok güçlü bir araçtır. İleri ticaret fikirlerini, Inner Circle Trader Analizi ve Smart Money Concepts Ticaret Stratejileri gibi 20'den fazla kullanışlı göstergeyi bir araya getirerek bir araya g
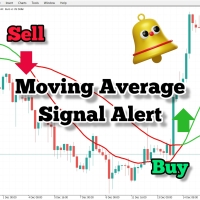
İşlem stratejinizde hareketli ortalamaları kullanıyorsanız, bu gösterge sizin için çok faydalı olabilir. İki hareketli ortalamanın kesişiminde sinyal sağlar, işitsel uyarılar gönderir, işlem platformunuzda bildirimler görüntüler ve olayla ilgili bir e-posta da gönderir. Kendi işlem tarzınıza ve stratejinize uyum sağlamak için kolayca özelleştirilebilir ayarlarla birlikte gelir. Ayarlanabilir parametreler: Hızlı MA (Fast MA) Yavaş MA (Slow MA) E-posta Gönder (Send_Email) İşitsel Uyarılar (Audibl
FREE
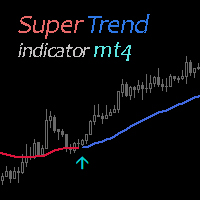
Super Trend Indicator uses two moving averages for calculating the trend direction. Combination with other market signals and analysis is necessary and provides more stable results. Indicator can be easily customized by the user including change of colors, with and arrow sizes.
FREE Super Trend Expert Advisor > https://www.mql5.com/en/market/product/81160?source=Site +Profile+Seller
FREE

"Ppr PA" is a unique technical indicator created to identify "PPR" patterns on the currency charts of the MT4 trading platform. These patterns can indicate possible reversals or continuation of the trend, providing traders with valuable signals to enter the market.
Features: Automatic PPR Detection: The indicator automatically identifies and marks PPR patterns with arrows on the chart. Visual Signals: Green and red arrows indicate the optimal points for buying and selling, respectively. Ar
FREE
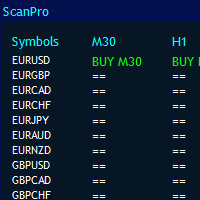
MT4 Universal Panel pro , ex4 dosyaları da dahil olmak üzere tüm göstergeler ve zaman dilimleri için tasarlanmıştır.
Bilgisayarınızın gücüne ve 10 zaman dilimine kadar sınırsız sayıda çifti tarayabilir. Panelin boyutu otomatik olarak düzenlenecektir.
arabelleklerle herhangi bir göstergeyi arayabilirsiniz.
Tüm varsayılan ve özel göstergeler için çalışır. Heikan ashi, rsi, parabolik, renko, fraktallar, destek direnci, arz talep, sapma, yüksek ve düşük hareketli ortalamalar için kullanabilirsi

KT MACD Alerts, MetaTrader’da yer alan standart MACD göstergesinin kişiselleştirilmiş bir versiyonudur. Aşağıdaki iki durumda hem uyarı verir hem de dikey çizgiler çizer: MACD, sıfır çizgisinin üzerine çıktığında. MACD, sıfır çizgisinin altına indiğinde.
Özellikler Tüm zaman dilimlerinde MACD yönünü gösteren dahili bir çoklu zamanlı (MTF) tarayıcı içerir. MACD'nin sıfır çizgisi üzerinde/altında yaptığı kesişmelere göre işlem yapan trader’lar için idealdir. Uyarıların yanı sıra, kesişmeleri dah
KT Two Pole Oscillator, gelişmiş bir yumuşatma yöntemi kullanarak yatırımcıların piyasada net sinyaller yakalayabilmesi için tasarlanmıştır. Sapmaya dayalı hesaplamaları, özgün iki kutuplu filtreleme yaklaşımıyla birleştirerek yatırımcıların kolayca yorumlayıp harekete geçebileceği net görsel sinyaller sunar. Uyarlanabilir yapısı sayesinde, iki kutuplu filtre farklı piyasa koşullarında tutarlı performans gösterir. Bu da onu hem trend hem yatay piyasalarda kullanılabilecek çok yönlü bir araç hali
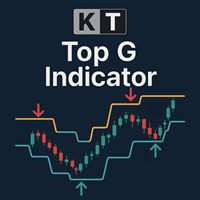
KT Top G, potansiyel piyasa tepe ve diplerini belirlemek için akıllı kanal analizini fiyat hareketine dayalı bir yapıyla birleştiren bir göstergedir. Olası bir dönüş algılandığında, grafik üzerinde kalın ve net oklar çizerek piyasadaki yön değişimi öncesinde sizi uyarır. Büyük Oklar: Fiyatın tükenmesi ve momentum değişimini algılayarak yüksek olasılıklı tepe ve dip seviyelerini vurgular. Küçük Oklar: Daha düşük olasılıklı dönüş noktalarını gösterir; bu noktalar genellikle piyasa gerçekten dönmed
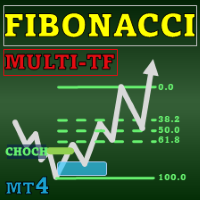
Special offer : ALL TOOLS , just $35 each! New tools will be $30 for the first week or the first 3 purchases ! Trading Tools Channel on MQL5 : Join my MQL5 channel to update the latest news from me Fibonacci Confluence Toolkit Multi-Timeframe , profesyonel traderlar için tasarlanmış gelişmiş bir teknik analiz aracıdır ve ana piyasa sinyalleri ile kalıplarını birleştirerek potansiyel fiyat dönüş bölgelerini belirlemenize yardımcı olur. Timeframe Selector panosu üzerinden çok zaman d
Trend takibi, yatırımcıların fiyatın ana hareket yönünde pozisyon almayı ve trend değişene kadar bu pozisyonu tutmayı amaçladığı bir stratejidir. Anti EMA MT4, MetaTrader 4 terminali için profesyonel bir indikatördür ve bu tür bir işlemde faydalı bir araç olabilir; çünkü uzun vadeli fiyat verilerine odaklanır, sürdürülebilir hareketleri görmeyi kolaylaştırır ve kısa vadeli dalgalanmaların neden olduğu yanlış sinyallerden kaçınmayı sağlar. MetaTrader 5 terminali için Anti EMA sürümü: https://ww
MetaTrader mağazası - yatırımcılar için alım-satım robotları ve teknik göstergeler doğrudan işlem terminalinde mevcuttur.
MQL5.community ödeme sistemi, MetaTrader hizmetlerindeki işlemler için MQL5.com sitesinin tüm kayıtlı kullanıcıları tarafından kullanılabilir. WebMoney, PayPal veya banka kartı kullanarak para yatırabilir ve çekebilirsiniz.
Alım-satım fırsatlarını kaçırıyorsunuz:
- Ücretsiz alım-satım uygulamaları
- İşlem kopyalama için 8.000'den fazla sinyal
- Finansal piyasaları keşfetmek için ekonomik haberler
Kayıt
Giriş yap
Gizlilik ve Veri Koruma Politikasını ve MQL5.com Kullanım Şartlarını kabul edersiniz
Hesabınız yoksa, lütfen kaydolun
MQL5.com web sitesine giriş yapmak için çerezlerin kullanımına izin vermelisiniz.
Lütfen tarayıcınızda gerekli ayarı etkinleştirin, aksi takdirde giriş yapamazsınız.