Conheça o Mercado MQL5 no YouTube, assista aos vídeos tutoriais
Como comprar um robô de negociação ou indicador?
Execute seu EA na
hospedagem virtual
hospedagem virtual
Teste indicadores/robôs de negociação antes de comprá-los
Quer ganhar dinheiro no Mercado?
Como apresentar um produto para o consumidor final?
Indicadores Técnicos para MetaTrader 4 - 4
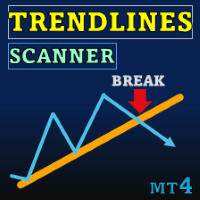
Special offer : ALL TOOLS , just $35 each! New tools will be $30 for the first week or the first 3 purchases ! Trading Tools Channel on MQL5 : Join my MQL5 channel to update the latest news from me Trendlines with Breaks Scanner é uma ferramenta de trading de última geração projetada para ajudar os traders a identificar tendências críticas e detectar rompimentos em tempo real. Com linhas de tendência geradas automaticamente com base em pontos de pivô, este indicador permite que os

Pivot Flow Pro - Trend-structure market direction using pivot highs and lows to form a dynamic bull/bear band.
Non-repainting trend-structure indicator that identifies market direction using averaged pivot highs and lows to form a dynamic bull/bear band, with signals confirmed strictly on closed candles. When price closes above or below the adaptive pivot levels, the indicator shifts trend and prints a flip arrow, while continuation dots highlight valid breakout points in the direction of the c
O indicador iPump é um indicador versátil que combina as vantagens de três categorias de indicadores.
detecção de tendência simultânea em vários TFs definindo zonas de resistência e suporte determinação de zonas de sobrecompra e sobrevenda Funções do indicador: Definindo uma tendência Esta função será necessária para todos os traders que desejam avaliar objetivamente a direção atual do mercado e evitar a subjetividade. Em uma fração de segundo, você será capaz de comparar a direção da tendênci

Crystal Smart Volume Visão geral O Crystal Smart Volume para MT4 é um indicador avançado de análise de volume e delta, desenvolvido para revelar a atividade institucional oculta por trás dos movimentos comuns do preço.
Ele combina os conceitos de Smart Money (SMC) , Volume Spread Analysis (VSA) e a lógica Delta , analisando simultaneamente o comportamento do preço e do volume.
O indicador identifica eventos como Buying Climax (clímax de compra) , Selling Climax (clímax de venda) , Weak Candles (
FREE
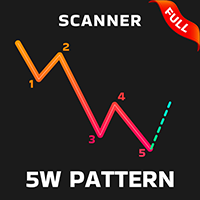
Contact me after payment to send you the User-Manual PDF File. 5W Pattern introduction The 5W pattern occurs when the price forms an alternating 5-wave cycle with its volatility. In fact, the 5W pattern is a price series of alternating HH or LL (higher high or lower low), which is the main characteristic of a trend. The pattern of 5W should have the characteristic of non-overlapping waves, also the points of the pattern are usually formed in Fibonacci levels. The completed pattern of 5W actua
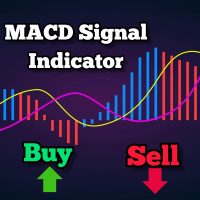
Este é um indicador de seguimento de tendências com base no MACD, fornecendo sinais de compra quando acima dos 200 MA e sinais de venda quando abaixo. O sinal é gerado quando o MACD cruza a linha zero. O indicador também exibe um nível de suporte e resistência que pode ser usado como stop loss. Parâmetros ajustáveis incluem período da MA, EMA rápido do MACD, EMA lento e intervalo de suporte-resistência. Ele plota nos pontos mais baixos e mais altos das velas recentes. Configurações padrão: Inter
FREE

Pulse Scalping Line - an indicator for identifying potential pivot points. Based on this indicator, you can build an effective Martingale system. According to our statistics, the indicator gives a maximum of 4 erroneous pivot points in a series. On average, these are 2 pivot points. That is, the indicator shows a reversal, it is erroneous. This means that the second signal of the indicator will be highly accurate. Based on this information, you can build a trading system based on the Martingale

PPR e Engulfing é um indicador técnico único projetado para identificar os padrões "PPR" e "Engulfing" nos gráficos de moedas na plataforma de negociação MetaTrader 4 (MT4). Esses padrões podem indicar possíveis reversões ou continuações de tendência, fornecendo aos traders sinais valiosos para entrar e sair do mercado. Características principais: Detecção automática de padrões : O indicador identifica e marca automaticamente os padrões PPR e Engulfing com setas no gráfico. Sinais visuais : Seta
FREE
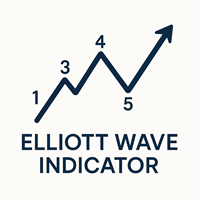
Indicador da Teoria das Ondas de Elliott para Meta Trader 4 O Indicador da Teoria das Ondas de Elliott foi desenvolvido com base em um dos conceitos profissionais do mercado forex. Este indicador pode desenhar a estrutura do mercado como ondas e contar picos como ondas ascendentes e descendentes de 1 a 5, permitindo ao usuário visualizar as ondas de Elliott e receber alertas para novos números. Este indicador contém 2 ondas: Onda Principal e Subonda, podendo exibir ondas grandes e pequenas com c
FREE
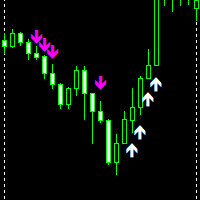
Up down Non-repaint is an MT4 indicator made to give accurate signals without disappearing. Magenta/Pink Arrow is your sell signal. white Arrow is your buy signal. indicator works on all pairs and timeframes 1 minute to Monthly timeframe. indicator is made for scalping do not hold trades for too long once arrows show the same direction you can add more entries all the best.!!
FREE

Este indicador identifica os padrões harmónicos mais populares que prevêem os pontos de inversão do mercado. Estes padrões harmónicos são formações de preços que se repetem constantemente no mercado forex e sugerem possíveis movimentos de preços futuros / Versão MT5 gratuita
Além disso, este indicador tem um sinal de entrada no mercado incorporado, bem como vários take profits e stop losses. Deve-se notar que, embora o indicador de padrão harmónico possa fornecer sinais de compra / venda por s
FREE
Versão MT5 disponível aqui:
https://www.mql5.com/en/market/product/50538 Canal e grupo no Telegram:
https://t.me/bluedigitsfx Acesso ao grupo VIP:
Envie o comprovante de pagamento para nossa caixa de mensagens Corretora recomendada:
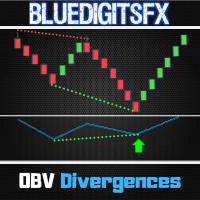
https://bit.ly/BlueDigitsFxStarTrader BlueDigitsFx OBV Divergence — Indicador poderoso para MT4 que identifica divergências OBV e ajuda a prever reversões de mercado O indicador BlueDigitsFx OBV Divergence analisa o preço e o On-Balance Volume (OBV) para identif

Title: BBMA Structure Guide - BBMA Structure Guide
Description: BBMA Structure Guide is a specialized MQL4 indicator designed to help traders understand the journey of BBMA structure more easily and efficiently. BBMA, or "Bollinger Bands Moving Average," is known for its motto "One Step Ahead," highlighting the importance of understanding market structure in depth.
With BBMA Structure Guide, you can quickly identify the underlying market structure patterns that drive price movements. This wil

O indicador apresentado avalia a volatilidade de um instrumento financeiro e com elevada eficiência emite sinais sobre momentos de alterações significativas na direção do movimento dos preços. O indicador é intuitivo e fácil de utilizar. O sinal indicador é gerado após a conclusão da formação da barra, na qual o indicador muda a sua posição em relação a zero. O indicador nunca redesenha o sinal. Os sinais do indicador devem ser confirmados pelo preço que excede o máximo/mínimo da barra na qual o

Antes de tudo, vale ressaltar que esta Ferramenta de Negociação é um Indicador Não Repintante, Não Redesenhante e Não Atrasado, o que a torna ideal para negociação profissional. Curso online, manual do utilizador e demonstração. O Indicador de Conceitos de Ação de Preço Inteligente é uma ferramenta muito poderosa tanto para traders novos quanto experientes. Ele combina mais de 20 indicadores úteis em um único, combinando ideias avançadas de negociação como Análise do Trader do Círculo Interno e
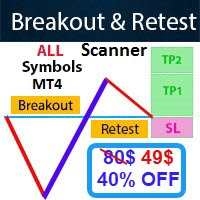
- Real price is 80$ - 40% Discount (It is 49$ now) Contact me for instruction, add group and any questions! - Non-repaint - I just sell my products in Elif Kaya profile, any other websites are stolen old versions, So no any new updates or support. - Lifetime update free Related product: Bitcoin Expert
Introduction The breakout and retest strategy is traded support and resistance levels. it involves price breaking through a previous level. The break and retest strategy is designed to help tr

Gold Scalper Super is an easy-to-use trading system. The indicator can be used as a standalone scalping system on the M1 time frame, as well as part of your existing trading system. Bonus: when purchasing an indicator, Trend Arrow Super is provided free of charge, write to us after purchase. The indicator 100% does not repaint!!! If a signal appears, it does not disappear! Unlike indicators with redrawing, which lead to the loss of a deposit, because they can show a signal and then remove it.
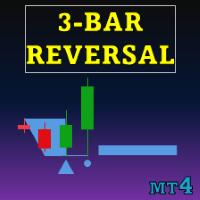
Special offer : ALL TOOLS , just $35 each! New tools will be $30 for the first week or the first 3 purchases ! Trading Tools Channel on MQL5 : Join my MQL5 channel to update the latest news from me O Indicador de Padrão de Reversão de Três Barras oferece uma ferramenta poderosa para traders, identificando e destacando automaticamente padrões de reversão de três barras diretamente no gráfico de preços. Este indicador é um recurso valioso para detectar reversões potenciais de tendênc

Histograma de Oferta e Demanda Multitemporal
Descrição:
O Histograma de Oferta e Demanda Multitemporal é um indicador poderoso e limpo que mostra a força da oferta e demanda do mercado em múltiplos períodos de tempo, especificamente H4 e D1. Ele exibe histogramas que destacam quando os compradores ou vendedores dominam, permitindo que os traders identifiquem rapidamente as áreas-chave de pressão do mercado. Principais Recursos: Histogramas H4 e D1: Visualização clara da força do mercado em per
FREE
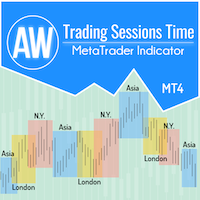
Para comodidade dos traders na obtenção de dados sobre o desempenho dos mercados e na melhor formulação de estratégias de negociação, desenvolvemos um indicador de sessão de negociação. O horário de funcionamento de várias bolsas afeta as negociações, pois afeta a atividade do mercado e os volumes de negociação. Estes factores determinam a volatilidade e as oportunidades de negociação de diferentes instrumentos. O indicador AW Trading Sessions Time exibe os horários de negociação dos mercados a
FREE

Delta Swing Pro - Multi-Timeframe Trend Consensus System for MT4 Concept: Capturing the Moment of Perfect Alignment The greatest adversary in trading is the "contradiction" between different timeframes. It is common to find a 5-minute chart showing a bullish trend while the 1-hour chart remains bearish. This conflict creates market noise that leads many traders into unprofitable traps. Delta Swing Pro is engineered to synchronize these varying timeframe vectors. It identifies the rare moments

Universal Swing Arrows é um indicador baseado em seta projetado para fornecer sinais de negociação de swing. Ele pode ser usado para qualquer par de negociação e qualquer período de negociação. AS SETAS APARECEM NA VELA ATUAL (0). OS SINAIS NÃO REPINTAM! O indicador pode ser usado como um sistema de negociação autônomo ou como parte de sua estratégia de negociação pessoal. A seta do indicador não é apenas um sinal, mas também seu possível nível de stop loss. O indicador calcula automaticamente o
Este índice baseia-se no Desenvolvimento secundário Da supertendência, adicionando o índice de combinação do algoritmo de execução médio de Linha Ma, NRP, MTF, função de realização ponderada de três índices.
Há duas cores Na Marca do lote, Laranja para curto e Verde por Muito tempo.
O índice de sobreposição é o primeiro indicador de inteligência artificial EM toda a rede... estratégia de troca de sinais luminosos.
Ele imita o conceito incerto de julgamento e modo de raciocínio do cérebro
FREE

Swing Trading é o primeiro indicador projetado para detectar oscilações na direção da tendência e possíveis oscilações de reversão. Ele usa a abordagem de negociação de linha de base, amplamente descrita na literatura de negociação. O indicador estuda vários vetores de preço e tempo para rastrear a direção da tendência agregada e detecta situações nas quais o mercado está sobrevendido ou sobrecomprado em excesso e pronto para corrigir. [ Guia de instalação | Guia de atualização | Solução de prob
Special offer : ALL TOOLS , just $35 each! New tools will be $30 for the first week or the first 3 purchases ! Trading Tools Channel on MQL5 : Join my MQL5 channel to update the latest news from me I. Introdução
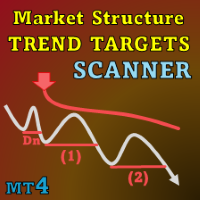
Market Structure Trend Targets Scanner é uma ferramenta poderosa para analisar tendências de mercado, identificar pontos de rompimento e gerenciar riscos por meio de um stop loss dinâmico. Ao rastrear altas e baixas anteriores para identificar rompimentos, esta ferramenta

The Market Sessions indicator is a popular tool among forex and stock traders for visually representing global trading sessions on a price chart. It highlights the time periods for major trading sessions — such as the Asian (Tokyo) , European (London) , and American (New York) sessions — directly on the chart. This helps traders identify when markets open and close, allowing for better decision-making based on session-specific trading behavior. - Asian Session (Default: 00:00-09:00) - Lo
FREE
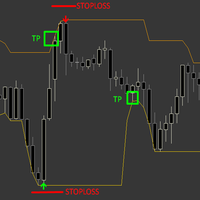
The Sure Reverse Channel is a dynamic non repaint trend indicator with entry arrows, the indicator focuses on catching a reverse swing in the market by using channel and price action formula, the indicator comes with built-in money management . HOW TO TRADE : Open buy trade when buy arrow pops up and set your SL below arrow, for TP you have TP which is opposite band. Open sell trade when sell arrow pops up and set your SL above arrow, for TP you have TP which is opposite band. band.
Why is
FREE
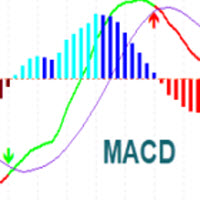
MACD Indicator It has MACD line, Signal line, and Histogram. The Histogram has 4 colors based on Direction Above and Below the Zero Line, showing its movement direction as simple as possible. Allows Show MACD & Signal Line, Show Change In color of MACD Line based on cross of Signal Line. Show Dots at Cross of MacD and Signal Line, Turn on and off Histogram. Enjoy your trading experience, and feel free to share your comments and reviews.
If you are interested in this indicator, you might
FREE

Quantas vezes você comprou um indicador de negociação com ótimos back-tests, prova de desempenho em conta real com números fantásticos e estatísticas por toda parte, mas depois de usá-lo, você acabou perdendo sua conta?
Você não deve confiar em um sinal por si só, você precisa saber por que ele apareceu em primeiro lugar, e é isso que o RelicusRoad Pro faz de melhor! Manual do Usuário + Estratégias + Vídeos de Treinamento + Grupo Privado com Acesso VIP + Versão Móvel Disponível
Uma Nova Forma

TMA Currency Meter is the ultimate currency meter. Based on the Triangular Moving Average of all available symbols, this indicator shows which currencies are strong, strengthening, weak or weakening. Experienced as well as novice traders will see the strong and weak currencies in the blink of an eye, and know which trade possibilities to explore further. TMA Currency Meter is a true Multi Timeframe indicator. It is easy to show the currency strengths for a higher timeframe than the chart timefra

Looking for a powerful yet lightweight swing detector that accurately identifies market structure turning points?
Want clear, reliable buy and sell signals that work across any timeframe and any instrument?
Buy Sell Arrow MT Swing is built exactly for that — precision swing detection made simple and effective. This indicator identifies Higher Highs (HH) , Higher Lows (HL) , Lower Highs (LH) , and Lower Lows (LL) with remarkable clarity. It is designed to help traders easily visualize market str

ICT, SMC, Smart Money Concept, Suporte e Resistência, Análise de Tendências, Ação do Preço, Estrutura de Mercado, Blocos de Ordens, Blocos de Rompimento, Mudança de Momentum, Desbalanceamento Forte, HH/LL/HL/LH, Gap de Valor Justo, FVG, Zonas de Prêmio e Desconto, Retração de Fibonacci, OTE, Liquidez Compradora, Liquidez Vendedora, Vazios de Liquidez, Sessões de Mercado, NDOG, NWOG, Bala de Prata, modelo ICT.
No mercado financeiro, uma análise de mercado precisa é crucial para os investidores. P

O indicador constrói um semáforo de três períodos e um padrão de reversão 123 a partir do extremo. O sinal surge na abertura da segunda vela. Este padrão pode ser negociado de diferentes maneiras (ponto de teste 3, fuga e outros). A saída do canal ou o rompimento da linha de tendência é o principal gatilho para encontrar um ponto de entrada. Os ícones são coloridos de acordo com os níveis de Fibonacci. Os ícones amarelos indicam um teste de um nível em que o sinal é amplificado. Utilizando o pa

Ou (TDO) que é um índice que mede a taxa de variação do preço usando o princípio de " Pure Momentum ".
Quando o preço de um título avança de 10 para 15, a taxa de variação do preço é 150%, mas quando diminui de 15 para 10, a taxa de variação do preço é apenas 33,3%. É por isso que os indicadores de análise técnica como "Taxa de variação do preço" (ROC) ou "Momentum" fornecem leituras mais altas para movimentos de preços ascendentes do que para os descendentes. O TDO corrige esse problema para aj

Special offer : ALL TOOLS , just $35 each! New tools will be $30 for the first week or the first 3 purchases ! Trading Tools Channel on MQL5 : Join my MQL5 channel to update the latest news from me O indicador Supertrend Fakeout é uma versão aprimorada do clássico indicador Supertrend , projetado para fornecer sinais de tendência mais confiáveis. Ao incorporar recursos avançados como Fakeout Index Limit e Fakeout ATR Mult , este indicador ajuda a filtrar reversões de tendência fals
FREE

O Indicador de Reversão ADR mostra rapidamente onde o preço está sendo negociado atualmente em relação ao seu intervalo médio diário normal. Você receberá alertas instantâneos via pop-up, e-mail ou push quando o preço exceder seu intervalo médio e níveis acima dele de sua escolha, para que você possa saltar rapidamente para retrocessos e reversões. O indicador desenha linhas horizontais no gráfico nos extremos médios do intervalo diário e também extensões acima daqueles níveis que têm probabili
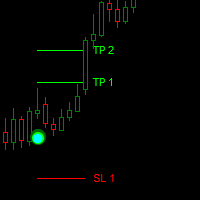
Dark Point is an Indicator for intraday trading. This Indicator is based on Trend Following strategy, also adopting the use of the atr to determine the right volatility. We can enter in good price with this Indicator, in order to follow the strong trend on the current instrument. If you love Dark Point, consider adding some power: Dark Power
Key benefits
Easily visible take profit/stop loss lines Intuitive directional points/arrows by colors Useful statistics , which indicate the win ra
FREE

Reversal Zones Pro is an indicator specifically designed to accurately identify key trend reversal zones. It calculates the average true range of price movement from the lower to upper boundaries and visually displays potential zones directly on the chart, helping traders effectively identify important trend reversal points. Key Features: Reversal Zone Identification: The indicator visually displays potential reversal zones directly on the chart. This helps traders effectively identify importan

O indicador básico Renko é uma ferramenta poderosa para os comerciantes que procuram uma perspetiva de mercado clara e concisa. O nosso indicador não só simplifica a visualização de tendências, como também oferece alertas precisos para inversões, proporcionando uma vantagem estratégica na sua negociação / Versão MT5 gratuita
Características Totalmente personalizável: Adapte o indicador às suas preferências comerciais com opções avançadas de personalização. Desde as cores às definições do tama
FREE

PROFESSIONAL FOOTPRINT CHART INDICATOR
A Footprint Chart is an advanced order flow visualization tool that displays the volume traded at each price level within a candlestick. Unlike traditional candlestick charts that only show open, high, low, and close prices, footprint charts reveal the battle between buyers and sellers at every price level. KEY CONCEPT: Footprint charts show WHERE volume occurred, not just HOW MUCH volume occurred. This is critical for understanding institutional activ
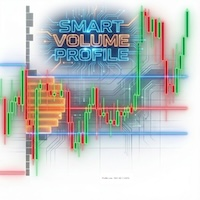
Portuguese Rastreio de "Smart Money" (Volume Markers): Setas indicam volume anormal (acima da média) com cores verde/vermelho claras. Ajuda a identificar a entrada de grandes investidores e filtrar sinais falsos. Alertas de Decisão (Alerts): Não precisa ficar olhando para a tela. O sistema avisa imediatamente quando o preço cruza a linha POC (Ponto de Controle), que é frequentemente um ponto decisivo para continuação ou reversão. Estrutura de Mercado Atual (Developing Profile): Mostra o perfil d

Oferta especial : ALL TOOLS , apenas $35 cada! Novas ferramentas custarão $30 na primeira semana ou nas primeiras 3 compras ! Trading Tools Channel on MQL5 : junte-se para receber as novidades RSI Shift Zone Scanner identifica momentos em que o sentimento do mercado pode mudar, ligando sinais do RSI à ação do preço. Sempre que o RSI ultrapassa os níveis predefinidos (70 para sobrecompra, 30 para sobrevenda), o indicador desenha um canal diretamente no gráfico. Esses canais marcam á
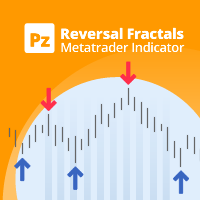
Esta é a última iteração do meu famoso indicador, Reversal Fractals, publicado pela primeira vez há quase uma década. Ele examina a estrutura de preços dos fractais para determinar possíveis pontos de reversão no mercado, fornecendo timing para traders posicionais que já possuem um modelo de avaliação fundamental ou técnico. [ Guia de instalação | Guia de atualização | Solução de problemas | Perguntas frequentes | Todos os produtos ] Os fractais de reversão podem iniciar tendências longas O ind
FREE

MCAD stands for M ulti C urrency A ccumulation/ D istribution, so please don't confuse it with the well-known MACD. MCAD calculates relative strengths of Accumulation/Distribution of volumes for plain Forex currencies (that is their synthetic behaviour extracted from Forex pairs), market indices, CFDs and other groups of tickers. It uses standard Accumulation/Distribution formula ( Wikipedia's article ) and can apply it either to tick volumes, or to pseudo-real volumes ( volume surrogates , intr

Este indicador analisa cada barra de pressão de compra ou venda e identifica 4 tipos de padrões de velas com o maior volume. Essas velas são filtradas usando vários filtros lineares para mostrar sinais de compra ou venda. Os sinais funcionam melhor, em conjunto com a direção do período de tempo mais alto e quando negociados durante as horas de alto volume. Todos os filtros são personalizáveis e funcionam de forma independente. Pode visualizar sinais de uma única direção com o clique de um bot

Simple QM Pattern is a powerful and intuitive trading indicator designed to simplify the identification of the Quasimodo (QM) trading pattern. The QM pattern is widely recognized among traders for effectively signaling potential reversals by highlighting key market structures and price action formations. This indicator helps traders easily visualize the QM pattern directly on their charts, making it straightforward even for those who are new to pattern trading. Simple QM Pattern includes dynamic
FREE

A trend indicator based on the Hull Moving Average (HMA) with two periods. The Hull Moving Average is an improved variant of the moving average, which shows the moment of trend reversal quite accurately. It is often used as a signal filter. Combination of two types of Hull Moving Averages makes a better use of these advantages: HMA with a slow period identifies the trend, while HMA with a fast period determines the short-term movements and signals in the trend direction.
Features The movement d
FREE

It is FREE on EURUSD chart. All Symbols version! Contact me for any questions Introduction The breakout and retest strategy is traded support and resistance levels. it involves price breaking through a previous level. The break and retest strategy is designed to help traders do two main things, the first is to avoid false breakouts. Many false breakouts start with a candlestick that breaks out of a level but ends with an immediate candlestick that brings the price back into the level. The
FREE

Apollo Pips é um indicador de reversão de tendência altamente preciso para negociar qualquer par de moedas. Ele foi originalmente desenvolvido para negociar XAUUSD, mas a prática mostrou que o indicador pode ser usado com sucesso em outros pares. Período de tempo recomendado H1. O indicador faz um alerta somente quando o sinal é confirmado. Portanto, se você viu um alerta, poderá usar com segurança o sinal recebido. O indicador NÃO REDESENHA seus sinais! A seta pode piscar até que o sinal seja r

Perfil do mercado Forex (FMP para breve) O que isso não é:
O FMP não é a exibição TPO clássica codificada por letras, não exibe o cálculo geral do perfil de dados do gráfico e não segmenta o gráfico em períodos e os calcula.
O que faz :
Mais importante ainda, o indicador FMP processará dados que residem entre a borda esquerda do espectro definido pelo usuário e a borda direita do espectro definido pelo usuário. O usuário pode definir o espectro apenas puxando cada extremidade do indicador co
FREE

The Trend_Scalper_Arrows_Entry&Exit trend indicator perfectly follows the trend, indicates entry search zones, indicates entry signals with arrows, and also indicates zones for fixing market orders with vertical lines. An excellent indicator for both beginners in Forex trading and professionals.
All lines, arrows, alerts can be disabled.
See all indicator parameters on the screenshot.

Descrição (MT4)
Este indicador identifica os momentos de reentrada de preço após uma vela ter ultrapassado externamente as Bandas de Bollinger, combinando esse sinal com uma confirmação opcional de RSI para reduzir falsos positivos.
Um sinal Buy ReEntry é gerado quando o preço havia caído abaixo da banda inferior e depois retornou para dentro, com a confirmação opcional de que o RSI acabou de sair de uma condição de sobrevenda.
Um sinal Sell ReEntry acontece quando o preço havia subido acima da
FREE

Introducing the Volume Order Blocks indicator, a game-changing tool designed for traders who demand precision and clarity in their market analysis. This advanced indicator not only identifies order blocks but also integrates crucial volumetric data, allowing you to gauge the strength of these blocks with unparalleled accuracy. MT5 version - https://www.mql5.com/en/market/product/121238/ Key Features of the Volume Order Blocks: Bullish & Bearish Order Blocks: Easily visualize and dif
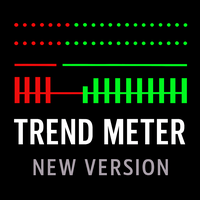
Indicador de análise de tendência multi-moeda para MetaTrader 4 que visualiza a direção e a força da tendência em múltiplos períodos de tempo. Apenas para fins de análise. TREND METER – INDICADOR DE ANÁLISE DE TENDÊNCIA MULTI-MOEDA (MT4) Trend Meter é um indicador técnico de análise de tendência concebido para visualizar a direção da tendência, a força da tendência e o alinhamento da tendência em múltiplos períodos de tempo e símbolos. O indicador destina-se à análise visual e não abre operaçõ
Gold Trend M1 - Optimized Scalping Tool for Gold (XAUUSD) Gold Trend M1 is a high-frequency trading indicator for the MetaTrader 4 platform, specifically optimized for the M1 timeframe on the Gold market. It combines a powerful SuperTrend trend filter with buy/sell signals derived from Heiken Ashi calculation logic, helping traders identify precise and disciplined entry points for optimal trading performance.
Key Features Optimized for M1 Scalping: Specifically developed for high-speed scalping

O nosso indicador de padrões básicos de velas torna a identificação dos principais padrões de velas mais fácil do que nunca. Descubra padrões como o Martelo, a Estrela da Noite, os Três Soldados Brancos e muitos outros com apenas um olhar para o seu gráfico. Com uma interface intuitiva e pistas visuais claras, o nosso indicador ajuda-o a identificar oportunidades de negociação de forma rápida e precisa / Versão MT5
Dashboard Scanner para este indicador: ( Basic Candlestick Patterns Dashboard )
FREE

The Hydra Multi Trend Dashboard is a powerful market scanning tool designed for MetaTrader 4 and MetaTrader 5. It monitors up to 25 currency pairs or assets simultaneously across all 9 standard timeframes (M1 to Monthly). Using a proprietary Special Trend Formula , the dashboard filters out market noise and provides clear, visual Bullish or Bearish signals, allowing traders to identify trend alignments at a glance without switching charts. Setup & Guide:
Download MT5 Version here. Exclusivel

Contact me after payment to send you the User-Manual PDF File.
Triangle Pattern
Sometimes the price cannot make higher highs or lower lows and it moves in a converging price range and waves are shorter than before until the movement creates a geometric shape of a symmetrical triangle, which indicates It is maybe the end of the trend. The triangle pattern is a well-known in forex and the trading plan and strategy of many traders is based on it.
The Triangle Pattern Scanner Indicator It is usu
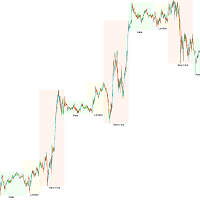
Sessão de Trading KillZone — Liberte o poder do timing do mercado
Traders de sucesso sabem uma verdade: o timing é tudo. Cada sessão traz diferentes níveis de atividade, volatilidade e oportunidades. Para ajudá-lo a aproveitar essas mudanças, criámos o Indicador de Sessão KillZone. Este indicador destaca os horários ativos das sessões da Ásia, Londres e Nova Iorque, dando-lhe uma visão clara de quando o mercado está mais vivo. Você pode personalizar: mostrar/ocultar sessões, adicionar/remover n
FREE
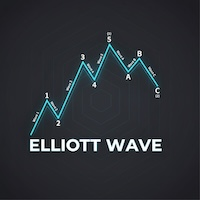
Teoria das Ondas de Elliott Automatizada 1. Contagem automática e redução de viés (Objetividade) Normalmente, a contagem das Ondas de Elliott envolve muita "imaginação" ou opinião pessoal. Este indicador ajuda: Encontrando Ondas de Impulso (1-2-3-4-5): Usa regras estritas (ex: a onda 3 não pode ser a mais curta, a onda 4 não deve sobrepor a onda 1) para mostrar a estrutura correta. Encontrando Ondas Corretivas (A-B-C): Ajuda a identificar retrações para encontrar oportunidades de reentrada na te

O painel de força da moeda com média móvel é um indicador poderoso e abrangente que fornece uma visão profunda do momento da moeda em vários símbolos e prazos. Essa ferramenta robusta utiliza médias móveis para identificar os pontos de cruzamento mais recentes e rastreia efetivamente a força das moedas até o preço atual. Com seu design intuitivo e interface amigável, este painel oferece uma riqueza de informações para os comerciantes que buscam tomar decisões informadas.
Um dos principais

Introducing our exciting new Price Retest indicator! Get instant alerts when the price retests, giving you a powerful edge in your trading strategy. Remember to do your own analysis before making any moves in the market. MT5 Version - https://www.mql5.com/en/market/product/118159/ Join To Learn Market Depth - https://www.mql5.com/en/channels/suvashishfx
Here’s a detailed explanation of how the Price Retest indicator works, its components, and how you can incorporate it into your trading str
FREE

Dashboard for Ma Speedometer: https://www.mql5.com/en/market/product/116784
Non standard attitude to the standard moving average indicator. The essence of the indicator is to determine the strength and speed of the price direction by determining the tilt angle of the moving average. A point is taken on the fifteenth MA candle and a point on the last closed MA candle, a straight line is drawn between them, it is movable and on a hemisphere shows an angle of inclination from 90 degrees to -90. a

Indicador ZigZag de vários períodos de tempo. Ele exibe as linhas horizontais de suporte/resistência e seus rompimentos, bem como desenha as metas atuais do mercado. Também pode exibir linhas do indicador Fractais e velas de outros períodos (até Trimestral). Indicador – conecta máximas e mínimas importantes para mostrar linhas de tendência.
O indicador redesenha o último ponto (atual) e, em alguns casos, pode alterar os últimos 2-3 pontos.
Todas as linhas são desenhadas como objetos ( não buf

ADX arrow
Este indicador mostra os sinais do indicador ADX (índice médio de movimento direccional) como pontos no gráfico.
Isto facilita a identificação visual dos sinais. O indicador também apresenta alertas (caixas de mensagens pop-up) empurrar e enviar sinais para o e-mail.
Parametro Período médio. Aplicar ao preço utilizado para os cálculos: Próximo, Aberto, Alto, Baixo, mediana(alto+baixo)/2, típico (alto+baixo+perto)/3, próximo ponderado (alto+baixo+perto+perto) / 4. Alerta-Activar/D
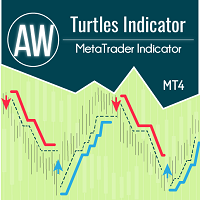
O indicador funciona de acordo com o sistema Turtle e classicamente assume um intervalo de tempo de 20 e 55 velas. Uma tendência é monitorada durante um determinado intervalo de tempo. A entrada é feita no momento da quebra do nível de suporte ou resistência. O sinal de saída é um rompimento de preço na direção oposta da tendência do mesmo intervalo de tempo. Vantagens:
Instrumentos: pares de moedas, ações, commodities, índices, criptomoedas Prazo: Classicamente D1, também adequado para trabal
FREE

The Key level wedge indicator automatically draws rising wedge pattern and falling wedge pattern for you on the chart. This pattern is really good when used as a confirmation entry at key support & resistance, supply & demand and reversal zones.
Advantages
The Key level wedge block DOES NOT RE-PAINT, giving you confidence when a signal appears and also helps when looking back. The Key level wedge includes an on/off button on the chart to easily keep the charts clean after analysis by just o
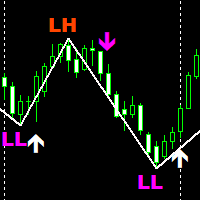
SMC Traders is a non-repaint indicator that is based on Price Action The indicator uses current market structure to predict future reversals. The indicator can be used with our free Market structure zig zag which can be found here: https://www.mql5.com/en/market/product/91579 Please note to find the HH AND HL CLINK ON LINK ABOVE Timeframes: 15 minutes for scalping 1 Hour for swing trading Purple Arrow look for sells in conjunction with LL White Arrow look for buys in conjunction with HL
FREE

Você está cansado de desenhar manualmente os níveis de Fibonacci em seus gráficos? Você está procurando uma maneira conveniente e eficiente de identificar os principais níveis de suporte e resistência em sua negociação? Não procure mais! Apresentando o DrawFib Pro, o melhor indicador do MetaTrader 4 que faz níveis automáticos de fibonacci desenhando em seus gráficos e fornece alertas oportunos quando esses níveis são violados. Com o DrawFib Pro, você pode aprimorar suas estratégias d
FREE

Indicador de Deslocamento da Estrutura do Mercado e Lacunas de Valor Justo (FVG) para MT4 Este indicador para MT4 identifica deslocamentos na estrutura do mercado e lacunas de valor justo (FVG), proporcionando aos traders potenciais oportunidades de trading. Ele alerta os usuários sobre esses eventos por meio de notificações móveis, permitindo que reajam rapidamente às condições de mercado em constante mudança. Principais características: Detecção de Deslocamento da Estrutura do Mercado: Identi
FREE
O Mercado MetaTrader oferece um local conveniente e seguro para comprar aplicativos para a plataforma MetaTrader. Faça download de versões de demonstração gratuitas de Expert Advisors e indicadores a partir do seu terminal para testes no Testador de Estratégia.
Teste os aplicativos em diferentes modos para monitoramento do desempenho e assim fazer um pagamento para o produto que você deseja, usando o sistema de pagamento MQL5.community.
Você está perdendo oportunidades de negociação:
- Aplicativos de negociação gratuitos
- 8 000+ sinais para cópia
- Notícias econômicas para análise dos mercados financeiros
Registro
Login
Se você não tem uma conta, por favor registre-se
Para login e uso do site MQL5.com, você deve ativar o uso de cookies.
Ative esta opção no seu navegador, caso contrário você não poderá fazer login.