
Cycle Finder Pro
- Indicators
- Version: 6.11
- Updated: 7 October 2026
- Activations: 15

## THE CHART, READ FOR YOU.
Chart reading is slow, and it is easy to get wrong. You need to know which highs and lows actually matter, which ones the market has already invalidated, and what the ones that remain are telling you. Miss a point and the whole read changes.
Cycle Finder Pro marks TRUE highs and lows, and nothing else.
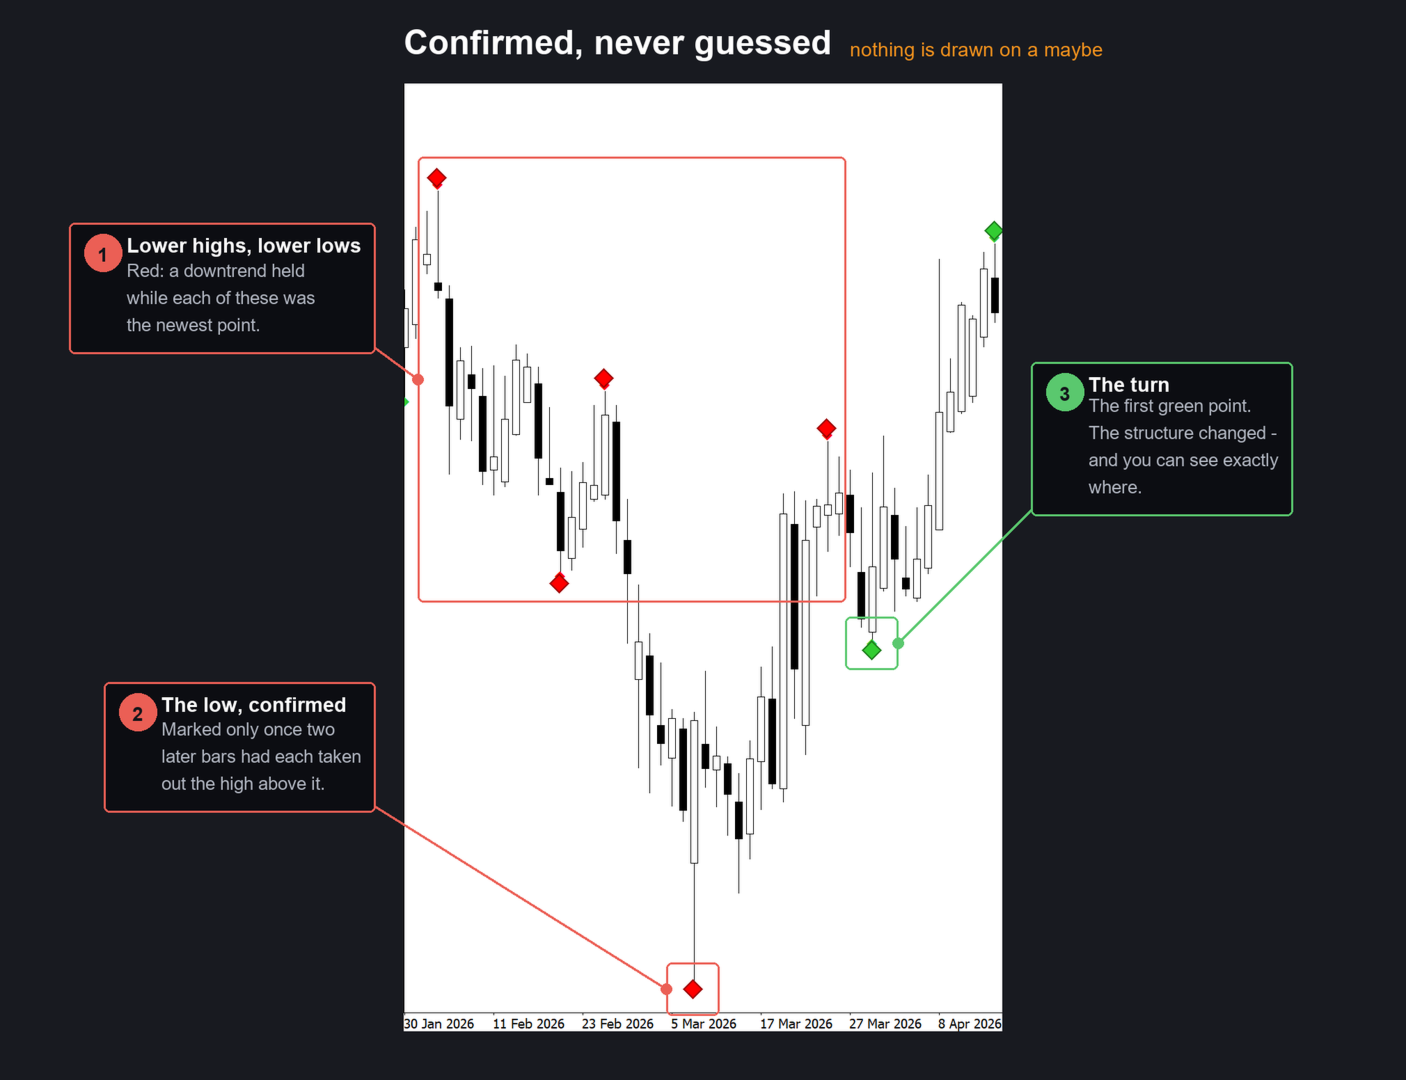
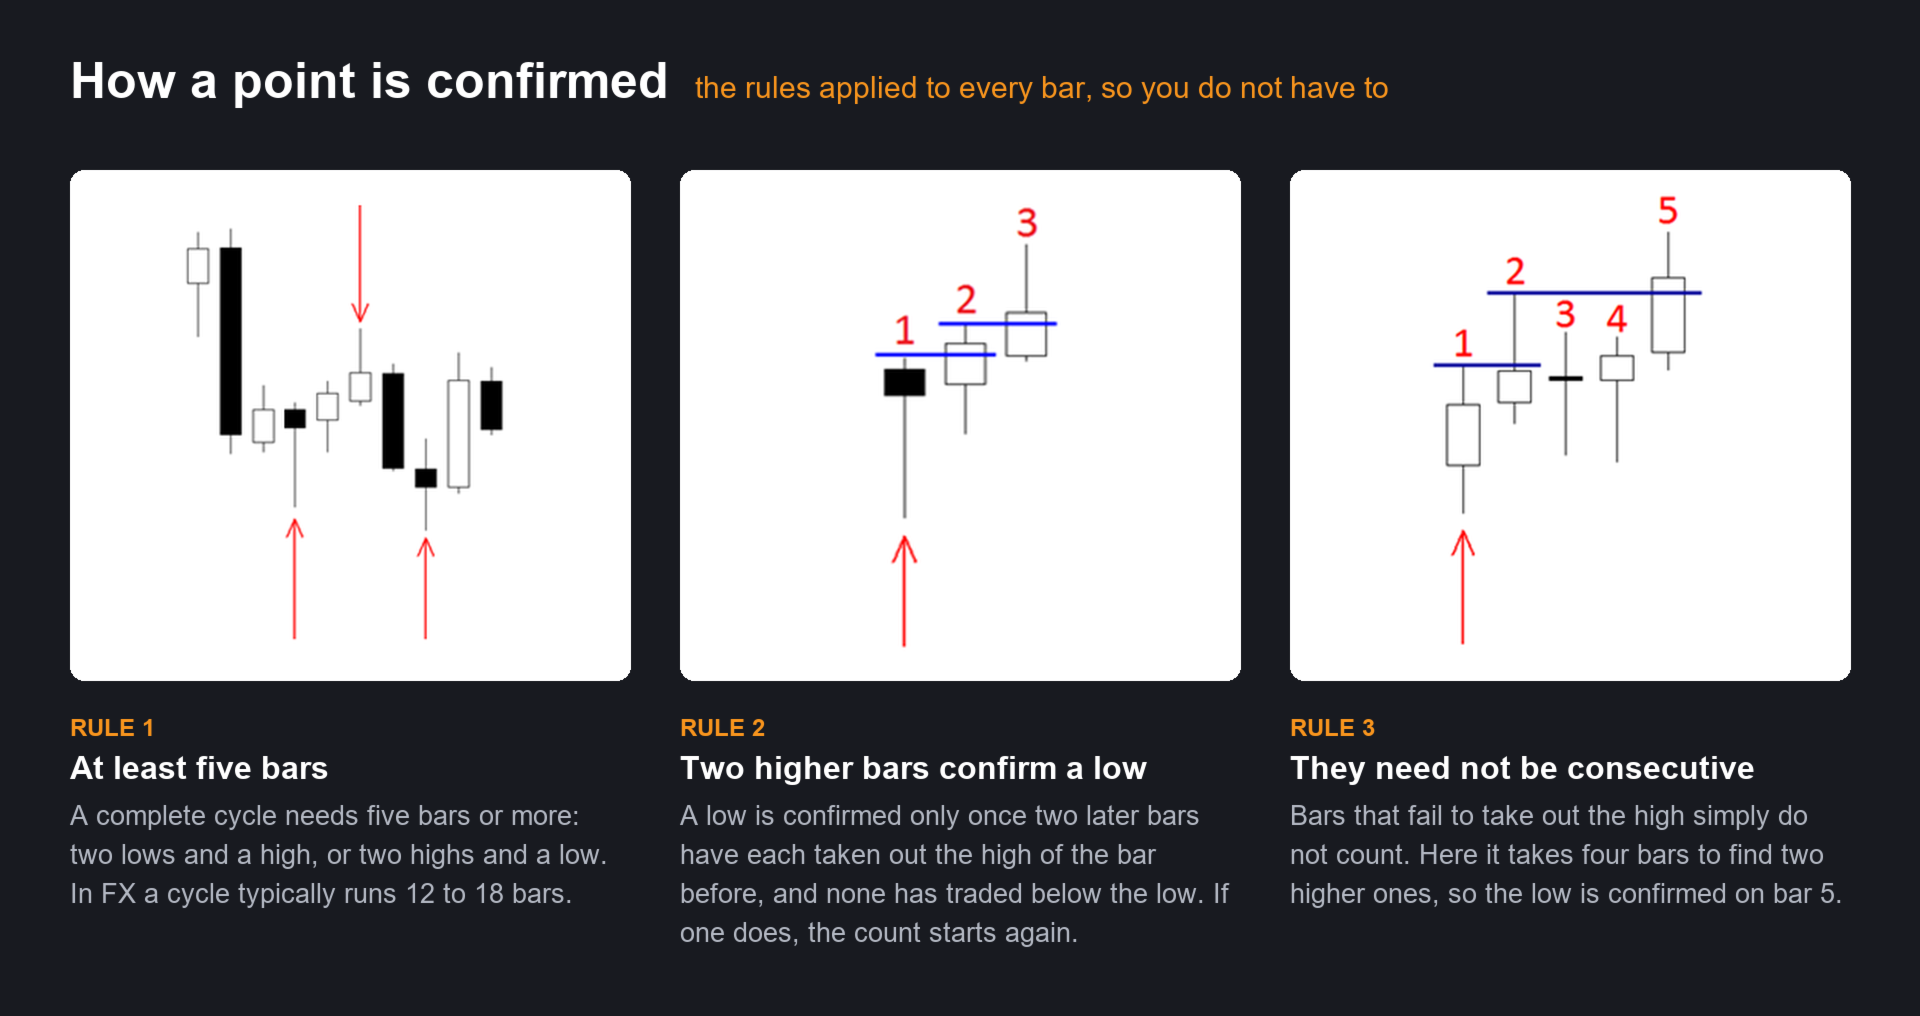
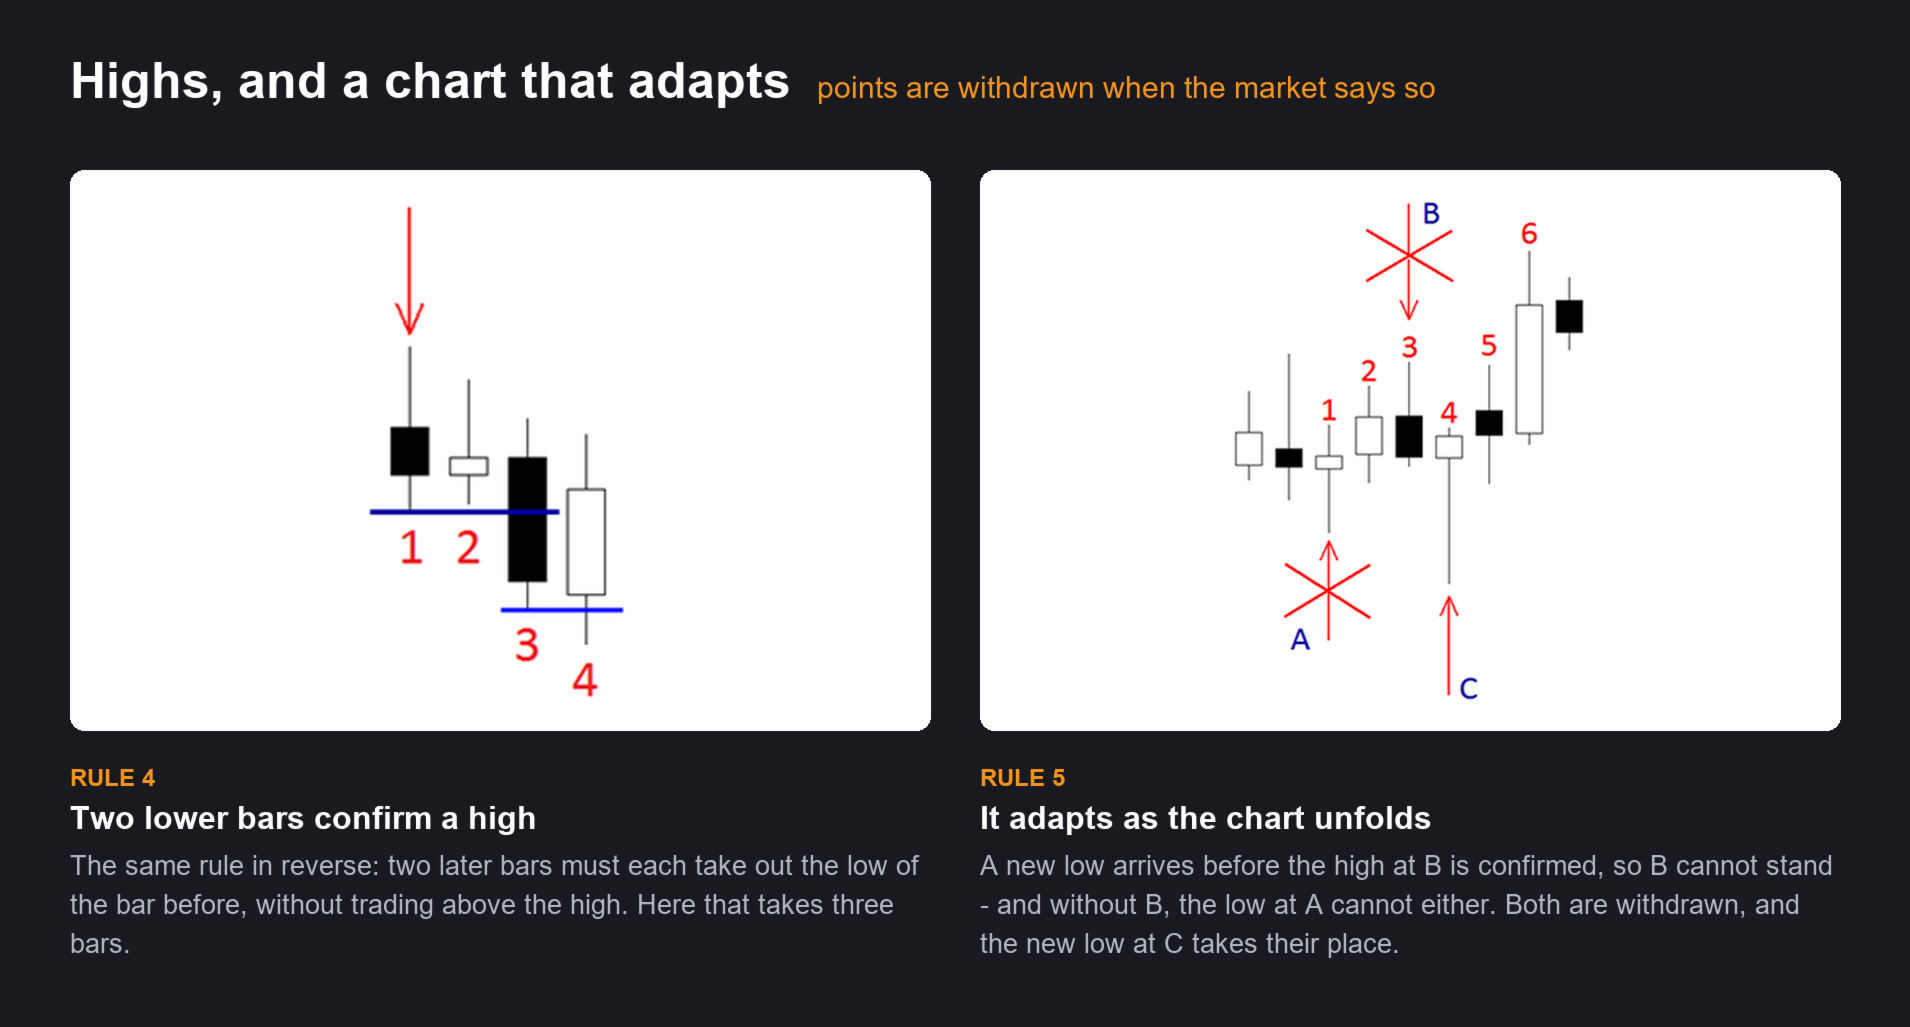
A high is confirmed when two subsequent bars each take out the low beneath them. A low when two take out the high above. The bars need not be consecutive — the market rarely obliges. Two is not an arbitrary number: two bars is how long the timeframe below takes to change trend, and it is that turn underneath which establishes the point above. Nothing is drawn until it is confirmed. A marker does not appear on a maybe and vanish on the next tick.
---
## NEW IN v6: THE MARKERS CARRY THE TREND
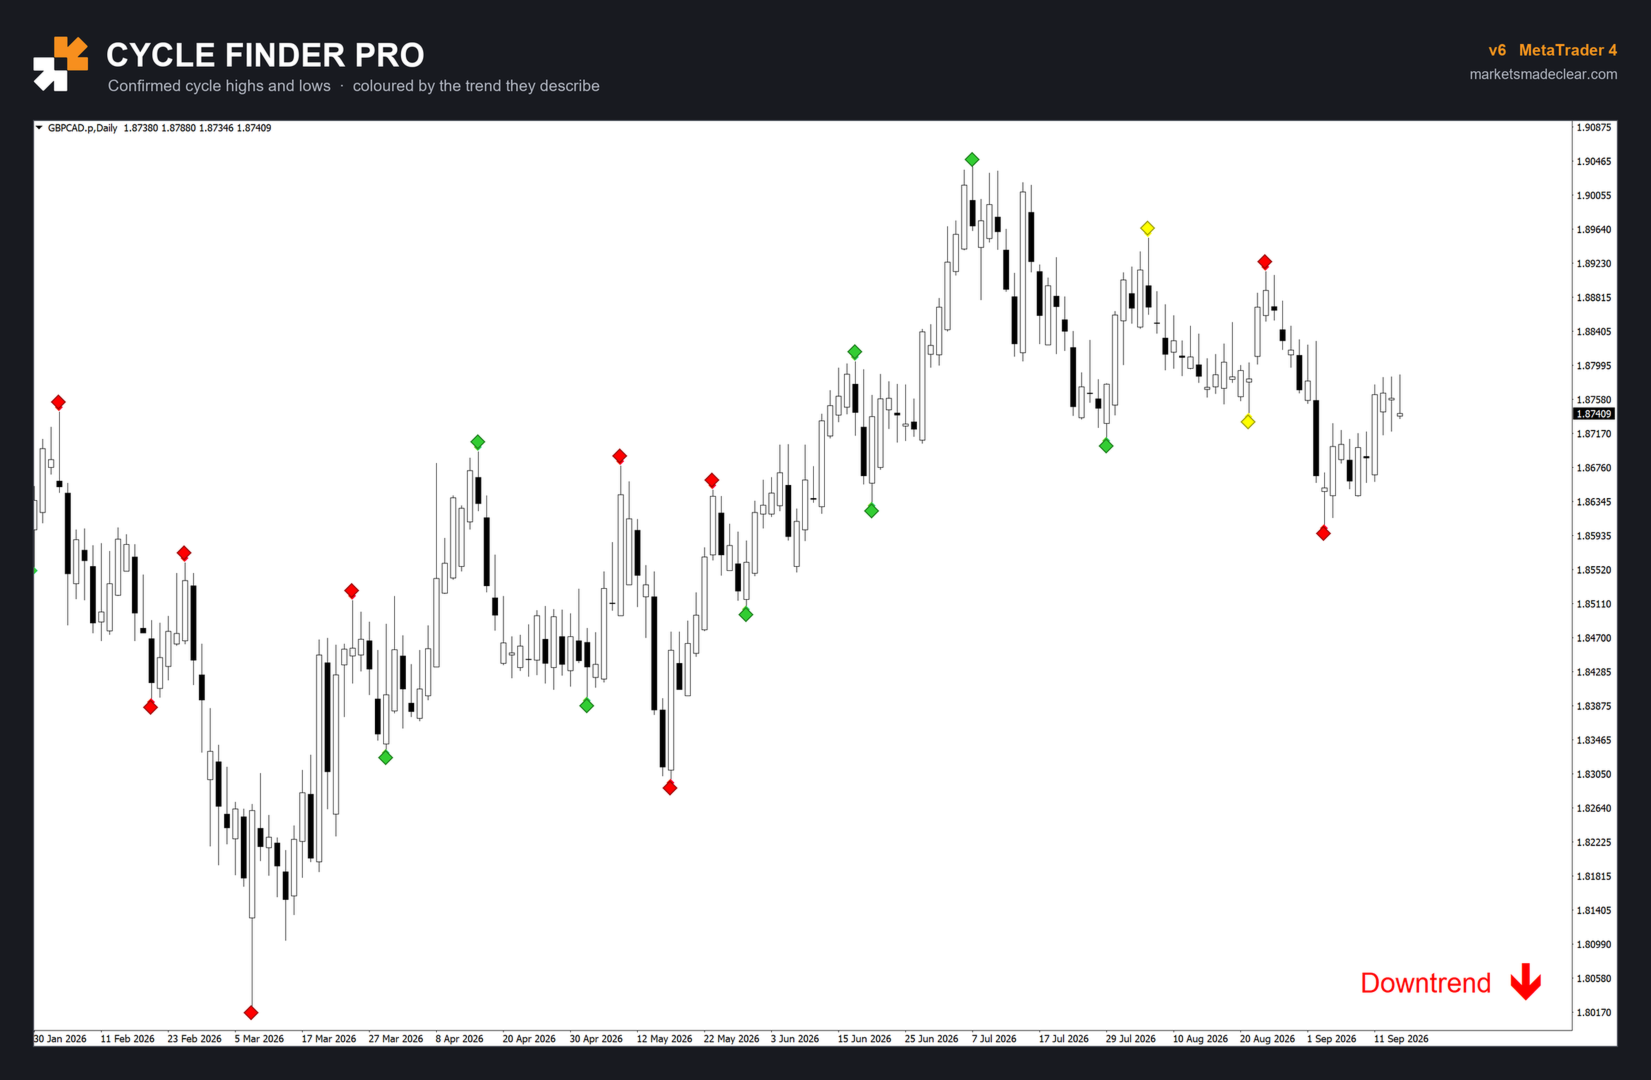
Every confirmed point is now coloured by the trend that held while it was the newest point on the chart:
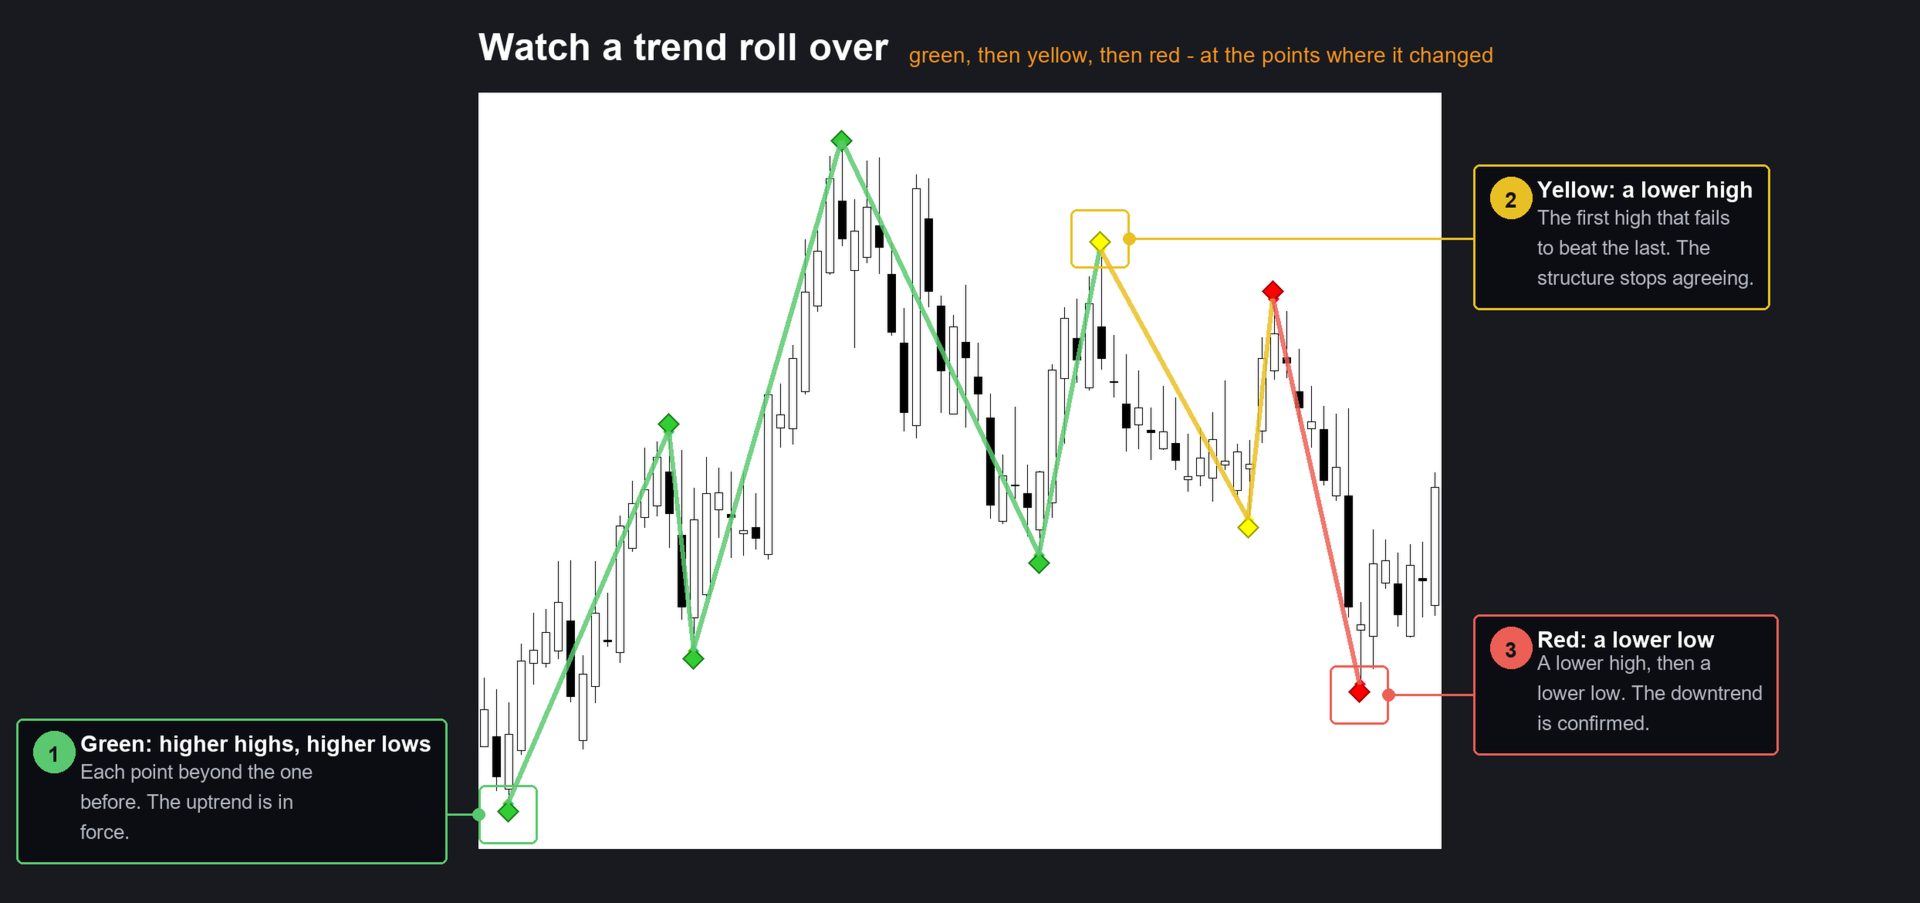
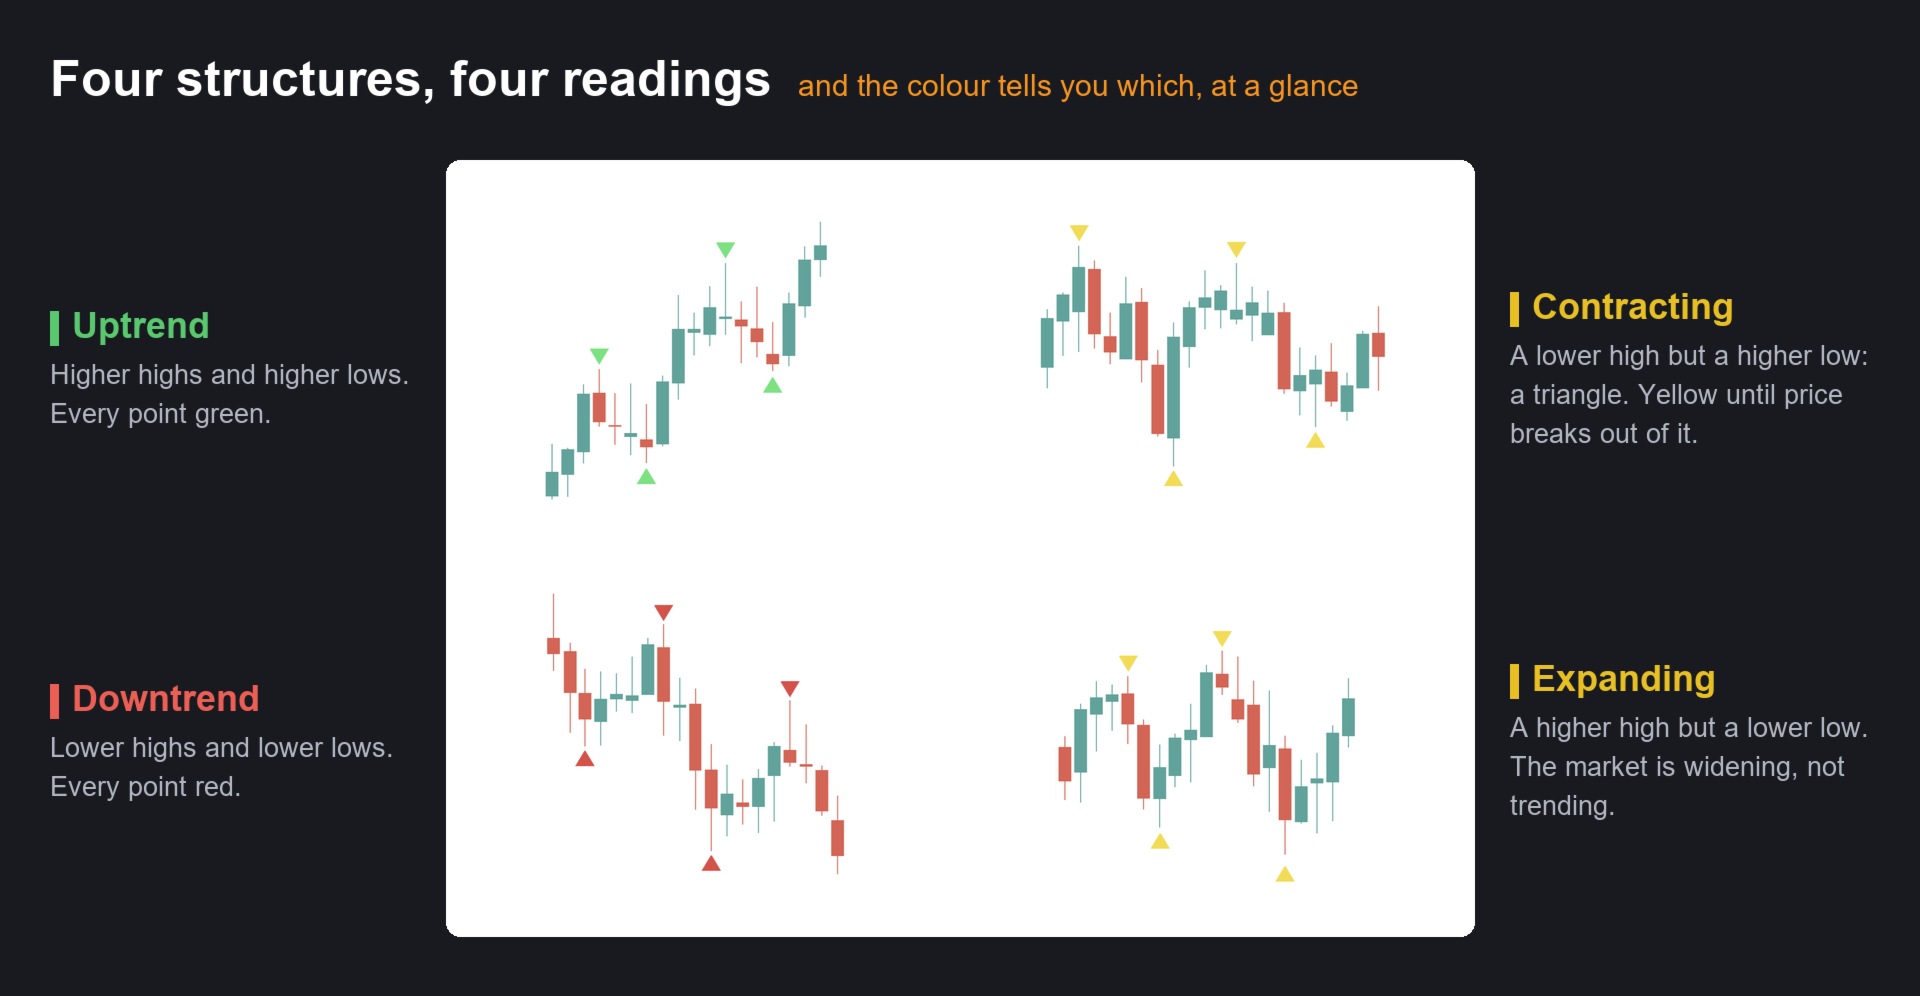
- **Green** — an uptrend was in force
- **Red** — a downtrend
- **Yellow** — neither
So the chart no longer just shows you where the cycles turned. It shows you what the structure meant *at the time*, all the way back. A run of green turning yellow and then red is a trend losing its footing and rolling over, marked at the exact points where it happened — and you can see it in one pass down the chart instead of working it out point by point.
The trend itself comes from the four most recent confirmed points, the same four you would count by hand.
---
## WHAT YOU SEE
**Coloured markers** at every confirmed cycle high and low, offset clear of the candle.
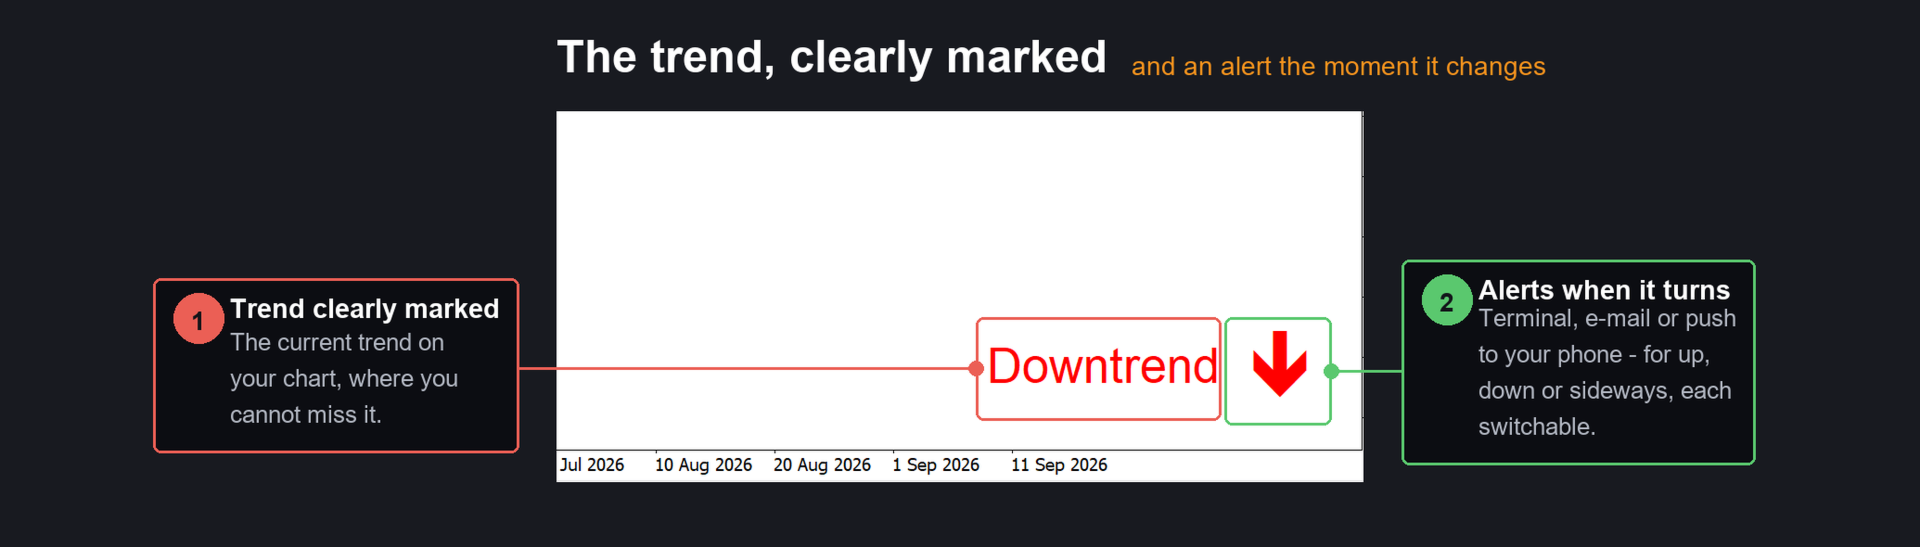
**Trend on the chart** — text and an arrow, in the corner you choose, with your own wording and colours.
**Alerts when the trend changes** — terminal, email and push to the MetaTrader mobile app, each switchable, and separately for up, down and sideways.
Works on every timeframe and every instrument: forex, indices, metals, crypto. The rules are about structure, so they do not care what is being priced.
---
## SETTINGS
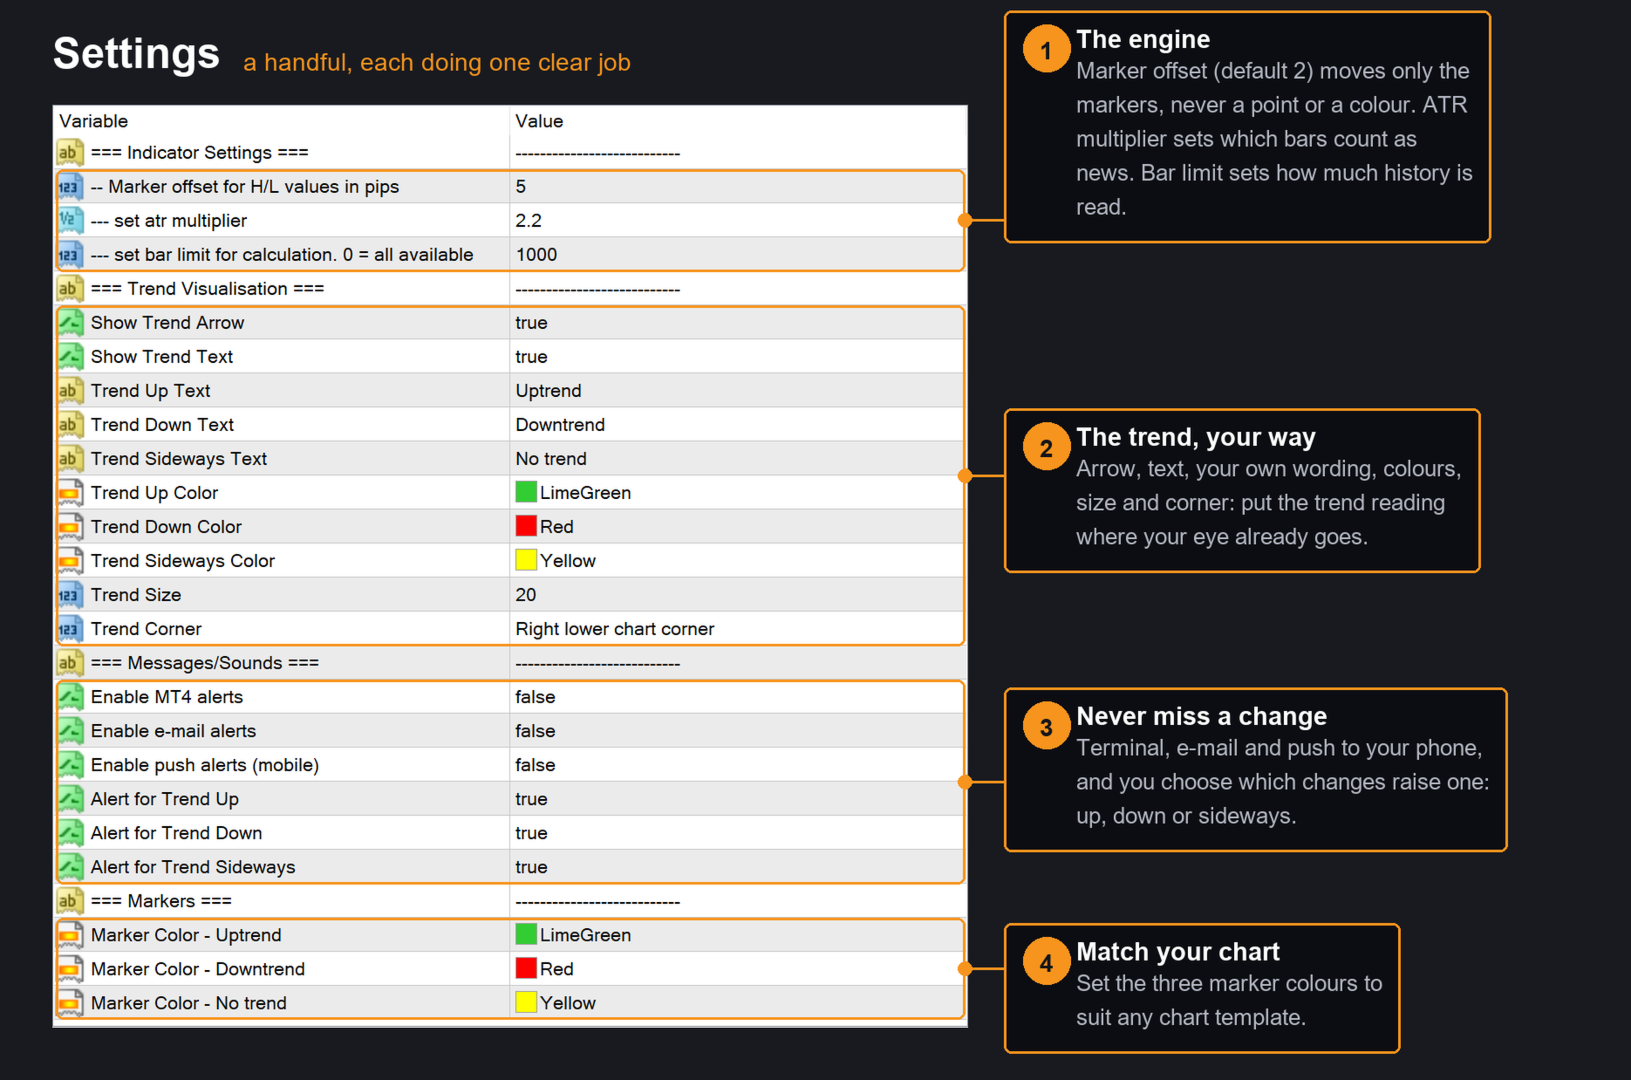
**Marker offset for H/L values in pips** — how far the markers sit from the candle. Default 2. Cosmetic: it does not change a single point or colour.
**ATR multiplier** — the oversized-bar threshold. Default 2.2. Raise it to treat fewer bars as news, lower it to treat more.
**Bar limit** — how much history to calculate. Default 1000, or 0 for everything available.
**Trend visualisation** — show or hide the arrow and the text, your own wording for up, down and sideways, the three colours, the size, and which corner it sits in.
**Alerts** — terminal, e-mail and push, and which trend changes should raise one.
**Marker colours** — the three trend colours, yours to set.
---
## HOW TO USE IT
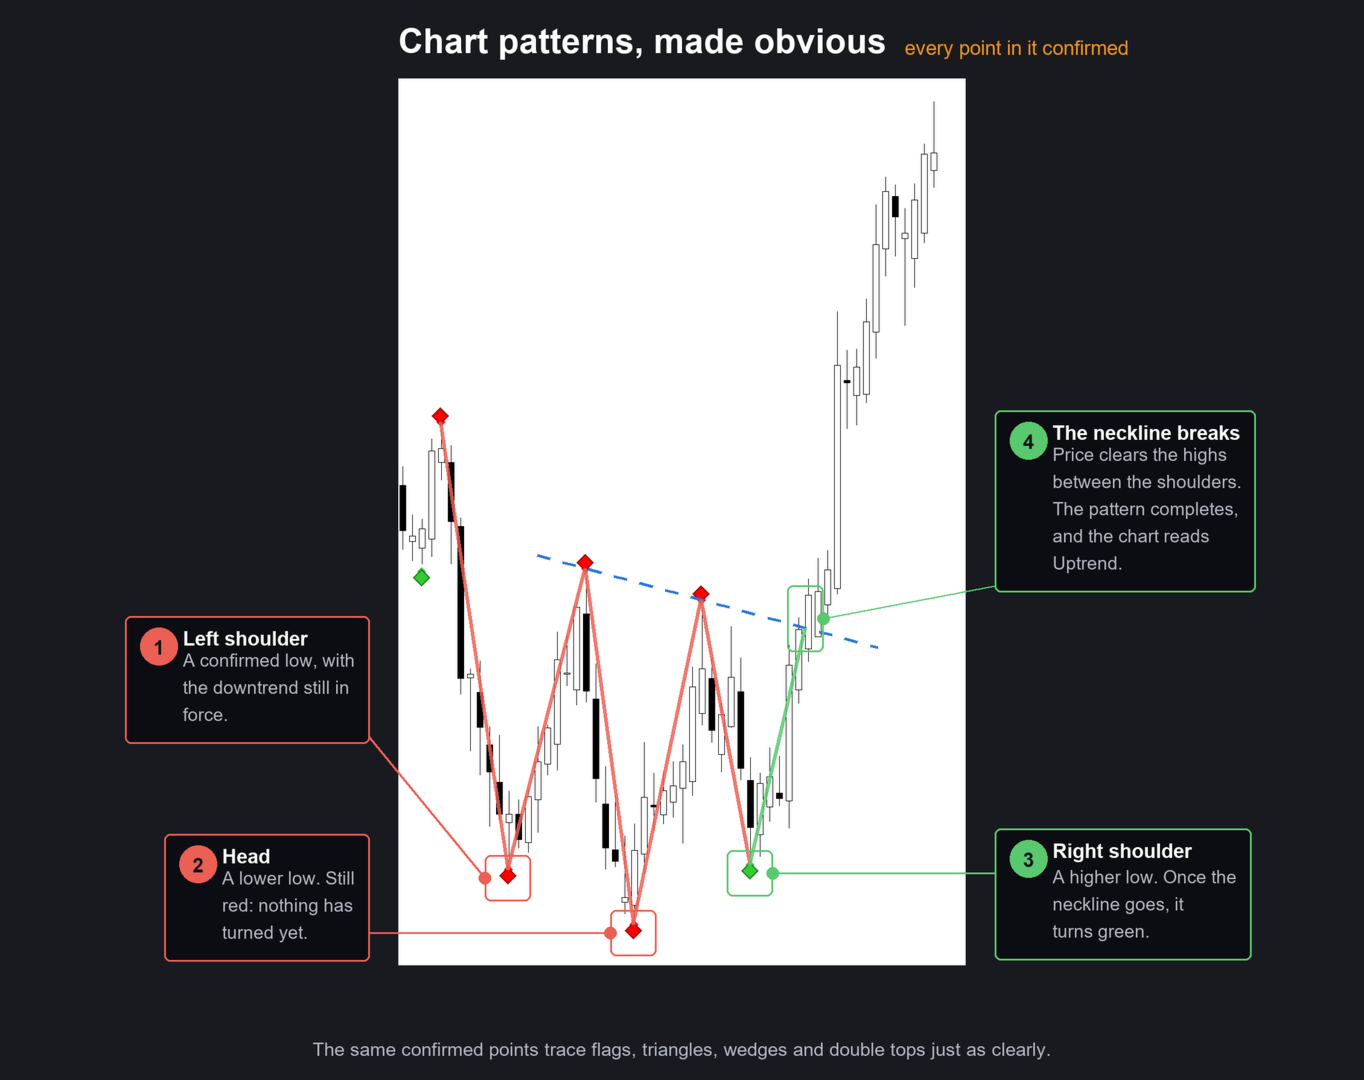
1. **Count the points.** Four confirmed points define a trend, five give you a head and shoulders. They are already marked; you are reading, not hunting.
2. **Read the colours backwards.** Where the colour changes is where the structure changed. That is the level the market disagreed about, and it is usually the level worth watching.
3. **Trade with the newest colour.** Green markers and a green trend means the structure is behind you. Yellow means the market has not decided — often the time to wait.
4. **Use it across timeframes.** The same rules apply everywhere, so a green daily under a green four-hour is the same message twice, from the same method.
---
## WHAT'S NEW IN v6
- Markers coloured to denote the trend detected.
- Oversized-bar handling rewritten: a more accurate reaction to news events.





















































excellent indicator...