Смотри обучающее видео по маркету на YouTube
Как купить торгового робота или индикатор
Запусти робота на
виртуальном хостинге
виртуальном хостинге
Протестируй индикатор/робота перед покупкой
Хочешь зарабатывать в Маркете?
Как подать продукт, чтобы его покупали
Технические индикаторы для MetaTrader 4 - 4
Индикатор iPump это универсальный индикатор, совмещающий в себе преимущества трех категорий индикаторов. одновременное определение тренда на нескольких ТФ определение зон сопротивление и поддержки определение зон перекупленности и перепроданности Функции индикатора: Определение тренда Данная функция будет необходима всем трейдерам, которые хотят объективно оценивать текущее направление рынка и избежать субъективизма. Вы за доли секунды сможете сравнить направление тренда на самых главных тайм

Стратегия Owl Smart Levels | Индикатор Owl Smart Levels | MT5 version | FAQ Индикатор Fractals – это один из элементов авторской торговой стратегии Билла Вильямса . Он служит для поиска на ценовом графике точек разворота цены, а следовательно и уровней поддержки и сопротивления. Индикатор Full Fractals – это усовершенствованный Fractals, который есть в инструментарии практически всех торговых терминалов. Его отличие лишь в том, что для построения фрактала мы используем 5 свечей слева и 2
FREE
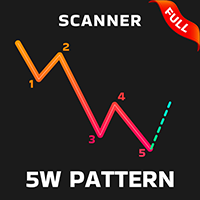
Contact me after payment to send you the User-Manual PDF File. 5W Pattern introduction The 5W pattern occurs when the price forms an alternating 5-wave cycle with its volatility. In fact, the 5W pattern is a price series of alternating HH or LL (higher high or lower low), which is the main characteristic of a trend. The pattern of 5W should have the characteristic of non-overlapping waves, also the points of the pattern are usually formed in Fibonacci levels. The completed pattern of 5W actua

Crystal Smart Volume Обзор Crystal Smart Volume для MT4 — это продвинутый индикатор анализа объема и дельты, разработанный для выявления активности институциональных трейдеров, скрытой за обычными движениями цены.
Он объединяет концепции Smart Money (SMC), Volume Spread Analysis (VSA) и дельта-логику для анализа как цены, так и поведения объема.
Индикатор определяет события, такие как покупочный климакс (Buying Climax), продажный климакс (Selling Climax), слабые свечи (Weak Candles) и высокообъе
FREE

Pulse Scalping Line - индикатор для выявления потенциальных точек разворота. На базе этого индикатора можно построить эффективную систему Мартингейл. По нашей статистике индикатор дает максимум 4 ошибочных точки разворота в серии. В среднем это 2 точки разворота. То есть, индикатор показывает разворот, он ошибочный. Значит второй сигнал индикатора будет с высокой вероятностью точный. Основываясь на данной информации можно построить торговую систему по принципу Мартингейл. Чтобы этот Мартингейл б
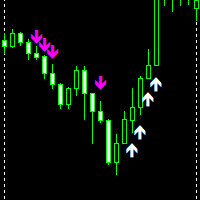
Up down Non-repaint is an MT4 indicator made to give accurate signals without disappearing. Magenta/Pink Arrow is your sell signal. white Arrow is your buy signal. indicator works on all pairs and timeframes 1 minute to Monthly timeframe. indicator is made for scalping do not hold trades for too long once arrows show the same direction you can add more entries all the best.!!
FREE

PPR and Engulfing – это уникальный технический индикатор, разработанный для выявления паттернов "PPR" и "Поглощение" на валютных графиках торговой платформы MetaTrader 4 (MT4). Эти паттерны могут указывать на возможные развороты или продолжения тренда, предоставляя трейдерам ценные сигналы для входа и выхода из рынка. Основные особенности: Автоматическое обнаружение паттернов : Индикатор автоматически идентифицирует и отмечает паттерны PPR и Поглощение стрелками на графике. Визуальные сигналы :
FREE
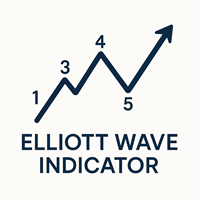
Индикатор Теории Волн Эллиотта для Meta Trader 4 Индикатор Теории Волн Эллиотта основан на одном из профессиональных концептов на рынке Форекс. Этот индикатор рисует структуру рынка в виде волн и считает пики как восходящие и нисходящие волны от 1 до 5. Пользователь может видеть волны Эллиотта и получать уведомления о новых номерах. Индикатор содержит две волны: Основную волну и Волну-Лет, отображая большие и маленькие волны разными цветами. Пользователь также может включать или отключать каждую
FREE
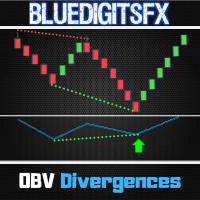
Версия для MT5 доступна здесь:
https://www.mql5.com/en/market/product/50538 Канал и группа в Telegram:
https://t.me/bluedigitsfx Доступ к VIP-группе:
Отправьте подтверждение оплаты в наш личный кабинет Рекомендуемый брокер:
https://bit.ly/BlueDigitsFxStarTrader BlueDigitsFx OBV Divergence — мощный индикатор для MT4, выявляющий дивергенции OBV и помогающий прогнозировать развороты рынка Индикатор BlueDigitsFx OBV Divergence анализирует цену и On-Balance Volume (OBV), чтобы автоматически выяв

Заголовок: Руководство по структуре BBMA - Руководство по структуре BBMA
Описание: BBMA Structure Guide - это специализированный индикатор MQL4, разработанный для помощи трейдерам в понимании структуры BBMA более легко и эффективно. BBMA, или "Bollinger Bands Moving Average", известен своим лозунгом "One Step Ahead", подчеркивающим важность глубокого понимания структуры рынка.
С BBMA Structure Guide вы можете быстро идентифицировать базовые паттерны структуры рынка, определяющие движение цен.

Представленный индикатор оценивает волатильность финансового инструмента и с высокой эффективностью подает сигналы о моментах существенного изменения направления движения цены. Индикатор интуитивно понятен и прост в использовании. Сигнал индикатора формируется после завершения формирования бара, на котором индикатор меняет свое положение относительно нуля. Индикатор никогда не перерисовывает сигнал. Сигналы индикатора должны подтверждаться превышением ценой максимума/минимума бара, на котором ин

Прежде всего стоит подчеркнуть, что этот Торговый Инструмент является Неперерисовывающимся Нерепейнтинговым Индикатором, что делает его идеальным для профессиональной торговли.
Онлайн-курс, руководство пользователя и демонстрация. Индикатор Концепций Умного Действия Цены - очень мощный инструмент как для новичков, так и для опытных трейдеров. Он объединяет более 20 полезных индикаторов в одном, комбинируя передовые торговые идеи, такие как анализ Inner Circle Trader и стратегии торговли концеп
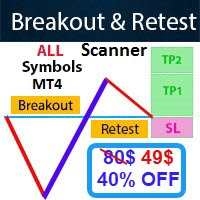
- Real price is 80$ - 40% Discount (It is 49$ now) Contact me for instruction, add group and any questions! - Non-repaint - I just sell my products in Elif Kaya profile, any other websites are stolen old versions, So no any new updates or support. - Lifetime update free Related product: Bitcoin Expert
Introduction The breakout and retest strategy is traded support and resistance levels. it involves price breaking through a previous level. The break and retest strategy is designed to help tr

Special offer in honor of the New Year and Christmas!! https://www.mql5.com/ru/users/bossik2810 Gold Scalper Super — это простая в использовании торговая система. Индикатор можно использовать как отдельную систему для скальпинга на тайм фрейме M1 , а также как часть вашей существующей торговой системы. Бонус: при покупке индикатора, Trend Arrow Super предоставляется бесплатно,напишите нам после покупки . Индикатор 100% не перерисовывается!!! Если сигнал появился, он больше Не исчезает! В отли
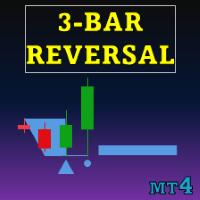
Special offer : ALL TOOLS , just $35 each! New tools will be $30 for the first week or the first 3 purchases ! Trading Tools Channel on MQL5 : Join my MQL5 channel to update the latest news from me Индикатор Трехбарного Разворота предлагает мощный инструмент для трейдеров, автоматически определяя и подчеркивая трехбарные разворотные паттерны на графике цен. Этот индикатор служит ценным ресурсом для обнаружения потенциальных разворотов тренда и позволяет пользователям улучшать точно

Delta Swing Pro - Multi-Timeframe Trend Consensus System for MT4 Concept: Capturing the Moment of Perfect Alignment The greatest adversary in trading is the "contradiction" between different timeframes. It is common to find a 5-minute chart showing a bullish trend while the 1-hour chart remains bearish. This conflict creates market noise that leads many traders into unprofitable traps. Delta Swing Pro is engineered to synchronize these varying timeframe vectors. It identifies the rare moments

этот показатель, основанный на вторичной разработке SuperTrend, включает в себя набор показателей для достижения функции, взвешенной по трем показателям: алгоритм MA, nrp и mtf.
ряд пунктуационных линий разделен на два цвета, оранжевый - пустой, зеленый - больше.
показатель SuperTrend - это первый в сети показатель искусственного интеллекта - стратегия торговли светофорами.
имитировать понятие неопределённости человеческого мозга, мышление, неизвестные или не поддающиеся определени
FREE
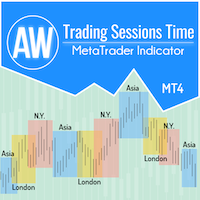
Для удобства трейдеров в получении данных о работе рынков и лучшего формулирования торговых стратегии, мы разработали индикатор торговой сессии. Время работы различных бирж влияет на торговлю, поскольку от этого зависит активность рынка и объемы торгов. Эти факторы определяют волатильность и возможности торговли разными инструментами. Индикатор AW Trading Sessions Time отображает время работы азиатского, Лондонского и Нью-Йоркского рынков. Трейдеры могут отобразить или скрыть различные часовые
FREE
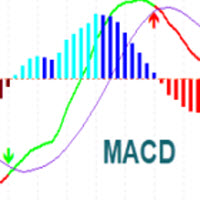
MACD Indicator It has MACD line, Signal line, and Histogram. The Histogram has 4 colors based on Direction Above and Below the Zero Line, showing its movement direction as simple as possible. Allows Show MACD & Signal Line, Show Change In color of MACD Line based on cross of Signal Line. Show Dots at Cross of MacD and Signal Line, Turn on and off Histogram. Enjoy your trading experience, and feel free to share your comments and reviews.
If you are interested in this indicator, you might
FREE

Свинг-трейдинг - это первый индикатор, предназначенный для обнаружения колебаний в направлении тренда и возможных разворотов. Он использует базовый подход свинговой торговли, широко описанный в торговой литературе. Индикатор изучает несколько векторов цен и времени для отслеживания направления совокупного тренда и выявляет ситуации, когда рынок перепродан или перекуплен и готов к исправлению. [ Руководство по установке | Руководство по обновлению | Устранение неполадок | FAQ | Все продукты ]
П

The Market Sessions indicator is a popular tool among forex and stock traders for visually representing global trading sessions on a price chart. It highlights the time periods for major trading sessions — such as the Asian (Tokyo) , European (London) , and American (New York) sessions — directly on the chart. This helps traders identify when markets open and close, allowing for better decision-making based on session-specific trading behavior. - Asian Session (Default: 00:00-09:00) - Lo
FREE
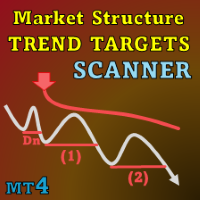
Special offer : ALL TOOLS , just $35 each! New tools will be $30 for the first week or the first 3 purchases ! Trading Tools Channel on MQL5 : Join my MQL5 channel to update the latest news from me I. Введение
Market Structure Trend Targets Scanner — мощный инструмент для анализа рыночных трендов, выявления точек прорыва и управления рисками с помощью динамического стоп-лосса. Отслеживая предыдущие максимумы и минимумы для определения прорывов, этот инструмент помогает трейдерам б
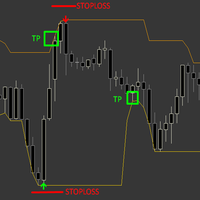
The Sure Reverse Channel is a dynamic non repaint trend indicator with entry arrows, the indicator focuses on catching a reverse swing in the market by using channel and price action formula, the indicator comes with built-in money management . HOW TO TRADE : Open buy trade when buy arrow pops up and set your SL below arrow, for TP you have TP which is opposite band. Open sell trade when sell arrow pops up and set your SL above arrow, for TP you have TP which is opposite band. band.
Why is
FREE
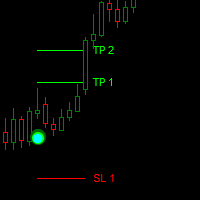
Dark Point is an Indicator for intraday trading. This Indicator is based on Trend Following strategy, also adopting the use of the atr to determine the right volatility. We can enter in good price with this Indicator, in order to follow the strong trend on the current instrument. If you love Dark Point, consider adding some power: Dark Power
Key benefits
Easily visible take profit/stop loss lines Intuitive directional points/arrows by colors Useful statistics , which indicate the win ra
FREE

Базовый индикатор Renko - это мощный инструмент для трейдеров, которым нужна ясная и четкая перспектива рынка. Наш индикатор не только упрощает визуализацию тренда, но и предлагает точные предупреждения о разворотах, обеспечивая стратегическое преимущество в вашей торговле / Бесплатная версия MT5
Особенности Полностью настраиваемый: Настройте индикатор в соответствии с вашими предпочтениями с помощью расширенных возможностей настройки. Вы можете полностью контролировать отображение информации
FREE

TMA Currency Meter эффективно измеряет силу валют. Пользуясь треугольной скользящей средней (Triangular Moving Average) всех доступных символов, индикатор показывает, какие из валют сильны/слабы или усиливаются/ослабевают. Как опытные трейдеры, так и новички могут увидеть сильные и слабые валюты в мгновение ока и оценить возможности для последующей торговли. TMA Currency Meter - настоящий мультитаймфреймовый индикатор. Индикатор может отображать как силу валют текущего таймфрейма, так и более кр

Looking for a powerful yet lightweight swing detector that accurately identifies market structure turning points?
Want clear, reliable buy and sell signals that work across any timeframe and any instrument?
Buy Sell Arrow MT Swing is built exactly for that — precision swing detection made simple and effective. This indicator identifies Higher Highs (HH) , Higher Lows (HL) , Lower Highs (LH) , and Lower Lows (LL) with remarkable clarity. It is designed to help traders easily visualize market str

Special offer : ALL TOOLS , just $35 each! New tools will be $30 for the first week or the first 3 purchases ! Trading Tools Channel on MQL5 : Join my MQL5 channel to update the latest news from me Индикатор Supertrend Fakeout является усовершенствованной версией классического индикатора Supertrend , разработанного для обеспечения более надежных сигналов тренда. Благодаря включению таких усовершенствованных функций, как Fakeout Index Limit и Fakeout ATR Mult, этот индикатор помогае
FREE

ICT, SMC, Smart Money Concept, Support and Resistance, Trend Analysis, Price Action, Market Structure, Order Blocks, Breaker Blocks, Momentum Shift, Strong Imbalance, HH/LL/HL/LH, Fair Value Gap, FVG, Premium & Discount Zones, Fibonacci Retracement, OTE, Buyside Liquidity, Sellside Liquidity, Liquidity Voids, Market Sessions,Market Time, NDOG, NWOG,Silver Bullet,ict template
На финансовом рынке точный анализ рынка критически важен для инвесторов. Чтобы помочь инвесторам лучше понять тенденции ры

Индикатор строит трехпериодный семафор и фигуру разворота 123 от экстремума. Сигнал приходит на открытии второй свечи. По этому паттерну можно торговать разными способами (тест точки 3, пробой и другие). Выход из канала или пробой трендовой - это главный триггер для поиска точки входа. Значки окрашены в соответствии с уровнями Фибоначчи. Желтые значки указывают на тест уровня, при котором сигнал усиливается. Используя мультивалютную панель инструментов, вы можете отслеживать, на каких валютных

Или (TDO), который представляет собой индекс, который измеряет скорость изменения цен, используя принцип « чистого импульса ».
Когда цена ценной бумаги повышается с 10 до 15, скорость изменения цены составляет 150%, но когда она снижается с 15 до 10, скорость изменения цены составляет всего 33,3%. Вот почему индикаторы технического анализа, такие как «Скорость изменения цены» (ROC) или «Моментум», дают более высокие значения для восходящих движений цены, чем для нисходящих. TDO устраняет эту про

Индикатор разворота ADR сразу показывает, где в настоящее время торгуется цена относительно своего нормального среднего дневного диапазона. Вы будете получать мгновенные оповещения через всплывающие окна, электронную почту или push-уведомления, когда цена превышает свой средний диапазон и уровни выше него по вашему выбору, чтобы вы могли быстро переходить к откатам и разворотам. Индикатор рисует на графике горизонтальные линии на экстремумах среднего дневного диапазона, а также расширения выше

Simple QM Pattern is a powerful and intuitive trading indicator designed to simplify the identification of the Quasimodo (QM) trading pattern. The QM pattern is widely recognized among traders for effectively signaling potential reversals by highlighting key market structures and price action formations. This indicator helps traders easily visualize the QM pattern directly on their charts, making it straightforward even for those who are new to pattern trading. Simple QM Pattern includes dynamic
FREE
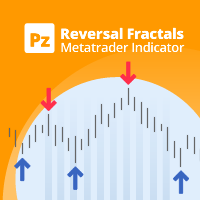
Это последняя версия моего знаменитого индикатора Reversal Fractals, впервые опубликованного почти десять лет назад. Он исследует ценовую структуру фракталов, чтобы определить возможные точки разворота на рынке, предоставляя время позиционным трейдерам, у которых уже есть фундаментальная или техническая модель оценки. [ Руководство по установке | Руководство по обновлению | Устранение неполадок | Часто задаваемые вопросы | Все продукты ] Фракталы разворота могут запускать длинные тренды Индикат
FREE

Reversal Zones Pro – это индикатор, специально разработанный для точного определения ключевых зон разворота тренда .Он рассчитывает средний истинный диапазон движения цены от нижних до верхних границ и визуально отображает прямо на графике потенциальные зоны,помогая трейдерам эффективно выявлять важные точки разворотов тренда. Основные функции: Определение зон разворота : Визуальное отображение индикатором потенциальных зон разворота прямо на графике. Это помогает трейдерам эффективно выявлят

PROFESSIONAL FOOTPRINT CHART INDICATOR
A Footprint Chart is an advanced order flow visualization tool that displays the volume traded at each price level within a candlestick. Unlike traditional candlestick charts that only show open, high, low, and close prices, footprint charts reveal the battle between buyers and sellers at every price level. KEY CONCEPT: Footprint charts show WHERE volume occurred, not just HOW MUCH volume occurred. This is critical for understanding institutional activ
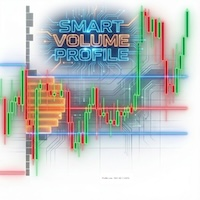
Russian Сканирование «Smart Money» (Volume Markers): Стрелки указывают на аномальный объем (выше среднего) с четким разделением на зеленый/красный цвета. Это помогает определить вход крупных игроков и отфильтровать ложные сигналы. Важные оповещения (Alerts): Не нужно постоянно следить за экраном. Система мгновенно уведомит вас, когда цена пересечет линию POC (центр объема), что часто является решающим моментом для продолжения или разворота тренда. Текущая структура рынка (Developing Profile): По

Специальное предложение : ALL TOOLS , всего по $35 каждый! Новые инструменты будут по $30 в течение первой недели или первых 3 покупок ! Trading Tools Channel on MQL5 : подпишитесь, чтобы получать самые свежие новости RSI Shift Zone Scanner определяет моменты возможного изменения рыночного настроения, связывая сигналы RSI с движением цены. Когда RSI выходит выше или ниже заданных уровней (по умолчанию 70 — перекупленность, 30 — перепроданность), индикатор рисует канал прямо на граф

It is FREE on EURUSD chart. All Symbols version! Contact me for any questions Introduction The breakout and retest strategy is traded support and resistance levels. it involves price breaking through a previous level. The break and retest strategy is designed to help traders do two main things, the first is to avoid false breakouts. Many false breakouts start with a candlestick that breaks out of a level but ends with an immediate candlestick that brings the price back into the level. The
FREE

Наш индикатор Basic Candlestick Patterns позволяет определять основные свечные модели как никогда легко. Откройте для себя такие модели, как Молот, Вечерняя звезда, Три белых солдата и многие другие, просто взглянув на свой график. Благодаря интуитивно понятному интерфейсу и четким визуальным подсказкам наш индикатор поможет вам быстро и точно определить торговые возможности / версия MT5
Сканер приборной панели для этого индикатора: ( Basic Candlestick Patterns Dashboard )
Особенности Точнос
FREE

MCAD - это сокращение от M ulti C urrency A ccumulation/ D istribution (многовалютное накопление-распределение), которое не следует путать с широко известным MACD. MCAD вычисляет относительную силу накопления-распределения объемов для отдельных валют Форекса (то есть их синтетическое влияние, выделенное из валютных пар), индексов, CFD и прочих групп символов. Он использует стандартную формулу распределения-накопления ( статья Википедии ) и может применяться как к тиковым объемам, так и к псевдо-

Этот индикатор проверяет каждый бар на наличие давления покупателей или продавцов и определяет 4 типа свечных паттернов с наибольшим объемом. Затем эти свечи фильтруются с помощью нескольких линейных фильтров, чтобы показать сигналы покупки или продажи. Сигналы работают лучше всего в сочетании с более высоким направлением таймфрейма и при торговле в часы больших объемов. Все фильтры настраиваются и работают независимо. Может просматривать сигналы одного направления одним нажатием кнопки. Этот и

Профиль рынка Форекс (сокращенно FMP) Чем это не является:
FMP не является классическим отображением TPO с буквенным кодом, не отображает общий расчет профиля данных диаграммы и не сегментирует диаграмму на периоды и не вычисляет их.
Что оно делает : Что наиболее важно, индикатор FMP будет обрабатывать данные, которые находятся между левым краем спектра, определяемого пользователем, и правым краем спектра, определяемого пользователем. Пользователь может определить спектр, просто потянув мышь
FREE

Dark Support Resistance is an Indicator for intraday trading. This Indicator is programmed to identify Support and Resistance Lines , providing a high level of accuracy and reliability.
Key benefits
Easily visible lines Only the most important levels will be displayed Automated adjustment for each timeframe and instrument Easy to use even for beginners Never repaints, never backpaints, Not Lag 100% compatible with Expert Advisor development All types of alerts available: Pop-up, Email, Push

Introducing the Delta Volume Profile Indicator - Unleash the Power of Institutional Precision! Technical Indicator: Are you ready to trade like the pros? The Delta Volume Profile Indicator is no ordinary tool. It’s a high-precision, cutting-edge indicator that puts the power of institutional-grade trading in your hands. This unique indicator analyses delta volume distribution in real-time, revealing the market's hidden buy/sell imbalances that the biggest financial institutions rely on to antic

Трендовый индикатор, базирующийся на скользящей средней Хала (Hull Moving Average - HMA) с двумя периодами. Скользящая Хала является усовершенствованным вариантом скользящей средней, которая достаточно точно показывает момент разворота тренда, ее часто применяют в качестве фильтра сигналов. Сочетание двух периодов скользящей Хала полнее использует эти преимущества: HMA с медленным периодом определяет тренд, HMA с быстрым периодом - краткосрочные движения и сигналы в сторону тренда.
Особенности
FREE
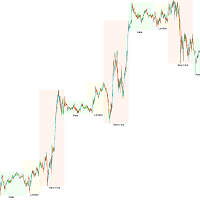
Торговая сессия KillZone — Раскрой силу рыночного тайминга
Успешные трейдеры знают одну истину: тайминг решает всё. Разные торговые сессии приносят различную активность, волатильность и возможности. Чтобы помочь вам ясно видеть эти изменения и использовать их, мы создали индикатор Trading Session KillZone. Этот индикатор выделяет активное время азиатской, лондонской и нью-йоркской сессий, давая вам полное представление о том, когда рынок наиболее живой. Вы можете настраивать отображение — показ
FREE

Apollo Pips - это высокоточный индикатор разворота тренда для торговли на любой валютной паре. Изначально разрабатывался для торговли XAUUSD, но практика показала, что индикатор можно успешно использовать и на других парах. Рекомендуемый тайм фрейм H1. Индикатор делает оповещение только, когда сигнал подтвержден. Поэтому, если вы увидели оповещение, то можете смело пользоваться полученным сигналом. Индикатор НЕ ПЕРЕРИСОВЫВАЕТ свои сигналы! Стрелка может моргать пока сигнал не подтвержден. Когда

Трендовый индикатор Trend _ Scalper _ Arrows _ Entry & Exit отлично следует за трендом, указывает зоны поиска входа, указывает сигналы на вход стрелками, а также указывает зоны фиксации рыночных ордеров вертикальными линиями. Отличный индикатор как для новичков в торговле на Форекс, так и для профессионалов. Все линии, стрелки, оповещения можно отключить. Все параметры индикатора смотрите на скриншоте.

Introducing the Volume Order Blocks indicator, a game-changing tool designed for traders who demand precision and clarity in their market analysis. This advanced indicator not only identifies order blocks but also integrates crucial volumetric data, allowing you to gauge the strength of these blocks with unparalleled accuracy. MT5 version - https://www.mql5.com/en/market/product/121238/ Key Features of the Volume Order Blocks: Bullish & Bearish Order Blocks: Easily visualize and dif

Многофреймовая гистограмма спроса и предложения
Описание:
Многофреймовая гистограмма спроса и предложения — это мощный и чистый индикатор, который показывает силу рыночного спроса и предложения на нескольких таймфреймах, в частности H4 и D1. Он отображает гистограммы, выделяющие моменты доминирования покупателей или продавцов, позволяя трейдерам быстро определять ключевые зоны рыночного давления. Ключевые особенности: Гистограммы H4 и D1: Четкая визуализация силы рынка на старших таймфреймах.
FREE
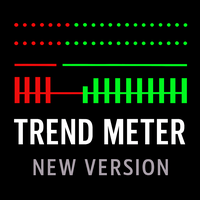
Индикатор анализа тренда для нескольких валютных пар в MetaTrader 4, отображающий направление и силу тренда на нескольких таймфреймах. Только для анализа. TREND METER – ИНДИКАТОР АНАЛИЗА ТРЕНДА ДЛЯ НЕСКОЛЬКИХ ВАЛЮТ (MT4) Trend Meter — это технический индикатор анализа тренда, предназначенный для визуализации направления тренда, силы тренда и согласованности тренда на нескольких таймфреймах и символах. Индикатор предназначен исключительно для визуального анализа и не открывает сделки автоматичес
Gold Trend M1 - Optimized Scalping Tool for Gold (XAUUSD) Gold Trend M1 is a high-frequency trading indicator for the MetaTrader 4 platform, specifically optimized for the M1 timeframe on the Gold market. It combines a powerful SuperTrend trend filter with buy/sell signals derived from Heiken Ashi calculation logic, helping traders identify precise and disciplined entry points for optimal trading performance.
Key Features Optimized for M1 Scalping: Specifically developed for high-speed scalping

Описание (MT4)
Этот индикатор определяет моменты повторного входа цены (ReEntry) после того, как свеча пробила наружу полосы Боллинджера, сочетая этот сигнал с опциональным подтверждением RSI для уменьшения ложных срабатываний.
Buy ReEntry сигнал возникает, когда цена опустилась ниже нижней полосы, а затем вернулась внутрь, при этом опционально подтверждается выходом RSI из зоны перепроданности.
Sell ReEntry сигнал генерируется, когда цена поднялась выше верхней полосы, а затем снова вошла внут
FREE

Vital Structure MT4 Индикатор рыночной структуры для: маркировки свингов HH / HL / LH / LL, автоматических трендовых линий и многофреймовой (MTF) поддержки и сопротивления (ключевые уровни). Vital Structure — это инструмент анализа графика для трейдеров, использующих price action, рыночную структуру, трендовые линии, поддержку и сопротивление, а также многофреймовый анализ. Он определяет подтверждённые свинговые точки, классифицирует структуру (HH/HL/LH/LL), строит трендовые линии на основе стру
FREE

The Hydra Multi Trend Dashboard is a powerful market scanning tool designed for MetaTrader 4 and MetaTrader 5. It monitors up to 25 currency pairs or assets simultaneously across all 9 standard timeframes (M1 to Monthly). Using a proprietary Special Trend Formula , the dashboard filters out market noise and provides clear, visual Bullish or Bearish signals, allowing traders to identify trend alignments at a glance without switching charts. Setup & Guide:
Download MT5 Version here. Exclusivel

Contact me after payment to send you the User-Manual PDF File.
Triangle Pattern
Sometimes the price cannot make higher highs or lower lows and it moves in a converging price range and waves are shorter than before until the movement creates a geometric shape of a symmetrical triangle, which indicates It is maybe the end of the trend. The triangle pattern is a well-known in forex and the trading plan and strategy of many traders is based on it.
The Triangle Pattern Scanner Indicator It is usu
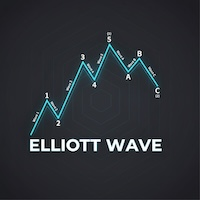
Автоматическая Волновая теория Эллиотта (Automated Elliott Wave) 1. Автоматический подсчет волн и снижение предвзятости (Объективность) Обычно подсчет волн Эллиотта сопряжен с субъективностью или "фантазиями" трейдера. Этот индикатор помогает: Находить Импульсные волны (1-2-3-4-5): Использует строгие правила (например, волна 3 не может быть самой короткой, волна 4 не должна перекрывать волну 1), отображая теоретически правильную структуру цены. Находить Коррекционные волны (A-B-C): Помогает пойм

Информационная панель Moving Average Currency Strength Dashboard — это мощный и всеобъемлющий индикатор, который дает глубокое представление о динамике валюты по нескольким символам и таймфреймам. Этот надежный инструмент использует скользящие средние для определения последних точек пересечения и эффективно отслеживает силу валют вплоть до текущей цены. Благодаря интуитивно понятному дизайну и удобному интерфейсу эта информационная панель предлагает трейдерам огромное количество информации, с

Вы устали вручную рисовать уровни Фибоначчи на своих графиках? Вы ищете удобный и эффективный способ определения ключевых уровней поддержки и сопротивления в своей торговле? Не смотрите дальше! Представляем DrawFib Pro, совершенный индикатор для MetaTrader 4, который выполняет автоматические уровни Фибоначчи. рисование на ваших графиках и предоставление своевременных предупреждений при нарушении этих уровней. С DrawFib Pro вы можете улучшить свои торговые стратегии, сэкономить время
FREE

Introducing our exciting new Price Retest indicator! Get instant alerts when the price retests, giving you a powerful edge in your trading strategy. Remember to do your own analysis before making any moves in the market. MT5 Version - https://www.mql5.com/en/market/product/118159/ Join To Learn Market Depth - https://www.mql5.com/en/channels/suvashishfx
Here’s a detailed explanation of how the Price Retest indicator works, its components, and how you can incorporate it into your trading str
FREE

нестандартный подход к стандартному индикатору скользящей средней. суть индикатора состоит в определение силы и быстроты направление цены определением угла наклона скользящей средней. берется точка на пятнадцатой свечи MA и точка на последней закрытой свече MA, между ними проводится прямая линия, она подвижна и на полусфере показывает угол наклона от 90 градусов до -90. выше 30 градусов зона покупок, ниже -30 градусов зона продаж. выше 60 градусов зона сильных покупок ниже -60 сильных продаж. ин

Мультитаймфреймовый индикатор ZigZag. Отображает линии поддержки/сопротивления и их пробитие, а также рисует текущие цели рынка. Также могут быть отображены линии индикатора Фракталы, и свечи с других таймфреймов (до Квартала включительно).
Индикатор перерисовывает последнюю (текущую) точку, а в некоторых случаях может изменить последние 2-3 точки.
Все линии рисуются объектами (не индикаторными буферами, но есть возможность получать данные для ЕА ). При использовании в советнике, вы можете пр
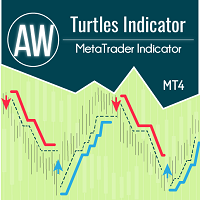
Индикатор работает по системе Черепах и классически предполагает временной интервал 20 и 55 свеч. На заданном временном интервале отслеживается тренд. Вход осуществляется в момент пробоя уровня поддержки или сопротивления. Сигнал выхода – пробой цены в обратном направлении тренда того же временного интервала. Преимущества:
Инструменты: Валютные пары, акции, сырьевые товары, индексы, криптовалюты Таймфрейм: Классически D1, также подходит для работы с любыми таймфреймами Время торговли: круглосу
FREE

ADX arrow
Индикатор отображает в виде точек на графике сигналы пересечений линий индикатора ADX (Average Directional Movement Index, индекс направленного движения). Это визуально облегчает выявление сигналов. Также в индикаторе есть алерт (всплывающее окно сообщения) и отправка сигналов на электронную почту.
Параметры Period - период усреднения. Apply to - метод применения, цена закрытия-открытия, максимальная за период цена, минимальная за период цена, медианная цена, (high+low)/2, типичная ц

Title: SMC Structure for EURUSD Description: This indicator is designed to map market structures based on Smart Money Concepts (SMC). It identifies Swing Structure, Internal Structure, Order Blocks, and Fair Value Gaps (FVG). The tool is optimized for performance to manage resources efficiently on the MetaTrader platform. Key Features: 1. Market Structure Mapping Identifies Major Swing Structure with BOS (Break of Structure) and CHoCH (Change of Character). Displays Internal Structure to visual
FREE

The Key level wedge indicator automatically draws rising wedge pattern and falling wedge pattern for you on the chart. This pattern is really good when used as a confirmation entry at key support & resistance, supply & demand and reversal zones.
Advantages
The Key level wedge block DOES NOT RE-PAINT, giving you confidence when a signal appears and also helps when looking back. The Key level wedge includes an on/off button on the chart to easily keep the charts clean after analysis by just o
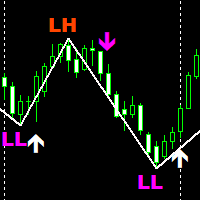
SMC Traders is a non-repaint indicator that is based on Price Action The indicator uses current market structure to predict future reversals. The indicator can be used with our free Market structure zig zag which can be found here: https://www.mql5.com/en/market/product/91579 Please note to find the HH AND HL CLINK ON LINK ABOVE Timeframes: 15 minutes for scalping 1 Hour for swing trading Purple Arrow look for sells in conjunction with LL White Arrow look for buys in conjunction with HL
FREE

Moving Average Convergence Divergence (MACD) торговая стратегия - это популярный инструмент технического анализа, который используется для выявления изменений в импульсе и направлении тренда. MACD рассчитывается путем вычитания 26-периодного экспоненциального скользящего среднего (EMA) из 12-периодного EMA. Затем на вершине MACD строится 9-периодное EMA, называемое "линией сигнала", которое действует как триггер для сигналов покупки и продажи. MACD считается находящимся в бычьей территории, когд
FREE

Gendel Gendut is Binary Option Indicator From @realTatino Trade with expaired time Pairs : All Forex Pair Time Frame : M5 only Trade Time All Time Alert : Alert Message, Alert Email, Alerts Push Buffer : 4 Buffer (0,2 (Buy) || 1,3 (Sell) Broker Suitable : All Broker Binary With Forex Pair Auto Trade : Yes Repaint : NO Delay : NO Other Binary Indicator : https://www.mql5.com/en/market/product/70915 https://www.mql5.com/en/market/product/71054
https://www.mql5.com/en/market/product/57755
etc IND
А знаете ли вы, почему MetaTrader Market - лучшее место для продажи торговых стратегий и технических индикаторов? Разработчику у нас не нужно тратить время и силы на рекламу, защиту программ и расчеты с покупателями. Всё это уже сделано.
Вы упускаете торговые возможности:
- Бесплатные приложения для трейдинга
- 8 000+ сигналов для копирования
- Экономические новости для анализа финансовых рынков
Регистрация
Вход
Если у вас нет учетной записи, зарегистрируйтесь
Для авторизации и пользования сайтом MQL5.com необходимо разрешить использование файлов Сookie.
Пожалуйста, включите в вашем браузере данную настройку, иначе вы не сможете авторизоваться.