Watch the Market tutorial videos on YouTube
How to buy а trading robot or an indicator
Run your EA on
virtual hosting
virtual hosting
Test аn indicator/trading robot before buying
Want to earn in the Market?
How to present a product for a sell-through
Technical Indicators for MetaTrader 4 - 12

Turbo Trend technical analysis indicator, which determines the direction and strength of the trend, and also signals a trend change. The indicator shows potential market reversal points. The indicator's intelligent algorithm accurately determines the trend. Uses only one parameter for settings. The indicator is built for simple and effective visual trend detection with an additional smoothing filter. The indicator does not redraw and does not lag. Take profit is 9-10 times larger than stop loss

The Extreme point indicator helps in determining the probable price reversal points on the chart. The indicator facilitates the search for points to enter the market with greater accuracy. The indicator displays certain impulses, after which there is a high probability of the price continuing its movement in the same direction. The indicator can be used in conjunction with other indicators for a more accurate detection of the position entry points. The indicator can also be used independently. F

Flag Pattern Indicator - Your Guide to Flagging Profitable Trade Setups Welcome to the world of precision trading with the "Flag Pattern Indicator." Designed for MetaTrader, this powerful tool is your go-to solution for identifying one of the most reliable and versatile chart patterns in technical analysis: the flag pattern. Whether you're a seasoned trader or just starting, this indicator simplifies the process of spotting flag patterns, giving you an edge in your trading decisions. Key Feature
FREE
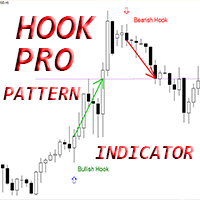
Crypto_Forex Indicator "Hook Pro pattern" for MT4, No repaint, No delay.
- Indicator "Hook Pro pattern" is very powerful indicator for Price Action trading. - Indicator detects bullish and bearish Hook patterns on chart: - Bullish Hook - Blue arrow signal on chart (see pictures). - Bearish Hook - Red arrow signal on chart (see pictures). - With PC, Mobile and Email alerts. - Indicator "Hook Pro pattern" is good to combine with Support/Resistance Levels. - Indicator has Info Display - it show

INFOPad is an information panel that creates information on the selected currency pair in the MetaTrader 4 terminal. There are 5 functions of this indicator: Shows the main and main information on the selected symbol: Ask BID, Spread, Stop Level, Swap, Tick value, Commission prices; Shows the future targets of SL target and TP Target (The number of points of the established stop loss and take profit, the dollar amount); It shows the profit received for the periods: Today, Week, Month, Year, Tot
FREE
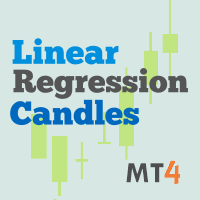
This indicator is the mql version of the Linear Regression Candles indicator. Find out more here: https://www.mql5.com/en/users/rashedsamir/seller There are many linear regression indicators out there, most of them draw lines or channels, but this one actually draws a chart.This script includes features such as linear regression for open, high, low, and close prices, signal smoothing with simple or exponential moving averages. I welcome your suggestion for improving the indicator.
To incre
FREE

The Renko_Bars_3in1 is designed for plotting 3 types of Offline Renko charts. Standard Renko Bar (the reversal bar is twice the size of the bar). Renko Range Bar (the size of all bars is the same). Renko Bars with the ability to adjust the size of the reversal bar. Attention : The demo version for review and testing can be downloaded here . Note . A chart with the M1 period is necessary to build an offline chart. When the indicator is attached to a chart, the offline chart is opened automaticall
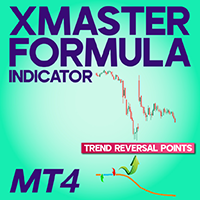
XMaster XHMaster Formula MT4 Indicator – No Repaint Strategy The XMaster / XHMaster Formula Indicator for MetaTrader 4 (MT4) is one of the most popular non-repaint tools used in Forex trading. According to sources like XS.com and TradingFinder, the indicator is designed to detect market direction, momentum strength, and potential reversal areas with high accuracy. This MT4 version blends multiple technical elements—such as EMA-based trend analysis, MACD momentum, RSI and Stochastic oscillators,
FREE

UR VolumeTrend UR VolumeTrend is the clearest volume indicator showing the ongoing trend in terms of volume. Works perfectly with other indicators just like UR TrendExhaustion to signal local tops and bottoms. Limited to just 2 parameters - the higher values, the longer trends it will show. Gradient extremes show possible exhaustions of volume to catch a potential reversal. Two lines - The Volume trend and It's average. The best advantage: Easy and adjusted to all assets. There is a special
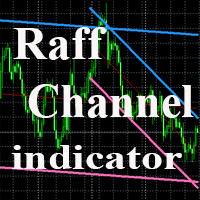
The indicator plots a trend channel using the technique by Gilbert Raff. The channel axis is a first-order regression. The upper and lower lines show the maximum distance the Close line had moved away from the axis line. Therefore, the upper and lower lines can be considered as resistance and support lines, respectively. A similar version of the indicator for the MT5 terminal
As a rule, most movements of the price occur within a channel, going beyond the support or resistance line only for a sh
FREE

Sniper Flip Zones – Smart Buy/Sell Signal System Join the channel to stay updated: https://www.mql5.com/en/channels/forexnewadvisor
I designed Sniper Flip Zones to generate ultra-precise BUY and SELL signals by identifying moments where momentum shifts sharply in trending or ranging markets. It works exceptionally well on XAUUSD M1/M5 , but can be applied to any pair or timeframe using the configurable parameters.
The core logic combines: Stochastic reversals at extreme levels (10/90) Optional
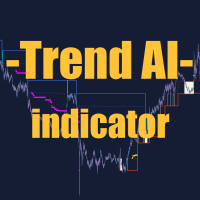
Trend AI Indicator Description:
Trend AI Indicator is a powerful market analysis tool that uses artificial intelligence to identify trends and key levels. The indicator automatically adapts to changing market conditions, providing accurate data for decision-making. Key Features: Trend Identification: The indicator uses machine learning algorithms to accurately determine the direction of the trend (uptrend, downtrend, sideways). Key Levels: Automatically builds support and resistance levels

US30 Revolt a Technical indicator that is 100% non-repaint and appears on the current candlestick works on all timeframes (recommended M15,M30,H1) The indicator is made for US30 but it can be used on other pairs as well When a blue arrow appears look for buying opportunities When a orange arrow appears look for selling opportunities Please watch the YouTube video on how to properly set up and use the indicator
FREE

This indicator calculates the volume profile and places labels that correspond to the VAH, VAL and POC levels, for each candle individually.
Indicator operation features The indicator works on the timeframes from M5 to MN, but it uses the history data of smaller periods: M1 - for periods from M5 to H1, M5 - for the H4 period, M30 - for the D1 period, H4 - for the W1 period, D1 - for the MN period. The color and location of the VAL, VAH and POC labels on the current candle are considered to be c
FREE

YOU CAN NOW DOWNLOAD FREE VERSIONS OF OUR PAID INDICATORS . IT'S OUR WAY OF GIVING BACK TO THE COMMUNITY ! >>> GO HERE TO DOWNLOAD Most of the time, market reversals / pull backs usually follow volume and price spikes thus these spikes could be the first indication of an exhaustion and possible reversal/pullback. High volume Turns is an indicator that scans the market for price and volume spikes around over-bought/over-sold market conditions. These spikes when spotted serves as the first indi
FREE
Other profitable programs https://www.mql5.com/en/users/ifyjava/seller The FNCD indicator represents an advanced technical analysis tool that combines Fisher transformation with statistical price normalization to create a sophisticated oscillator. The foundation begins with Z-score normalization, where price data is standardized by calculating how many standard deviations the current price sits from its moving average over a specified period. This normalization process transforms raw price mov
FREE
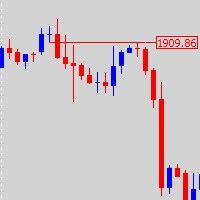
This is a combine that combines the ATR, Candle Timer, Watermark indicators and a tool for working with graphical objects, which allows you to reduce the time for marking charts. Functionality: Levels and proteins with price tags; drawing strictly horizontal levels; continuous zigzag manually; expansion / truncation of lines, wrinkles; quick change of colors and fonts and shapes; Filling/removing the filling of vessels, triangles, ellipses; dragging by 1 (first) point and auto alignment of the h
FREE
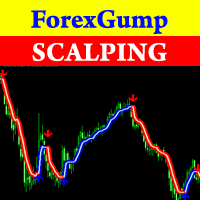
Attention! Friends, since there have been many scammers on the Internet recently selling indicators called ForexGump, we decided to warn you that only on our page is the LICENSE AUTHOR'S VERSION of the INDICATOR sold! We do not sell this indicator on other sites at a price lower than this! All indicators are sold cheaper - fakes! And even more often sold demo versions that stop working in a week! Therefore, in order not to risk your money, buy this indicator only on this site! Forex Gump Scalpin

The Average True Range ( ATR ) is a measure of market volatility over a specified number of days. You should not expect a big continuation move when the price has reached the end of the range. The market is considered to have run out of fuel. If the price has not reached the edge, it still has a range. The indicator formula allows you to calculate High-Low levels both in aggregate and individually. You can also use these levels as support/resistance and target.
Input parameters.
Start Day - f
FREE
MarketSessions Indicator The Essential Tool for Global Market Session Visualization The MarketSessions indicator is a powerful MT4 tool designed to help traders visualize major forex market sessions directly on their charts. By clearly displaying the active trading hours of Sydney, Tokyo, London, and New York markets, this indicator helps you identify optimal trading periods and understand market volatility patterns. Key Features: Clear visualization of all four major trading sessions (Sydney, T
FREE

CIS is designed for trading a basket of correlating currencies, as well as single instruments: indicators
VSA indicator which draws arrows (does not redraw). Its signals indicate the price reversal on a calm market or decrease of the rise or fall rate during strong movements. Works fine in the flats. As the indicator uses volumes in its calculations, be careful during evenings and night times, when there are very small volumes. It is recommended to be used only on multiple currencies or at lea

"TRADE SAFELY! TRADE LIKE A PROFESSIONAL!" Bonus: You get the Forex Trend Commander Indicator absolutely free!
A secret system built as an automatic indicator based on unique knowledge inspired by famous traders. The system uses the unique smart adaptable algorithm to overcome the difficulties of analysis and trading. All trade is protected by a stop loss to minimize possible drawdowns. Using the indicator with a professional money management system allows you to control capital and take advant
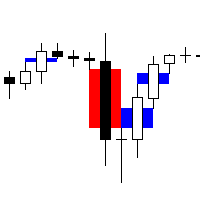
Fair Value Gap Scanner 4 is a sophisticated MetaTrader 5 indicator designed to detect fair value gaps (FVGs) in price action and display them as rectangles directly on the chart. This powerful tool empowers traders by providing visual representations of FVGs, enabling them to identify potential trading opportunities with ease and precision. With customizable parameters for color, width, and style, traders can tailor the indicator's appearance to suit their preferences and trading strategies. Key
FREE

[NEW RELEASE] Horse All in Signal – WinWiFi Robot Series ต้อนรับปีใหม่ 2026 ด้วยความมั่งคั่งและพลังที่คึกคักเหมือนม้าศึก! สัมผัสประสบการณ์การเทรดเหนือระดับกับอินดิเคเตอร์ตัวล่าสุดจาก WinWiFi Robot Series ในชื่อ "Horse All in Signal" เครื่องมือที่จะเปลี่ยนกราฟของคุณให้กลายเป็นสนามทำกำไร ด้วยระบบ AI อัจฉริยะที่สแกน Price Action ในทุกช่วงเวลา คุณสมบัติเด่น (Key Features): AI Price Action Engine: วิเคราะห์พฤติกรรมราคาแบบ Real-time แม่นยำทั้งในช่วงตลาดมีเทรนด์ (Trend) และช่วงพักตัว (Sideway)
FREE

Tired of plotting trendlines? The PZ TrendLines indicator applies a mechanical approach to the construction of trend lines for you! [ Installation Guide | Update Guide | Troubleshooting | FAQ | All Products ] It can draw up to 18 trendlines Trendlines can be optionally based on fractals Each line represents a breakout level Each trendline can be broken or rejected Configurable amount of lines Configurable colors
Author Arturo López Pérez, private investor and speculator, software engineer and
FREE

Time Session OPEN-HIGH-LOW-CLOSE This Indicator Will Draw Lines Of OHLC Levels Of Time Session Defined By User. It Will Plot Floating Lines On Current Day Chart. Time Session Can Of Current Day Or Previous Day. You Can Plot Multiple Session Lines By Giving Unique ID To Each Session. It Can Even Show Historical Levels Of Time Session Selected By User On Chart To Do Backdating Test. You Can Write Text To Describe The Lines.
FREE

The " YK Find Support And Resistance " indicator is a technical analysis tool used to identify key support and resistance levels on a price chart. Its features and functions are as follows:
1. Displays support and resistance levels using arrow lines and colored bands, with resistance in red and support in green.
2. Can be adjusted to calculate and display results from a specified timeframe using the forced_tf variable. If set to 0, it will use the current timeframe of the chart.
3. Uses the
FREE

The indicator shows signals based on the terminal RSI oscillator on the chart. It is possible to filter out repeated signals.
Here the oscillator is used to search for a reverse signal. It is recommended as an entry point in swing strategies and trading from levels.
A multi-currency dashboard is available. With it, you can easily switch between charts. In product discussions, you can suggest an algorithm in which you can embed a dashboard.
Input parameters.
Main Settings. Bars Count – the n
FREE
Highly configurable Stochastic indicator.
Features: Highly customizable alert functions (at levels, crosses, direction changes via email, push, sound, popup) Multi timeframe ability Color customization (at levels, crosses, direction changes) Linear interpolation and histogram mode options Works on strategy tester in multi timeframe mode (at weekend without ticks also) Adjustable Levels Parameters:
Stochastic Timeframe: You can set the lower/higher timeframes for Stochastic. Stochastic Bar Sh
FREE

This indicator represents a genuine momentum oscillator according to the true definition of "Momentum", and as realised by the techniques of digital filtering. ( Note : download a complete set of true momentum oscillators here ). A scholarly paper on the subject by the current developer can be found here , but in this description we shall borrow only the minimum of conceptual and mathematical framework needed. In the process, we expose some long-held myths about indicators supposedly measurin
FREE
This is a powerful, session-aware breakout indicator designed for serious traders who thrive on volatility and structure. Engineered for precision, it identifies high-probability breakout zones during the London and New York trading sessions—where the market moves with intent. Key Features: Session Range Detection
Automatically detects and highlights the key price range of London and New York sessions. Breakout Confirmation
Identifies breakout candles after the session range, with cl
FREE
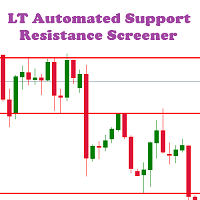
LT Automated Support Resistance Screener is a level indicator or a support resistance indicator that can be used to determine the level of support and resistance values. This indicator is free and easy to used in the Metatrader 4 platform which is built using the MQL4 programming language. Support resistance indicator is an important indicator that is often to used, but it is not available on the MT4 platform. This indicator can be used for all markets like forex, indices, gold etc and all time
FREE

The Matrix Arrow Indicator Multi Timeframe Panel MT4 is a free add on and a great asset for your Matrix Arrow Indicator MT4 . It shows the current Matrix Arrow Indicator MT4 signal for 5 user customized timeframes and for 16 modifiable symbols/instruments in total. The user has the option to enable/disable any of the 10 standard indicators, that the Matrix Arrow Indicator MT4 consists of. All of the 10 standard indicators attributes are also adjustable, as in the Matrix Arrow Indicator MT4 . The
FREE
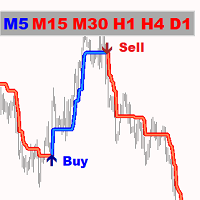
Gold Pointer - is the good trend indicator. The indicator's unique algorithm analyzes the movement of the asset's price, taking into account the factors of technical and mathematical analysis, determines the most profitable entry points and generates a signal to open BUY or SELL order. Live Signal of manual trading >>> [ Click Here ] The best indicator signals: For SELL = red trend line + red TF indicator + yellow signal arrow in the same direction. For BUY = blue trend line + blue TF indicat

Product Title Smart Ichimoku (MT4) – part of the SmartView series Short Description A Ichimoku indicator with a unique user experience on MetaTrader platform. Features advanced capabilities not previously available, such as opening settings with double-click, hiding and showing indicators without deleting them, and displaying indicator windows at full chart size. Designed to work seamlessly with the rest of the SmartView Indicators series. Overview The SmartView series offers a unique and distin
FREE
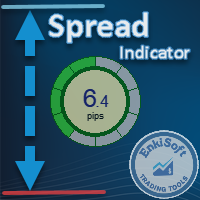
Custom Spread Indicator *Please write a review, thanks!
Also MT5 version is available
Spread Indicator show the current spread in pips with color codes. Handle 3 levels, Low, Medium, High. You can set levels and colors for each level (eg. Low: Green, Medium: Orange, High: Red), and can choose display position on the chart.
There is two spread calculation mode: -> Server spread value -> Ask - Bid value
Can set opacity, for better customization. When spread jump bigger, then display do not
FREE

We present you an indicator that not only improves the visual aspect of the chart, but also gives it a lively, dynamic character. Our indicator is a combination of one or more Moving Average (MA) indicators, which constantly change their color, creating an interesting and colorful look.
This product is a graphical solution, so it is difficult to describe what it does in text, it is easier to see by downloading it, besides the product is free. This indicator is suitable for bloggers who want to
FREE

Forex Breath System is a trend based trading system which can be used with any market. You can use this system with currencies, metals, commodities, indices, crypto and even stocks. It can also be used with any time frame. The system is universal. It shows trend and provides arrow signals with the trend. The indicator can also provide you with a special type of alerts when the signals appear in the direction of the trend which makes trend trading an easy task. The indicator is very easy to use a

The BB Reversal Arrows technical trading system has been developed to predict reverse points for making retail decisions.
The current market situation is analyzed by the indicator and structured for several criteria: the expectation of reversal moments, potential turning points, purchase and sale signals.
The indicator does not contain excess information, has a visual understandable interface, allowing traders to make reasonable decisions.
All arrows appear to close the candle, without redrawin

Super trend is one of the best trend indicators in metatrader 4 (MT4). Triple SuperTrend indicator is an indicator that consist of three super trend indicator that can be aranged. This indicator is built by mql4 language and doesn't provided by MT4 platform. Highly recommended using EMA SuperTrend Strategy Indicator if you want to get better result in here:
https://www.mql5.com/en/market/product/91664
This indicator is easy to use, power full and has many benefits, there are: Using three indic
FREE

MQLTA Support Resistance Lines is an indicator that calculates the historical levels of Support and Resistance and display them as Lines on chart. It will also Alert you if the price is in a Safe or Dangerous zone to trade and show you the distance to the next level. The indicator is ideal to be used in other Expert Advisor through the iCustom function. This indicator can be tested LIVE on AUDNZD with the following DEMO https://www.mql5.com/en/market/product/26572
How does it work? The indicato
FREE
Key Features of the Indicator: Buy & Sell Signals: The indicator generates buy and sell signals based on specific conditions. It uses the crossover of the Fast Moving Average (Fast MA) and Slow Moving Average (Slow MA) to determine market entries. The RSI (Relative Strength Index) is used to identify buy signals when RSI is above 50 and below 75. It also considers support and resistance levels for additional confirmation of signals. Trend Filter: The market trend is identified using a Trend Movi
FREE

This indicators automatically draws the Support and resistances levels for you once you've dropped it on a chart. It reduces the hustle of drawing and redrawing these levels every time you analysis prices on a chart. With it, all you have to do is dropped it on a chart, adjust the settings to your liking and let the indicator do the rest. But wait, it gets better; the indicator is absolutely free! Get the new and improved version here: https://youtu.be/rTxbPOBu3nY Parameters Time-frame -> T
FREE
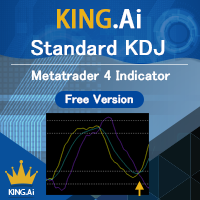
The standard KDJ indicator is presented by KING.Ai. This indicator were built base on the the theory of KDJ . KDJ is a very effective and useful strategy to trade especially in swing trading. Method to apply (please also refer to the graphic): 80/20 rule: Price from bottom to top 20 to 80. And price from top to bottom 80 to 20. Both is enter market signal. Indicator period: The indicator is made by period 9,3,3 KING.Ai Forex trader believe that such strategy must complement with other indicato
FREE

Pullback Power: Catch the Trend, Maximize Your Profit! Tired of chasing trades and getting caught in market noise? The Pullback Power indicator is your essential tool for finding high-probability entries in a trending market. It's not about guessing; it's about trading with confidence, knowing you have a system designed to confirm genuine trend continuation after a brief pullback . This smart indicator combines the reliability of EMA Crosses for established trend direction with the dynamic conf
FREE
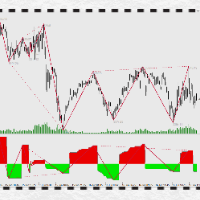
Introduction to PowerTrapezoid:
The application of market Power deviation system is not a secret, such as volume price deviation, MACD deviation, Chanlun deviation and so on. However, how to correctly understand and calculate, and accurately judge the increase or decrease of POWER is a threshold in application, which is difficult to cross with the conventional system. How to avoid reciting? How to implement multi level backflow parallel computing? How to intuitively show the range of backtrack
FREE

Backtest with good trend detection results from January 2023
EURUSD Time frame: m15, m30, H1
AUDUSD Time frame: m15, m30 NASDAQ Time frame: m15 S&P 500 Time frame: m15, m30 XAUUSD Time frame: m30 BTCUSD Time frame: H4
These are just some of the assets tested (Please note that past results are no guarantee of future results). Note that this is not a complete strategy, you can use this indicator as an entry trigger after your analysis by setting stop loss and take profit values that you deem
FREE

The indicator display the maximum horizontal volume on the selected timeframe. Based on the UPD1 Volume Box indicator . The lines can be connected or separated. In the settings, you can enable smart touch alert. Such an indicator will be useful for those who trade according to the market profile and the concept of smart money.
Input parameters.
Main Settings. Bars Count - indicate the number of bars on which the TF POC will be drawn. Data Source - the time frame from which the ticks will be u
FREE
MTF Fair Value Gaps Alerts indicator is based on Fair Value Gaps (FVG), Volume imbalance (VI) and Gaps. This indicator will create 2 arrows pointing to the left showing the area of the FVG, VI and Gaps and will never repaint after the candle has been closed .
Inputs: TF (Timeframe of the Alert For Current timeframe use CURRENT)
barshilft : the barshift needs to be the same timeframe as the above TF. barshift format (CURRENT, M1, M5, M15, M30, H1, H4, D1, W1, MN) Send Email: Audible Alert Push N
FREE

Introduction This indicator detects volume spread patterns for buy and sell opportunity. The patterns include demand and supply patterns. You might use each pattern for trading. However, these patterns are best used to detect the demand zone (=accumulation area) and supply zone (=distribution area). Demand pattern indicates generally potential buying opportunity. Supply pattern indicates generally potential selling opportunity. These are the underlying patterns rather than direct price action. T

Unlock Smarter Trading with Trend-Sensing Pro Are you tired of confusing charts and late signals? Trend-Sensing Pro is a powerful yet simple indicator designed to help you see market trends with crystal clarity. It combines the smoothness of an EMA (Exponential Moving Average) with a unique candle visualization, giving you a clean, noise-free view of the market's direction. Why You'll Love Trend-Sensing Pro See the True Trend : Trend-Sensing Pro cuts through market noise, making it easy to ident
FREE

The first currency based indicator to draw a distinction between map and strength. The map shows the currencies in terms of oversold/overbought levels and gives the direction of travel. The currency strength calculates and shows the strength of that move. Alerts are included for changes in currency direction on the map (confirmed over two bars) and also when the strength reached the appropriate level. The currency map is useful for finding currency pairs to trade and in which direction. Look fo

LIMITED TIME SALE - 30% OFF!
WAS $50 - NOW JUST $35! The ADR Alert Dashboard shows you at a glance where price is currently trading in relation to it's normal average daily range. You will get instant alerts via pop-up, email or push when price exceeds it's average range and levels above it of your choosing so you can jump into pullbacks and reversals quickly. The dash is designed to be placed on a blank chart and just sit in the background and alert you when levels are hit so you do no
Streamline your trading analysis with the Day and Week Separator MT4, an intuitive tool designed to plot customizable daily and weekly separator lines, perfect for traders navigating broker time zone differences. Widely appreciated in trading communities like Forex Factory and Reddit’s r/Forex for its simplicity and effectiveness, this indicator addresses the common challenge of aligning chart timeframes with local or market-specific times, as highlighted in discussions on platforms like Invest
FREE
OneShotFX is a scalping arrow signals type indicator, an all in one arrow system with money management and filtered signals. How to trade Buy : when up arrow prints on the chart open buy trade, set your tp and sl on colored tp and sl lines above and below the arrow signal candle. Sell: when up arrow prints on the chart open sell trade, set your tp and sl on colored tp and sl lines above and below the arrow signal candle. Why is it a good choice Plenty of signals : no need to wait for long per
FREE

FullScalping is a non-repainting, non-backpainting indicator, specially designed to generate CONSTANT scalping entries in any market. Perfect for aggressive traders looking for nonstop action!
Join the channel to stay updated with exclusive information and updates: https://www.mql5.com/en/channels/forexnewadvisor
You’ll notice it gives signals on almost every candle , either confirming the trend or signaling key retracements. It’s like having a radar constantly guiding you.
How does it work?

CyberZingFx Trend Reversal Indicator - your go-to solution for accurate and reliable trend reversal signals. With its unique trading strategy, the indicator offers you Buy and Sell Arrow signals that do not repaint, making it a reliable tool for catching Swing Highs and Swing Lows.
SCROLL DOWN TO VIEW SCREENSHOTS AND WATCH VIDEO ________________________________________________________________ Trading using CyberZingFx Trend Reversal is Simple Using the CyberZingFx Trend Reversal Indicator is ea
FREE

MP Candle Countdown indicator with a progress bar is a tool used in technical analysis that displays the time remaining until the current candlestick on a chart closes, along with a progress bar that shows visually the amount of time that has elapsed since the candlestick opened. This indicator can be helpful for traders who use candlestick charting to make trading decisions, as it provides both a visual representation of the time left until a candlestick closes and an indication of how much ti
FREE

Are you ready to become the Sherlock Holmes of forex trading? ️️ Introducing the ultimate trading toolkit: Lisek Levels and Channels Indicator !!! Forget juggling multiple indicators like a circus act. We've packed everything you need into one spectacular show: Price Levels? Check! Price Channels? You bet! Price VWAP? Oh yeah! Volume On Balance? It's all there! And the cherry on top? Alarms and Push Notifications that'll wake you up faster than a double espresso! ️ Your cha
FREE

RSI Divergence Full +10 other divergence indicators
Contact me after payment to send you the User-Manual PDF File. Download the MT5 version here. Also you can download the >>> Hybrid Trading EA <<< that is designed and implemented based on RSI Divergence Indicator. RSI is a pretty useful indicator in itself but it's even more effective when you trade divergence patterns with that. Because the divergence signal of the RSI indicator is one of the most powerful signals among the indicators. Di
** All Symbols x All Time frames scan just by pressing scanner button ** After 18 years of experience in the markets and programming, Winner indicator is ready. I would like to share with you! *** Contact me to send you " Trend Finder indicator " free, instruction and add you in "M1 Signal Scanner group" for sharing or seeing experiences with other users. Introduction: M1 Signal Scanner is the indicator designed scalping M1 time frame to detect Small trend switching in the direction

Scalpetronix Indicator — the signal core of the Scalpetronix robot. This indicator implements the algorithms and signals on which the Scalpetronix Expert Advisor operates. All entries of the robot are generated based on these calculations: a combination of exponential moving averages, trend filtering via ADX, volatility normalization through ATR, and bar structure analysis. Advantages of the indicator works on a multi-level EMA system (fast and slow) with a dynamic threshold; eliminates weak si
Introducing the Swing Point Model Indicator – A Professional Trading Tool The Swing Point Model Indicator is an innovative tool designed for traders who want to capture market structure and identify potential trading opportunities. With a logical and transparent approach, the Swing Point Model helps you gain deeper market insights and make precise trading decisions. This is multiple Timeframe indicator so you can choose Higher timeframe for detect Swing point model What Is the Swing Point Mo

Contact me after payment to send you the User-Manual PDF File. Divergence detection indicator with a special algorithm. Using divergences is very common in trading strategies. But finding opportunities for trading with the eyes is very difficult and sometimes we lose those opportunities. The indicator finds all the regular and hidden divergences. (RD & HD) It uses an advanced method to specify divergence. This indicator is very functional and can greatly improve the outcome of your trading. Thi
Scalp Arrow Exit Signals (MT4 Indicator) All-in-One MT4 Signals: Precise Entries, Exits & Re-entries for Any Trading Style! The "Scalp Arrow Exit Signals" is a professional-grade trading indicator for MetaTrader 4 (MT4) , engineered to be your comprehensive guide for reliable entry, exit, re-entry, retracement entry, and pull-back entry signals . This powerful forex tool operates as a complete "black-box" system, providing clear, actionable buy and sell signals with robust alerts across any inst

Enhance your trading precision with the WH Trading Sessions MT4 indicator for MetaTrader 4! This powerful tool helps you visualize and manage key market sessions effortlessly. Based on : WH SMC Indicator MT4
MT5 Version : WH Trading Sessions MT5 Key Features: Interactive GUI Panel – Easily select and toggle between Asia, London, and New York trading sessions.
Customizable Alerts & Settings – Tailor the indicator to your strategy with an intuitive Options Tab .
Fast & Respons
FREE

FX Correlation Matrix is a powerful multi-timeframe dashboard that helps traders analyze real-time currency correlations of up to 28 symbols at a glance. With customizable settings, sleek design, and manual symbol selection option, it enhances trade accuracy, reduces risk, and identifies profitable correlation-based opportunities. Setup & Guide: Download MT5 Version here. Exclusively for you: It's your chance to stay ahead of the market. Follow our MQL5 channel for daily market insights, char

** All Symbols x All Timeframes scan just by pressing scanner button ** *** Contact me to send you instruction and add you in "Wolfe Wave Scanner group" for sharing or seeing experiences with other users. Introduction: A Wolfe Wave is created with five-wave patterns in price. It shows supply and demand and a fight towards a balance price. T hese waves of price actions can help traders identify the boundaries of the trend . Also It helps forecast how the price will move in the near future
Scalping Explorer is a complete trading system. Our traders have tested and optimized its work for maximum effect. Trading with Scalping Explorer is easy. Open in Metatrader4 windows with currency pairs: EURUSD, GBPJPY, GBPUSD, AUDUSD, USDCHF. We include D1 timeframe on all currency pairs. Add the Scalping Explorer indicator to each window with a currency pair. In the indicator settings, we find the "Signal" parameter and set it to TRUE. Now, as soon as a signal appears on any of the currency p

The indicator of a Professional Trader is an arrow indicator for predicting the direction of price movement. I have been working on this indicator since 2014.
You can use this indicator as your main indicator, use its entry signals, and use it as your only indicator to find entry points.
About the product: Recommended TF [H4-D1-W1] . The indicator predicts the direction of the next candle. Fits a variety of tools; Flexibility in settings for different instruments and intervals through the MO
FREE
The MetaTrader Market offers a convenient and secure venue to buy applications for the MetaTrader platform. Download free demo versions of Expert Advisors and indicators right from your terminal for testing in the Strategy Tester.
Test applications in different modes to monitor the performance and make a payment for the product you want using the MQL5.community Payment System.
You are missing trading opportunities:
- Free trading apps
- Over 8,000 signals for copying
- Economic news for exploring financial markets
Registration
Log in
If you do not have an account, please register
Allow the use of cookies to log in to the MQL5.com website.
Please enable the necessary setting in your browser, otherwise you will not be able to log in.