适用于MetaTrader 4的技术指标 - 12

The Renko_Bars_3in1 is designed for plotting 3 types of Offline Renko charts. Standard Renko Bar (the reversal bar is twice the size of the bar). Renko Range Bar (the size of all bars is the same). Renko Bars with the ability to adjust the size of the reversal bar. Attention : The demo version for review and testing can be downloaded here . Note . A chart with the M1 period is necessary to build an offline chart. When the indicator is attached to a chart, the offline chart is opened automaticall
Time your Entry and Exits with Average True Range (ATR) Trailing Stops ATR Trailing Stops are primarily used to protect capital and lock in profits on individual trades but they can also be used, in conjunction with a trend filter, to signal entries. The indicator will help make your calculation of stop loss easier as it will be visually aiding you in choosing where to put your stoploss level on the chart by calculating the current value of ATR indicator. For those who are unfamiliar with ATR, i
FREE

UR 成交量趨勢
UR VolumeTrend 是顯示交易量持續趨勢的最清晰的交易量指標。 與 UR TrendExhaustion 等其他指標完美配合,以發出局部頂部和底部信號。
僅限於 2 個參數 - 值越高,顯示的趨勢越長。 梯度極端顯示成交量可能耗盡以捕捉潛在的逆轉。 兩條線 - 成交量趨勢和平均值。 最大優勢:簡單且可適應所有資產。 有一個特殊的電報聊天,您可以在其中了解最新的工具更新,如果您覺得缺少什麼,也可以發送請求!
為什麼選擇 UR VolumeTrend?
所有人都會同意,成交量是把握趨勢的關鍵。 這個震盪指標是我所有交易量工具的總和,壓縮成一個易於使用的指標。 它以易於查看的方式顯示正/負音量。 後面的界面顯示音量與過去相比是否可能會耗盡 - 或者它是否會推到新的水平。
如何使用 UR VolumeTrend?
請參閱下面的描述以更熟悉它:
設置 Volume Period:值越高,它會嘗試捕捉的趨勢越大 交易量趨勢:此附加行顯示僅基於交易量的潛在反轉條目 展示
漸變界面:顯示基於過去的極值水平。 成交量主線:顯示成交量是看漲*高於 0*

Sniper Flip Zones – 精准的买卖信号系统
我设计了 Sniper Flip Zones,以在趋势或震荡市场中识别动量急剧转变的时刻,从而生成极其精准的买入和卖出信号。该系统在 XAUUSD 的 M1/M5 时间框架上表现出色,但通过可配置的参数,也可应用于任何货币对和时间框架。
加入频道以获取最新信息: https://www.mql5.com/en/channels/forexnewadvisor
核心逻辑包括:
– 在极端水平(10/90)处的随机指标反转 – 可选的 %K 和 %D 交叉 – 使用短期和长期简单移动平均线的动态趋势检测 – 避免连续同方向信号的交替逻辑
信号生成方式:
– 超买/超卖退出: 指标检测快速随机指标何时退出极端区域(高于90或低于10),通常标志着短期反转。 – 交叉过滤器: 可启用 %K/%D 交叉以获得更强的确认(可选)。 – 趋势对齐: 系统使用双移动平均线过滤器(可配置)检测看涨或看跌趋势偏差,有助于避免逆势信号。 – 交替逻辑: 为减少过度交易,一旦发出买入或卖出信号,下一个信号必须是相反方向。 – 所有计算均基
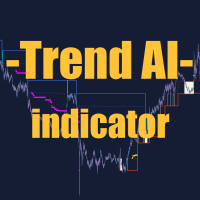
Trend AI Indicator 描述:
Trend AI Indicator 是一款强大的市场分析工具,利用人工智能识别趋势和关键水平。该指标自动适应不断变化的市场条件,提供准确的数据以支持决策。 主要功能: 趋势识别: 该指标使用机器学习算法准确判断趋势方向(上升、下降、横盘)。 关键水平: 基于历史数据自动构建支撑和阻力水平。 安全交易区: 定义最小可能止损的区域,降低风险。 适应性: 该指标适应市场波动,减少错误数据。 自定义设置: 可根据不同交易策略和时间框架进行调整。 优势: 由于使用AI,具有高精度。 适用于所有市场类型(外汇、股票、加密货币)。 安全交易区通过最小止损降低风险。 易于使用,适合初学者和专业人士。 设置: Indicator Color Theme: 设置与截图中显示的颜色主题。 Sensitivity Factor: 调整指标的敏感度。 Safety Factor: 调整安全止损功能的触发条件。 Trading Area Coefficient: 安全交易区的大小。 注意:
为确保指标正常运行,至少需要1500
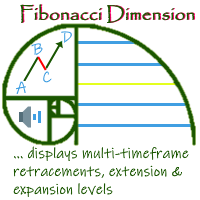
'Fibonacci Dimension' indicator allows display of preset or user-defined multi-timeframe Fibonacci levels. It automatically takes the previous high and low for two user-defined timeframes and calculates their Fibonacci retracement levels. It also considers the retraced level to draw the expansions on every change of price. A complete visual dimension in multiple timeframes allows deriving profitable strategies for execution. Enhanced functionality to view and customize the default Fibonacci Rang
FREE

Super trend is one of the best trend indicators in metatrader 4 (MT4). Triple SuperTrend indicator is an indicator that consist of three super trend indicator that can be aranged. This indicator is built by mql4 language and doesn't provided by MT4 platform. Highly recommended using EMA SuperTrend Strategy Indicator if you want to get better result in here:
https://www.mql5.com/en/market/product/91664
This indicator is easy to use, power full and has many benefits, there are: Using three indic
FREE

支点交易: 1.pp 支点 2. r1 r2 r3 , s1 s2 s3 交易实用必备工具指标 波浪自动计算指标,通道趋势交易 完美的趋势-波浪自动计算通道计算 , MT4版本 完美的趋势-波浪自动计算通道计算 , MT5版本 本地跟单复制交易 Easy And Fast Copy , MT4版本 Easy And Fast Copy , MT5版本 本地跟单复制交易 模拟试用 Easy And Fast Copy , MT4 模拟账号运行 Easy And Fast Copy , MT5 模拟账号运行 强烈推荐趋势指标, 波浪的标准自动计算 和 波浪的标准自动计算MT5版本
合作QQ:556024" 合作wechat:556024" 合作email:556024@qq.com" 专业EA指标定制编写.
支点( pivot points) 作为一种交易策略已经很长时间了,最初是场内交易员使用这种方法。使用这种方法通过几个简单的计算就可以了解市场在一天中的去向。 支点法中的支点是一天中市场方向的转向点,通过简单地计算前日的高点、低点和收盘价,可以得到一系列点位。这
FREE

The Pipsometer Pro Indicator is an essential, minimalist tool designed for the disciplined trader who requires immediate, at-a-glance financial feedback. It functions as a dedicated, real-time display that continuously calculates and shows your current floating profit or loss, measured exclusively in **pips**, for every open trade on the active chart. This focus on pips rather than monetary value allows traders to assess market performance and price movement directly, stripping away the emotion
FREE

FREE

EZ Risk Reward Ratio is a simple to use MT4 indicator that allows the user to automatically change the Risk Reward Ratio of an open trade simply by dragging the Take Profit or Stop Loss lines to desired positions on any chart. Risk to reward ratio is displayed in whichever corner you choose and can be changed by dragging TP and SL lines.
First, place the EZ Risk Reward Ratio indicator on the MT4 chart. Second, open a trade on the MT4 chart. EZ Risk Reward Ratio works on any currency pair and o
FREE
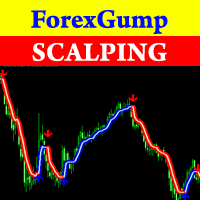
Attention! Friends, since there have been many scammers on the Internet recently selling indicators called ForexGump, we decided to warn you that only on our page is the LICENSE AUTHOR'S VERSION of the INDICATOR sold! We do not sell this indicator on other sites at a price lower than this! All indicators are sold cheaper - fakes! And even more often sold demo versions that stop working in a week! Therefore, in order not to risk your money, buy this indicator only on this site! Forex Gump Scalpin
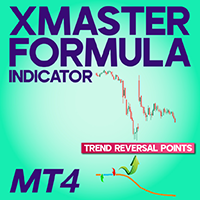
XMaster XHMaster Formula MT4 Indicator – No Repaint Strategy The XMaster / XHMaster Formula Indicator for MetaTrader 4 (MT4) is one of the most popular non-repaint tools used in Forex trading. According to sources like XS.com and TradingFinder, the indicator is designed to detect market direction, momentum strength, and potential reversal areas with high accuracy. This MT4 version blends multiple technical elements—such as EMA-based trend analysis, MACD momentum, RSI and Stochastic oscillators,
FREE
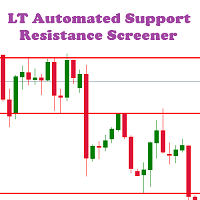
LT Automated Support Resistance Screener is a level indicator or a support resistance indicator that can be used to determine the level of support and resistance values. This indicator is free and easy to used in the Metatrader 4 platform which is built using the MQL4 programming language. Support resistance indicator is an important indicator that is often to used, but it is not available on the MT4 platform. This indicator can be used for all markets like forex, indices, gold etc and all time
FREE

CIS is designed for trading a basket of correlating currencies, as well as single instruments: indicators
VSA indicator which draws arrows (does not redraw). Its signals indicate the price reversal on a calm market or decrease of the rise or fall rate during strong movements. Works fine in the flats. As the indicator uses volumes in its calculations, be careful during evenings and night times, when there are very small volumes. It is recommended to be used only on multiple currencies or at lea

QualifiedEngulfing - 是 ProEngulfing 指标的免费版本 ProEngulfing - 是 Advance Engulf 指标的付费版本, 点击此处下载。 ProEngulfing 的免费版与付费版有什么区别?免费版每天只能发出一个信号。 介绍 QualifiedEngulfing - 你的专业 Engulf 模式指标,适用于 MT4 通过 QualifiedEngulfing 发挥精准性的力量,这是一款设计用于辨识和突显外汇市场中合格 Engulf 模式的前沿指标。专为 MetaTrader 4 开发,QualifiedEngulfing 提供了一种细致入微的 Engulf 模式识别方法,确保您只收到最可靠的交易信号以做出决策。 QualifiedEngulfing 的工作原理: QualifiedEngulfing 采用先进的算法分析 Engulf 模式,超越了简单的模式识别,确保模式的合格性。以下是其工作原理: 资格标准:该指标评估实体百分比相对于整个蜡烛大小的百分比,并考虑影子百分比相对于蜡烛大小的比例。这种仔细的评估确保只有高概率的 Engul
FREE

This indicator calculates the volume profile and places labels that correspond to the VAH, VAL and POC levels, for each candle individually.
Indicator operation features The indicator works on the timeframes from M5 to MN, but it uses the history data of smaller periods: M1 - for periods from M5 to H1, M5 - for the H4 period, M30 - for the D1 period, H4 - for the W1 period, D1 - for the MN period. The color and location of the VAL, VAH and POC labels on the current candle are considered to be c
FREE
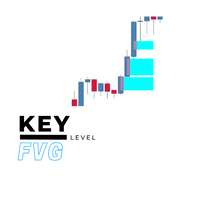
Key Level FVG Tired of manually scanning your charts for Fair Value Gaps (FVGs)? The Key Level FVG is a powerful and easy-to-use tool designed to automatically detect and display these critical price imbalances for you. Based on popular smart money concepts, this indicator highlights high-probability areas where the price is likely to return, providing you with clear and actionable trading zones. Whether you're a seasoned price action trader or just starting with FVG analysis, this indicator wi
FREE

The indicator displays volume profiles based on the nesting principle. Profiles periods are pre-set so that each subsequent profile has a length twice as long as the length of the previous profile. In addition to profiles, the indicator displays volume clusters sorted by color, depending on the volume they contain.
Indicator operation features The indicator works on typical timeframes from M5 to MN, but for calculations uses historical data from smaller timeframes: M1 - for timeframes from M5
FREE

这是一款独特的MACD指标,它比传统MACD要准确,而且好用。它适合任何图表周期,并且适合任何市场品种。 红色的柱子是(Buy)的波段信号、蓝色的柱子是(Sell)的波段信号。 黄色线和绿色线是趋势线,这两条线永远不会交叉。 Buy:蓝色柱子中,再看绿色线向上穿越中间0轴。 Sell:红色柱子中,再看黄色线向下穿越中间0轴。 这款MACD的背离形态信号的准确率在99%: 背离形态Buy:价格一个波段比一个波段低,而指标的柱子却越缩越高,这种情况下可以立即做Buy单。 背离形态Sell:价格一个波段比一个波段高,而指标的柱子却越缩越低,这种情况下可以立即做Sell单。 注意:指标里面的五角星会随着价格波动而变化。

MQLTA Support Resistance Lines is an indicator that calculates the historical levels of Support and Resistance and display them as Lines on chart. It will also Alert you if the price is in a Safe or Dangerous zone to trade and show you the distance to the next level. The indicator is ideal to be used in other Expert Advisor through the iCustom function. This indicator can be tested LIVE on AUDNZD with the following DEMO https://www.mql5.com/en/market/product/26572
How does it work? The indicato
FREE
This automated VOLUME SCALPING INDICATOR can be utilized to manage trades and identify potential areas of support and resistance for both buying and selling. It is designed to identify zones for Sell/Buy trades based on the volume analysis and can be effectively used in conjunction with other indicators, such as order block indicators, and more. Currently designed for MT4, it will later be adapted to function on MT5. We also offer the opportunity to customize the robot according to your trading
FREE
This indicator is the mql version of the Linear Regression Candles indicator. Find out more here: https://www.mql5.com/en/users/rashedsamir/seller There are many linear regression indicators out there, most of them draw lines or channels, but this one actually draws a chart.This script includes features such as linear regression for open, high, low, and close prices, signal smoothing with simple or exponential moving averages. I welcome your suggestion for improving the indicator.
To incre
FREE
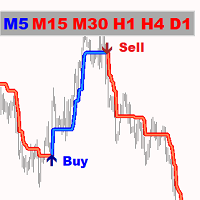
Gold Pointer 是最好的趋势指标。该指标的独特算法分析资产价格走势,考虑技术和数学分析因素,确定最有利可图的入市点,并发出买入或卖出指令信号。
最佳指标信号:
- 卖出 = 红色趋势线 + 红色 TF 指标 + 同方向黄色信号箭头。 - 买入 = 蓝色趋势线 + 蓝色 TF 指标 + 同方向水蓝色信号箭头。
该指标的优点
1. 该指标发出的信号准确度高。 2. 该指标的确认信号不会消失,也不会重新绘制--在确认信号(箭头)后会发出声音警报(警报与信息)。 3. 您可以在任何经纪商的 MetaTrader 4 交易平台上进行交易。 4. 您可以交易任何资产(货币、金属、加密货币、股票、指数等)。 5. 您可以在任何时间框架内进行交易(M5-M15 缩放交易/M30-N1 中期交易/H4-D1 长期交易)。 6. 可在指标设置中更改个别参数(颜色、大小等),以便每位交易者都能轻松调整指标,满足自己的需求。 7. 该指标既可作为交易系统的基本补充,也可作为独立的交易系统使用。 8. 在图表上,无论指标设置在哪个时间框架上,它都会显示六个时间框架(M5 M15 M30

"PRECISION TRADING FROM THE SAFE SIDE OF THE MARKET !" " A new trading system. An amazing trading indicator. " Bonus: You get the Forex Trend Commander Indicator absolutely free!
A secret system built as an automatic indicator based on unique knowledge inspired by famous traders. The system uses the unique smart adaptable algorithm to overcome the difficulties of analysis and trading. All trade is protected by a stop loss to minimize possible drawdowns. Using the indicator with a professional m

Forex Breath System 它是一个基于趋势的交易系统,可用于任何市场。您可以将此系统用于货币、金属、商品、指数、加密货币甚至股票。它也可以在任何时间范围内使用。该系统是通用的。它显示趋势并提供趋势箭头信号。当信号出现在趋势方向时,该指标还可以为您提供特殊类型的警报,从而使趋势交易成为一项简单的任务。 该指标非常易于使用,因为它根本不需要处理任何难以理解的设置。 您只需将其附加到图表中即可开始交易。无论您喜欢哪种交易风格,系统都会帮助您了解市场的方向以及趋势方向上可能的入场点。 该系统将对所有交易者有所帮助,无论他们的交易经验水平如何。 该指示器提供所有类型的警报,包括推送通知。 购买后请联系我以获得交易说明和丰厚奖金! 祝您交易愉快、盈利!

泥瓦匠是一个工具,将使你成为一个专业的分析师! 使用倾斜通道确定波浪运动的方法定性地传达了任何工具运动的原理图,不仅显示了市场可能的逆转,而且还显示了进一步运动的目标!破坏了市场还活着的神话,清楚地显示了从一个范围到另一个范围的运动原理图! 一个专业的工具,适合中期与当前趋势的定义! 泥瓦匠是一个工具,将使你成为一个专业的分析师! 使用倾斜通道确定波浪运动的方法定性地传达了任何工具运动的原理图,不仅显示了市场可能的逆转,而且还显示了进一步运动的目标!破坏了市场还活着的神话,清楚地显示了从一个范围到另一个范围的运动原理图! 一个专业的工具,适合中期与当前趋势的定义!
泥瓦匠是一个工具,将使你成为一个专业的分析师! 使用倾斜通道确定波浪运动的方法定性地传达了任何工具运动的原理图,不仅显示了市场可能的逆转,而且还显示了进一步运动的目标!破坏了市场还活着的神话,清楚地显示了从一个范围到另一个范围的运动原理图!
FREE

This is the free version of the Supply&Demand + Trendline + Trend tool. This version works only with EURCHF! You find the full version here: https://www.mql5.com/en/market/product/67274
PAAIOS stands for Price Action All In One Solution. And that is the purpose of the Indicator. It should give you a tool to improve your trading decisively because you get the crucial information at a glance. The indicator simplifies the search for strong signals. It shows trend lines, demand and su
FREE

交易实用必备工具指标 波浪自动计算指标,通道趋势交易 完美的趋势-波浪自动计算通道计算 , MT4版本 完美的趋势-波浪自动计算通道计算 , MT5版本 本地跟单复制交易 Easy And Fast Copy , MT4版本 Easy And Fast Copy , MT5版本 本地跟单复制交易 模拟试用 Easy And Fast Copy , MT4 模拟账号运行 Easy And Fast Copy , MT5 模拟账号运行 高级布林带: 1.布林中轨会随着方向变色 " 2.布林外轨扩张和收缩都会在外轨进行变色标识" 3.布林中轨计算方式可以选择任意均线,例如EMA" 4.同样可以选择任意价格应用模式进行计算" 强烈推荐趋势指标, 波浪的标准自动计算 和 波浪的标准自动计算MT5版本 "合作QQ:556024 " "合作wechat:556024" "合作email:556024@qq.com"
布林线(Bollinger Band) 是根据统计学中的标准差原理设计出来的一种非常实用的技术指标。它由 三条 轨道线组成,其中上下两条线分别可以看成
FREE

as the name suggest Trend Maker Master is a trend scalping indicator that give long and short trading opportunity based on price action and ma style trend filter, the indicator Trend Period and Trend Extra Filter will change arrows signals quality and frequency, this leave a space for trader to come out with good combos for each pair. How to trade : Buy : when white buy arrow prints, set sl below recent swing low, and set tp to 1-1 Risk to reward ratio. Sell : when white Sell arrow prints, set
FREE

市场交易时段指标 全球市场交易时段可视化的必备工具 市场交易时段指标是一款强大的MT4工具,旨在帮助交易者在图表上直观显示主要外汇市场交易时段。通过清晰展示悉尼、东京、伦敦和纽约市场的活跃交易时间,这一指标帮助您识别最佳交易时段并了解市场波动模式。 主要特点: 清晰显示四个主要交易时段(悉尼、东京、伦敦、纽约) 用彩色垂直线标记时段的开始和结束时间 每个市场时段可自定义颜色 可调整的线条样式和宽度,提高可视性 时段标签位于图表底部,便于快速参考 自动或手动GMT时差计算 完全可自定义的时段时间 优势: 轻松识别时段重叠,通常在这些时段市场波动性增加 根据特定市场时间规划交易 了解哪些金融中心正在驱动当前价格走势 基于历史时段表现优化交易策略 适合初学者和经验丰富的交易者使用 该指标适用于任何时间框架和货币对,是每位希望将交易与全球市场时间保持一致的外汇交易者的必备工具。
FREE

准备好成为外汇交易的夏洛克·福尔摩斯了吗?️️ 介绍终极交易工具: Lisek Levels and Channels 指标!!! 忘掉像马戏团表演一样玩多个指标的杂耍吧。我们把你需要的一切都打包成一场精彩的表演: 价格水平?搞定! 价格通道?你说对了! 价格VWAP?没错! 平衡交易量?都在这里! 还有最棒的是什么?警报和推送通知,它们会比双倍浓缩咖啡更快地唤醒你!️ 你的图表即将成为交易机会的藏宝图: 看看当前价格在哪里,还有所有酷炫的水平线、通道和VWAP。 评估平衡交易量 - 它在跳熊市之舞还是牛市探戈?看看谁占上风:买家还是卖家。 上下指向的箭头像外汇狂欢派对?那显示的是买家或卖家不断增长的交易量。 像井字游戏一样交叉你图表的线条?那些是你的水平线和通道,朋友。 但是等等,还有更多! 认识 Glimpz ,你进入大玩家游戏的VIP通行证。为什么要与鲸鱼对抗,当你可以和它们一起游泳?来自 glimpz.net 的 Glimpz 让你窥探市场大亨的策略。这就像拥有一个交易水晶球,不过不用穿占卜师的服装。 交易风格?我们的花样比高级冰淇淋店还多: 在
FREE

Smoothed Supertrend指标 - 基于波动率的趋势指标与平滑功能 Smoothed Supertrend指标是为 MetaTrader 4 设计的经典Supertrend指标的增强版本。通过集成额外的平滑功能,减少市场噪音并提高趋势信号质量。 技术描述: 该指标基于平均真实范围(ATR)来测量市场波动率,并将其与价格数据的移动平均平滑相结合。生成的线显示当前趋势方向,并动态适应波动率变化。 计算方法: 计算价格的移动平均(MA) 计算N个周期的平均真实范围(ATR) 计算上下轨: 上轨 = MA + (ATR × 乘数) 下轨 = MA - (ATR × 乘数) 基于收盘价相对于轨道的位置确定趋势 阶梯逻辑:线仅在趋势反转时变化 输入参数: ATR_Period(默认:10) - ATR计算的周期数 ATR_Multiplier(默认:3.0) - 轨道宽度乘数 Smoothing_Period(默认:5) - 价格平滑的周期数 MA_Method(默认:SMA) - 移动平均方法(SMA、EMA、SMMA、LWMA) Bullish_Color(默认:蓝色) - 上升趋
FREE

Flag Pattern Indicator - Your Guide to Flagging Profitable Trade Setups Welcome to the world of precision trading with the "Flag Pattern Indicator." Designed for MetaTrader, this powerful tool is your go-to solution for identifying one of the most reliable and versatile chart patterns in technical analysis: the flag pattern. Whether you're a seasoned trader or just starting, this indicator simplifies the process of spotting flag patterns, giving you an edge in your trading decisions. Key Feature
FREE

The indicator has combined 5 popular strategies. Draws an arrow after confirming a signal for the selected strategy. There are signal alerts. Doesn't redraw its values. I recommend watching my advisor - Night Zen EA
5 strategies. The main line crosses the signal line. The main line crosses the signal line in the oversold (for buy) / overbought (for sell) zones. The main line enters the oversold (for sell) / overbought (for buy) zones . The main line comes out of the oversold (for buy ) / over
FREE
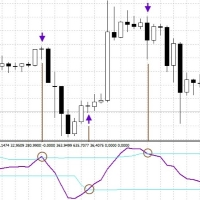
Cyclic Smoothed Relative Strength Indicator
The cyclic smoothed RSI indicator is an enhancement of the classic RSI, adding
additional smoothing according to the market vibration,
adaptive upper and lower bands according to the cyclic memory and
using the current dominant cycle length as input for the indicator. The cRSI is used like a standard indicator. The chart highlights trading signals where the signal line crosses above or below the adaptive lower/upper bands. It is much more responsive
FREE

Introduction This indicator detects volume spread patterns for buy and sell opportunity. The patterns include demand and supply patterns. You might use each pattern for trading. However, these patterns are best used to detect the demand zone (=accumulation area) and supply zone (=distribution area). Demand pattern indicates generally potential buying opportunity. Supply pattern indicates generally potential selling opportunity. These are the underlying patterns rather than direct price action. T

This indicator displays buy or sell signals according to Bill Williams' definition of the Trading Zone. [ Installation Guide | Update Guide | Troubleshooting | FAQ | All Products ] Easy to use and understand Avoid trading flat markets Deterministic indicator with clear rules The indicator is non-repainting It implements alerts of all kinds It has straightforward trading implications. A blue arrow is a buy signal A red arrow is a sell signal According to Bill Williams trading in the zone helps to
FREE

The indicator of a Professional Trader is an arrow indicator for predicting the direction of price movement. I have been working on this indicator since 2014.
You can use this indicator as your main indicator, use its entry signals, and use it as your only indicator to find entry points.
About the product: Recommended TF [H4-D1-W1] . The indicator predicts the direction of the next candle. Fits a variety of tools; Flexibility in settings for different instruments and intervals through the MO
FREE
Double top and bottom indicator is a pattern scanning indicator which scans the tops and bottoms using zig zag pattern. When it find price bouncing back from the same point twice after a long trend then it generate arrow signals whenever the last resistance points is broken for double bottom and last support price broken for double top. Unlike other top bottom scanner it does not give only 1 signal. it alerts user when ever the last support /resistance is broker from double top/bottom pattern un
FREE

----- Chinese / 中文说明 ----- KT 快速风控计算器 (KT Quick Risk Calculator) 是一款专为 MetaTrader 4 打造的专业级辅助工具。 它完美解决了 MT4 原生十字光标无法直接计算金额的痛点,旨在通过流畅的交互体验,大幅提升您的复盘与交易计划效率。 【核心功能】 本工具允许您以“所见即所得”的方式,在图表上交互式测量任意两点间的距离,并基于您设定的手数,即时显示该段距离在当前账户币种下的潜在盈亏价值(或风险金额)。 【主要特点】 智能交互 (Smart Interaction) :告别繁琐的菜单,只需按住键盘 [Ctrl] 键 + 鼠标左键拖拽,即可激活测量。 即时数据 (Instant Data) :在拖拽过程中,实时显示点数 (Points) 以及对应的账户货币价值 (Value)。 全品种支持 (Universal Support) :内置智能算法,完美支持黄金 (XAUUSD)、原油、股指及所有外汇货币对,无需手动配置合约参数。 图表整洁 (Clean Interface) :测量结束后松开鼠标,测量线与数据标签自动消失
FREE

The first currency based indicator to draw a distinction between map and strength. The map shows the currencies in terms of oversold/overbought levels and gives the direction of travel. The currency strength calculates and shows the strength of that move. Alerts are included for changes in currency direction on the map (confirmed over two bars) and also when the strength reached the appropriate level. The currency map is useful for finding currency pairs to trade and in which direction. Look fo

US30 Revolt a Technical indicator that is 100% non-repaint and appears on the current candlestick works on all timeframes (recommended M15,M30,H1) The indicator is made for US30 but it can be used on other pairs as well When a blue arrow appears look for buying opportunities When a orange arrow appears look for selling opportunities Please watch the YouTube video on how to properly set up and use the indicator
FREE

OneShotFX is a scalping arrow signals type indicator, an all in one arrow system with money management and filtered signals. How to trade Buy : when up arrow prints on the chart open buy trade, set your tp and sl on colored tp and sl lines above and below the arrow signal candle. Sell: when up arrow prints on the chart open sell trade, set your tp and sl on colored tp and sl lines above and below the arrow signal candle. Why is it a good choice Plenty of signals : no need to wait for long per
FREE

ADR 警報儀表板一目了然地向您顯示當前價格相對於其正常平均每日範圍的交易位置。當價格超過您選擇的平均範圍和高於它的水平時,您將通過彈出窗口、電子郵件或推送獲得即時警報,以便您可以快速跳入回調和反轉。破折號旨在放置在空白圖表上,只需坐在背景中並在達到水平時提醒您,因此您無需坐下來觀看甚至看! 此處提供 MT5 版本: https://www.mql5.com/en/market/product/66316
新:現在還向您顯示平均每周和每月範圍,並提醒他們!
獲取在您的圖表上繪製水平的 ADR 反轉指標: https://www.mql5.com/en/market/product/62757
大約 60% 的時間價格在其正常的平均每日範圍 (ADR) 內交易並推高這些水平通常是價格急劇波動的指標,通常會出現回調(獲利了結)走勢。您可以通過交易從每日範圍的頂部或底部回落到最近的支撐位或阻力位來利用這些急劇波動。
收集了超過 20 年的歷史數據,以找出主要外匯對和一系列交叉盤的價格超出特定 ADR 水平的平均百分比。該數據表明價格僅在 3% 的時間內超過其 ADR 的 200%,

Discover Your Edge with Golden Trend Finder Are you tired of second-guessing your trades? Golden Trend Finder is the all-in-one indicator designed to give you a decisive advantage in the market. It's not just another tool; it's a powerful signal generator that combines multiple advanced indicators to provide you with clear, confirmed trading opportunities. Imagine having a smart system that tells you exactly when to enter and exit a trade, filtered to avoid false signals. Golden Trend Finder doe
FREE

Indicator Name: "The Range Master" Core Purpose The Range Master is an advanced, multi-timeframe technical indicator designed to identify market consolidation (sideways ranging) and subsequent high-momentum breakout opportunities. It helps traders visually confirm when price action transitions from low-volatility accumulation to high-volatility trend initiation. ️ Functional Description (What it Does) The Range Master performs three primary, interconnected functions: Range Mapping , Breakout
FREE

指标显示所选时间帧上的最大水平交易量。 基于指标 UPD1 Volume Box 。 线可以连接或分离。 在设置中,您可以启用智能触摸通知。 这个指标对于那些使用市场概况和智能货币概念进行交易的人来说非常有用。
输入参数 。
基本设置 。 Bars Count - 表示将在其上绘制TF POC的条数 。 Data Source - 使用蜱虫的时间范围。 Vertical Step - 影响密度和垂直精度 。 TimeFrame Period - 应用最大水平交易量的时间段 。 ID - 指标标识号。 选择不同的值以在同一图表上多次使用指标 。
视觉设置 。 Current POC - 显示出现的POC 。 Crop Line To Current Bar - 这条线不会超过最后一条 。 Link POC - 用垂直线连接POC线 。 POC Width - POC线厚度 。 POC Color ID - 所选指标ID的poc线颜色 。 Extend Line Multiplier - POC线的延续,乘数。 等于1。 该线由相同数量的条形扩展 。 Extend Line St
FREE

RSI Divergence Full +10 other divergence indicators
Contact me after payment to send you the User-Manual PDF File. Download the MT5 version here. Also you can download the >>> Hybrid Trading EA <<< that is designed and implemented based on RSI Divergence Indicator. RSI is a pretty useful indicator in itself but it's even more effective when you trade divergence patterns with that. Because the divergence signal of the RSI indicator is one of the most powerful signals among the indicators. Di
** All Symbols x All Time frames scan just by pressing scanner button ** After 18 years of experience in the markets and programming, Winner indicator is ready. I would like to share with you! *** Contact me to send you " Trend Finder indicator " free, instruction and add you in "M1 Signal Scanner group" for sharing or seeing experiences with other users. Introduction: M1 Signal Scanner is the indicator designed scalping M1 time frame to detect Small trend switching in the direction

Unlock Precision Trading with Pinpoint Extreme Swing! Are you tired of missing out on crucial market reversals? Do you wish you had a reliable tool to spot high-probability swing trading opportunities? Look no further! The Pinpoint Extreme Swing indicator is your ultimate partner in navigating the dynamic world of trading, designed to give you the edge you need to succeed. This powerful MQL4 indicator is engineered to identify significant market turning points by intelligently combining the Mon
FREE

Scalpetronix 指标 — Scalpetronix 机器人的信号核心 该指标实现了 Scalpetronix 智能交易系统所依赖的算法和信号。机器人的所有入场点都是基于这些计算生成的:指数移动平均线 (EMA) 的组合、通过 ADX 的趋势过滤、通过 ATR 的波动率归一化以及K线结构分析。 指标优势 基于多层 EMA 系统(快线和慢线)并带有动态阈值; 通过 ADX 过滤去除弱信号; 通过 ATR 考虑市场波动性,使灵敏度适应不同市场阶段; 分析 K 线结构(买入时使用 HH/HL 模型,卖出时使用 LH/LL 模型); 通过多层线条和区域填充可视化信号,并在入场点绘制箭头。 工作算法 EMA 与动态阈值计算
sep(t) = max(Point, 0.1 * ATR(t))
— 买入条件: EMA_fast(t) > EMA_slow(t) + sep(t)
— 卖出条件: EMA_fast(t) < EMA_slow(t) - sep(t) K线结构验证
— 买入: High(t-1) > High(t-2) 且 Low(t-1) > Low(t-2)
— 卖出: H
Introducing the Swing Point Model Indicator – A Professional Trading Tool The Swing Point Model Indicator is an innovative tool designed for traders who want to capture market structure and identify potential trading opportunities. With a logical and transparent approach, the Swing Point Model helps you gain deeper market insights and make precise trading decisions. This is multiple Timeframe indicator so you can choose Higher timeframe for detect Swing point model What Is the Swing Point Mo

Contact me after payment to send you the User-Manual PDF File. Divergence detection indicator with a special algorithm. Using divergences is very common in trading strategies. But finding opportunities for trading with the eyes is very difficult and sometimes we lose those opportunities. The indicator finds all the regular and hidden divergences. (RD & HD) It uses an advanced method to specify divergence. This indicator is very functional and can greatly improve the outcome of your trading. Thi

平均真实波动范围 ( ATR ) 是衡量特定天数内市场波动性的指标。 当价格到达该区间的末端时,就不要指望会有大的持续波动。 市场被认为已经油尽灯枯。如果价格尚未到达边缘,则仍有波动余地。 通过该指标公式,您可以计算出总的和单独的 "高-低 "水平。 您还可以使用这些水平作为支撑/阻力和目标。
输入参数。
Start Day - -从几时开始计算一天的起始日。00 - 默认值。 ATR - 计算天数。 Calc Mode - 选择计算方法(High-Low / High And Low)。
Visual Button - 按钮显示(启用/禁用) 。 Corner - 按钮锚定角度 。 X indent - 以像素为单位的水平填充 。 Y indent - 以像素为单位的垂直填充 。
Label Visual - 显示级别标签 。 Label Font Size - 字体大小 。 Label Shift Bars - 在酒吧的铭文的缩进 。 Label Tooltip - 在关卡上方的光标下显示文本 。
Levels Style
FREE
Scalp Arrow Exit Signals (MT4 Indicator) All-in-One MT4 Signals: Precise Entries, Exits & Re-entries for Any Trading Style! The "Scalp Arrow Exit Signals" is a professional-grade trading indicator for MetaTrader 4 (MT4) , engineered to be your comprehensive guide for reliable entry, exit, re-entry, retracement entry, and pull-back entry signals . This powerful forex tool operates as a complete "black-box" system, providing clear, actionable buy and sell signals with robust alerts across any inst

Zen Arrows
專為專業用途而設計,它擁有強大的訊號邏輯和安全的運算,可消除延遲或錯誤更新。
它不會重繪、刪除或修改過去的訊號。
所有買入和賣出訊號均在K線圖上產生並保持不變。
在實際交易中,訊號不會重繪-它會立即顯示在K線圖上。
它提供專業級的穩定性、準確性和靈活性。
該系統能夠準確識別趨勢反轉和動量變化,
提供高勝率的訊號,同時最大限度地減少雜訊和錯誤訊號。
主要功能
多級過濾系統(模組化,完全可自訂)
逼真的即時視覺化效果
圖表上直接顯示清晰的買入/賣出訊號
多級警報系統
彈出窗口,聲音提示
每個訊號僅觸發一次-不會重複。
針對MT4平台進行了全面最佳化。
適用於所有貨幣對、指數、股票、外匯和加密貨幣。
趨勢交易、波段交易、反轉確認。
尋求可靠、清晰的專業交易訊號的交易者。
交易者選擇此指標的原因:
高精度和高勝率,經多層過濾驗證。
無噪音、無重繪、無延遲。
清晰的視覺化效果,即時呈現趨勢資訊。
簡單易用、穩定可靠,適用於實盤交易。
FREE
Level Box Tool is a powerful and user-friendly custom indicator designed for traders who utilize technical analysis tools like rectangles and trend lines to identify key support, resistance, and price zones. This tool simplifies and speeds up the process of marking chart levels, offering both visual clarity and precision with its fully customizable panel, and now includes price-cross alerts — so you’ll never miss a key level again. MT5 Version - https://www.mql5.com/en/market/
FREE

關鍵區域偵測器 關鍵支撐與需求區域偵測工具 概述
一款先進的供需區域偵測指標,能識別並評級市場關鍵價格水平。該指標運用分形分析與多重驗證機制,精準標記並分類交易熱區。 核心功能 區域偵測
• 自動標記支撐位與阻力位
• 採用快慢雙分形系統雙重驗證
• 根據平均真實波幅(ATR)動態調整區域厚度
• 智能合併重疊區域保持界面簡潔 區域分級
• 成熟區域:經4次以上測試,可靠性最高
• 驗證區域:經1-3次測試,具良好參考性
• 待測區域:尚未經價格測試的新生區域
• 變節區域:支撐/阻力屬性發生轉換的區域
• 脆弱區域:較可能失效的薄弱地帶 強度評分系統
• 量化區域強度百分比(0-100%)
• 綜合加權計算:
區域存續時間(30%權重)
測試次數(40%權重)
近期測試活躍度(30%權重) 視覺化設計
• 依強度與類型分色標記
• 顯示價格測試區域的接觸點標記
• 可自訂區域樣式(實心/框線/寬度)
• 支持延伸區域至當前價位
• 可選顯示分形觸發點 預警系統
• 價格觸及區域時觸發警報
• 彈窗與音效通知自訂
• 可調整警報冷卻時間 自訂選項
• 歷史回

This indicators automatically draws the Support and resistances levels for you once you've dropped it on a chart. It reduces the hustle of drawing and redrawing these levels every time you analysis prices on a chart. With it, all you have to do is dropped it on a chart, adjust the settings to your liking and let the indicator do the rest. But wait, it gets better; the indicator is absolutely free! Get the new and improved version here: https://youtu.be/rTxbPOBu3nY Parameters Time-frame -> T
FREE

Paper-testing that finally feels like live trading. Intrabar MTF Replay is a live mini-charts panel with advanced intrabar replay functionality, built specifically for multi-timeframe traders. Traditional backtesting and paper-testing on static charts suffer from a fundamental problem: timeframes are out of sync by default. Intrabar MTF Replay solves this by reconstructing intrabar price action and indicators, synchronizing all timeframes down to the exact same point in time. Every chart, every
FREE

FX Correlation Matrix is a powerful multi-timeframe dashboard that helps traders analyze real-time currency correlations of up to 28 symbols at a glance. With customizable settings, sleek design, and manual symbol selection option, it enhances trade accuracy, reduces risk, and identifies profitable correlation-based opportunities. Setup & Guide: Download MT5 Version here. Exclusively for you: It's your chance to stay ahead of the market. Follow our MQL5 channel for daily market insights, char

** All Symbols x All Timeframes scan just by pressing scanner button ** *** Contact me to send you instruction and add you in "Wolfe Wave Scanner group" for sharing or seeing experiences with other users. Introduction: A Wolfe Wave is created with five-wave patterns in price. It shows supply and demand and a fight towards a balance price. T hese waves of price actions can help traders identify the boundaries of the trend . Also It helps forecast how the price will move in the near future
Scalping Explorer is a complete trading system. Our traders have tested and optimized its work for maximum effect. Trading with Scalping Explorer is easy. Open in Metatrader4 windows with currency pairs: EURUSD, GBPJPY, GBPUSD, AUDUSD, USDCHF. We include D1 timeframe on all currency pairs. Add the Scalping Explorer indicator to each window with a currency pair. In the indicator settings, we find the "Signal" parameter and set it to TRUE. Now, as soon as a signal appears on any of the currency p

Unlock Smarter Trading with Trend-Sensing Pro Are you tired of confusing charts and late signals? Trend-Sensing Pro is a powerful yet simple indicator designed to help you see market trends with crystal clarity. It combines the smoothness of an EMA (Exponential Moving Average) with a unique candle visualization, giving you a clean, noise-free view of the market's direction. Why You'll Love Trend-Sensing Pro See the True Trend : Trend-Sensing Pro cuts through market noise, making it easy to ident
FREE

Matrix Arrow Indicator Multi Timeframe Panel MT4 是一个免费的附加组件,是您的 Matrix Arrow Indicator MT4 的重要资产。它显示了当前 Matrix Arrow Indicator MT4 信号,用于 5 个用户自定义的时间范围和总共 16 个可修改的符号/工具。用户可以选择启用/禁用 Matrix Arrow Indicator MT4 包含的 10 个标准指标中的任何一个。所有 10 个标准指标属性也是可调整的,如 Matrix Arrow Indicator MT4 。 Matrix Arrow Indicator Multi Timeframe Panel MT4 还提供了更改它所附加的当前图表的选项,方法是单击 16 个可修改符号按钮中的任何一个。这将使您能够更快地在不同符号之间工作,并且不会再次错过交易机会。
如果您想使用这个免费的 Matrix Arrow Indicator Multi Timeframe Panel MT4 插件,您需要在此处单独购买 Matrix Arrow Indicato
FREE
This is a combine that combines the ATR, Candle Timer, Watermark indicators and a tool for working with graphical objects, which allows you to reduce the time for marking charts. Functionality: Levels and proteins with price tags; drawing strictly horizontal levels; continuous zigzag manually; expansion / truncation of lines, wrinkles; quick change of colors and fonts and shapes; Filling/removing the filling of vessels, triangles, ellipses; dragging by 1 (first) point and auto alignment of the h
FREE
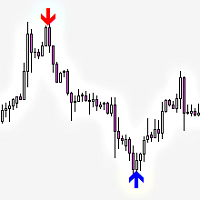
Railway Tracks Pattern — Reversal Pattern Indicator Railway Tracks Pattern is an indicator that automatically detects a powerful two-candle reversal pattern on the chart. It looks for two candles with opposite directions (bullish and bearish), similar in size, and with minimal wicks — a clear sign of momentum shift. How it works: The first candle is strong and directional. The second candle moves in the opposite direction and is of similar size. Both candles have small shadows (wicks). The
FREE

或者 ( BD% ) 这是一个波动率指数,以百分比而不是点来衡量波动率。 BD% 的想法是根据在 0% 和 100% 之间移动的经典标准偏差 (CSD) 创建一个索引。
您可以使用 BD% 来比较同一证券在不同时间段或不同时间范围内的波动率。此外,您可以使用 BD% 以百分比而非点数来比较不同市场中不同证券之间的波动率。
如何使用“BD%”
如果 BD% 低于 90%,然后向上越过该水平,则表明价格可能在区间内波动。 如果 BD% 高于 90%,然后向下穿过该水平,并且价格已经高于其简单移动平均线,则这是新的上升趋势开始的迹象。随着 BD% 进一步下行,波动性和趋势强度正在增加。当 BD% 为 0% 时,这意味着波动率处于最高值。 如果 BD% 高于 90%,然后向下穿过该水平,并且价格已经低于其简单移动平均线,则这是新的下降趋势开始的迹象。随着 BD% 进一步下行,波动性和趋势强度正在增加。当 BD% 为 0% 时,这意味着波动率处于最高值。
要了解有关 BD% 的更多信息,请从此处阅读用户手册: https://www.mql5.com/en/blogs/post/718
通过 Day and Week Separator MT4 优化您的交易分析,这是一款直观的工具,旨在绘制可自定义的每日和每周分隔线,非常适合需要处理经纪商时区差异的交易者。在 Forex Factory 和 Reddit 的 r/Forex 等交易社区中广受好评,因其简单而高效,这款指标解决了将图表时间框架与本地或特定市场时间对齐的常见问题,正如 Investopedia 和 TradingView 等平台上的讨论所强调的。交易者称赞其提高图表清晰度的能力,用户报告通过清晰标记交易时段,基于会话的分析得到改善,交易计划效率提高高达 20%,尤其是在时区偏移较大的地区(例如,使用欧洲经纪商的亚太地区交易者)。其优势包括精确可视化每日和每周市场过渡、可自定义的时区偏移以匹配本地或策略性时间,以及轻量级设计,可无缝集成到任何交易系统中,非常适合剥头皮、日内交易和波段交易者,旨在基于时间市场周期优化入场和出场。 Day and Week Separator MT4 在用户指定的时间(例如,图表时间 7:00 对应本地时间 00:00)绘制垂直虚线(默认 dash-dot-dot 样式,宽度
FREE
MetaTrader市场是一个简单方便的网站,在这里开发者可以出售自己的交易应用程序。
我们将帮助您发布您的产品,并向您解释如何为市场准备您的产品描述。市场上所有的应用程序都是加密保护并且只能在买家的电脑上运行。非法拷贝是不可能的。
您错过了交易机会:
- 免费交易应用程序
- 8,000+信号可供复制
- 探索金融市场的经济新闻
注册
登录