YouTube'dan Mağaza ile ilgili eğitici videoları izleyin
Bir alım-satım robotu veya gösterge nasıl satın alınır?
Uzman Danışmanınızı
sanal sunucuda çalıştırın
sanal sunucuda çalıştırın
Satın almadan önce göstergeyi/alım-satım robotunu test edin
Mağazada kazanç sağlamak ister misiniz?
Satış için bir ürün nasıl sunulur?
MetaTrader 4 için teknik göstergeler - 12

Peak Trough Analysis is the great tool to detect peaks and troughs in your chart. Peak Trough Analysis tool can use three different peaks and troughs detection algorithm. The three algorithm include the orignal Fractals Indicator by Bill Williams, the Modified Fractals indicator and ZigZag indicator. You can use this peak and trough analysis tool to detect the price pattern made up from Equilibrium Fractal-Wave process. For further usage, there are good guide line on how to use this peak trough
FREE

Matrix Arrow Indicator Çoklu Zaman Çerçevesi Paneli MT4 , Matrix Arrow Indicator MT4 için ücretsiz bir eklenti ve harika bir varlıktır. 5 kullanıcı tarafından özelleştirilmiş zaman çerçevesi ve toplamda 16 değiştirilebilir sembol/araç için mevcut Matrix Arrow Indicator MT4 sinyalini gösterir. Kullanıcı, Matrix Arrow Indicator MT4 'ün içerdiği 10 standart göstergeden herhangi birini etkinleştirme/devre dışı bırakma seçeneğine sahiptir. 10 standart gösterge özelliğinin tümü, Matrix Arrow Indicato
FREE

Forex ticaretinin Sherlock Holmes'u olmaya hazır mısınız? ️️ İşte size nihai ticaret aracı: Lisek Levels and Channels göstergesi!!! Birden fazla göstergeyle sirk numarası gibi jonglör yapmayı unutun. İhtiyacınız olan her şeyi etkileyici bir gösteriye paketledik: Fiyat seviyeleri? Tamam! Fiyat kanalları? İddiaya girebilirsiniz! Fiyat VWAP'ı? Oh evet! Hacim Dengesi? Hepsi burada! Peki ya üstündeki çilek? Sizi çift espressodan daha hızlı uyandıracak alarmlar ve anlık bildirimler! ️
FREE
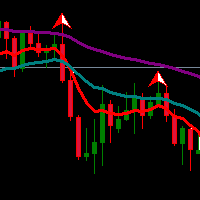
Exponential Moving Average (EMA) is an indicator that often be used by traders. Combination of two or three EMA indicators often applied to determine trend direction. Multiple EMA combined with fractals or oscillator indicator to detect overbought/oversold and divergence point also great to do in trading system.
If you like EMA indicator and want to get better indicator, highly recommended using EMA SuperTrend Strategy Indicator if you want to get better result in here:
https://www.mql5.com/en
FREE
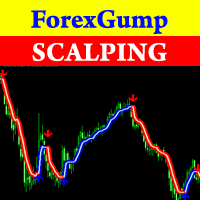
Attention! Friends, since there have been many scammers on the Internet recently selling indicators called ForexGump, we decided to warn you that only on our page is the LICENSE AUTHOR'S VERSION of the INDICATOR sold! We do not sell this indicator on other sites at a price lower than this! All indicators are sold cheaper - fakes! And even more often sold demo versions that stop working in a week! Therefore, in order not to risk your money, buy this indicator only on this site! Forex Gump Scalpin

About:
The Nadaraya-Watson Envelope is a sophisticated yet practical technical indicator that helps traders identify overbought and oversold conditions using advanced kernel regression methods. This is the MT4 only Version.
For MT5 Version go here: https://www.mql5.com/en/market/product/158641/
Key Features ATR-Based Bands: Three upper and three lower bands provide graduated overbought/oversold zones Logarithmic Scale Calculation Center Line - bullish (teal) or bearish (red)
What is the Nad
FREE

CIS is designed for trading a basket of correlating currencies, as well as single instruments: indicators
VSA indicator which draws arrows (does not redraw). Its signals indicate the price reversal on a calm market or decrease of the rise or fall rate during strong movements. Works fine in the flats. As the indicator uses volumes in its calculations, be careful during evenings and night times, when there are very small volumes. It is recommended to be used only on multiple currencies or at lea

"TRADING FROM THE SAFE SIDE OF THE MARKET !" Bonus: You get the Forex Trend Commander Indicator absolutely free!
A secret system built as an automatic indicator based on unique knowledge inspired by famous traders. The system uses the unique smart adaptable algorithm to overcome the difficulties of analysis and trading. All trade is protected by a stop loss to minimize possible drawdowns. Using the indicator with a professional money management system allows you to control capital and take adva
This is a powerful, session-aware breakout indicator designed for serious traders who thrive on volatility and structure. Engineered for precision, it identifies high-probability breakout zones during the London and New York trading sessions—where the market moves with intent. Key Features: Session Range Detection
Automatically detects and highlights the key price range of London and New York sessions. Breakout Confirmation
Identifies breakout candles after the session range, with cl
FREE
Time your Entry and Exits with Average True Range (ATR) Trailing Stops ATR Trailing Stops are primarily used to protect capital and lock in profits on individual trades but they can also be used, in conjunction with a trend filter, to signal entries. The indicator will help make your calculation of stop loss easier as it will be visually aiding you in choosing where to put your stoploss level on the chart by calculating the current value of ATR indicator. For those who are unfamiliar with ATR, i
FREE

Product Name: HTF Candle Insight (EurUsd) - See the Big Picture Description: IMPORTANT: This version works EXCLUSIVELY on the EURUSD symbol. (It supports all broker prefixes/suffixes, e.g., pro.EURUSD, EURUSD.m, but will NOT work on Gold, Bitcoin, or other pairs). Experience the full power of "HTF Candle Insight" completely on EURUSD! Stop switching tabs constantly! This indicator allows you to visualize Higher Timeframe price action directly on your current trading chart. Whether you are a Scal
FREE
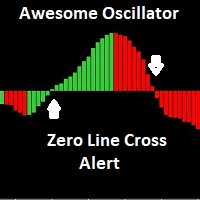
The Awesome Oscillator (AO) is an indicator used to measure market momentum. AO calculates the difference between a 34 Period and 5 Period Simple Moving Average. The Simple Moving Averages that are used are not calculated using closing price but rather each bar's midpoints. This indicator has email and pushup "mobile" features Alert, for any suggestions, please don't hesitate, thanks
FREE
This indicator is the mql version of the Linear Regression Candles indicator. Find out more here: https://www.mql5.com/en/users/rashedsamir/seller There are many linear regression indicators out there, most of them draw lines or channels, but this one actually draws a chart.This script includes features such as linear regression for open, high, low, and close prices, signal smoothing with simple or exponential moving averages. I welcome your suggestion for improving the indicator.
To incre
FREE
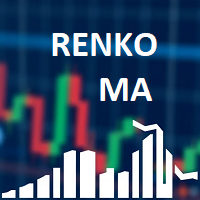
Renko Chart with Moving Average. Classic Renko charts idea. It is protted on main chart and Moving Average can be applied. Prices for bars are used from a lower timeframe. Parameters: BarsBack - how many bars of lower timeframe to use. If value is zero than it will use all available bars. LTF - lower timeframe. BrickSize - Renko bar in points. BullishColor - color for bull candle. BearishColor - color for bear candle. HideLineChart - if this value is true the line chart when be hidden when sele
FREE

Price Channels are also known as Donchian Channels being named after Richard Donchian. They use the highest and lowest price of a set number of periods to create an upper and lower channel or envelope around the price. The upper channel shows the high of the number of periods chosen. The lower channel shows the low of the number of periods chosen. For example, the screenshot shows the Price Channels using 320 periods. The upper channel in the screenshot shows the highest high of the previous 3
FREE
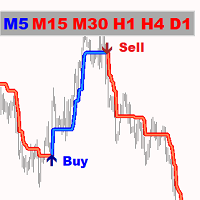
Gold Pointer en iyi trend göstergesidir. Göstergenin benzersiz algoritması, teknik ve matematiksel analiz faktörlerini dikkate alarak varlık fiyatının hareketini analiz eder, en karlı giriş noktalarını belirler ve bir AL veya SAT emri açmak için bir sinyal verir.
En iyi gösterge sinyalleri:
- SAT için = kırmızı trend çizgisi + kırmızı TF göstergesi + aynı yönde sarı sinyal oku. - AL için = mavi trend çizgisi + mavi TF göstergesi + aynı yönde aqua sinyal oku.
Göstergenin avantajları:
1. G

How To Use
Check out this post for detailed description on All Indicator extras and template: https://www.mql5.com/en/blogs/post/758259
The Best Heiken Ashi System is a simple trading system for trading based only two indicators for generate signals: Heiken ashi smoothed and Vqzz indicator multi-timeframe. The system was created for scalping and day trading but can also be configured for higher time frames. As mentioned, the trading system is simple, you get into position when the two indica
FREE

This indicator represents a genuine momentum oscillator according to the true definition of "Momentum", and as realised by the techniques of digital filtering. ( Note : download a complete set of true momentum oscillators here ). A scholarly paper on the subject by the current developer can be found here , but in this description we shall borrow only the minimum of conceptual and mathematical framework needed. In the process, we expose some long-held myths about indicators supposedly measurin
FREE

Forex Breath System , her piyasada kullanılabilen, trend bazlı bir ticaret sistemidir. Bu sistemi para birimleri, metaller, emtialar, endeksler, kripto ve hatta hisse senetleri ile kullanabilirsiniz. Ayrıca herhangi bir zaman diliminde de kullanılabilir. Sistem evrenseldir. Trendi gösterir ve trendle birlikte ok sinyalleri sağlar. Gösterge ayrıca, trend yönünde sinyaller göründüğünde size özel türde uyarılar da sağlayabilir, bu da trend ticaretini kolay bir iş haline getirir. Anlaşılması zor aya

BB Reversal Arrows Teknik Ticaret Sistemi, perakende kararları almak için ters noktaları tahmin etmek için geliştirilmiştir.
Mevcut pazar durumu gösterge ile analiz edilir ve çeşitli kriterler için yapılandırılır: ters anlar beklentisi, potansiyel dönüm noktaları, satın alma ve satış sinyalleri.
Gösterge fazla bilgi içermez, tüccarların makul kararlar vermesine izin veren görsel anlaşılabilir bir arayüze sahiptir.
Tüm oklar mumu kapatıyor gibi görünüyor, yeniden çizim yapmadan, birkaç uyarı tür
Gold Rush Signal Pro: Triple-Filter Precision Indicator Tired of false signals and getting whipped out by market noise? The Gold Rush Signal Pro indicator is engineered to cut through the confusion, providing you with high-probability trading opportunities powered by three layers of filtering. This is not just another Moving Average tool—it's a complete system designed for precision. Why You Need Gold Rush Signal Pro This indicator is your competitive edge, focusing on market confluence to ensu
FREE

The Supertrend Indicator is a popular technical analysis tool designed to assist traders in identifying market trends. The indicator combines the average true range (ATR) with a multiplier to calculate its value. This value is then added to or subtracted from the asset’s closing price to plot the supertrend line. The Supertrend Indicator can help identify trends, manage risk, and confirm market tendencies. The indicator is limited by its lagging nature, is not very flexible, and can send up fal
FREE
Overview
The TTM Squeeze indicator helps identify low volatility periods (squeeze) that often precede price breakouts. It uses Bollinger Bands (BB) and Keltner Channels (KC) to determine when the market is "coiling" and ready to move. Configuration Guide Volatility Settings The indicator uses Bollinger Bands to measure market volatility. When BBs are inside Keltner Channels, a squeeze is detected. The squeeze suggests the market is consolidating and may soon break out. True Range Option Optiona
FREE

Unlock Smarter Trading with Trend-Sensing Pro Are you tired of confusing charts and late signals? Trend-Sensing Pro is a powerful yet simple indicator designed to help you see market trends with crystal clarity. It combines the smoothness of an EMA (Exponential Moving Average) with a unique candle visualization, giving you a clean, noise-free view of the market's direction. Why You'll Love Trend-Sensing Pro See the True Trend : Trend-Sensing Pro cuts through market noise, making it easy to ident
FREE
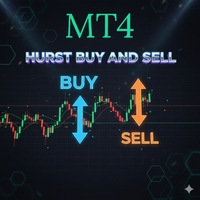
Hurst Buy and Sell This innovative indicator, inspired by xAI Grok intelligence, uses the Hurst exponent to identify the nature of the market and generate buy/sell signals. The EA for this indicator (Hurst Razer PRO EA MT5) is now available, you can see it by clicking here! https://www.mql5.com/es/market/product/153441?source=Site+Profile+Seller If you want more signals from the indicator, change the minimum number of bars between consecutive signals. The lower the value, the more signals it
FREE

Bermaui Bantları (BB), değişen ve trend olan fiyat hareketleri arasında filtrelemeye yardımcı olan bir teknik analiz aracıdır. Bu göstergenin arkasındaki fikir, sonraki adımlarda açıklanabilir: 0 ile 100 arasında hareket eden bir osilatör olarak Standart Sapmayı hesaplayın. Ben buna Bermaui Sapma yüzdesi (BD %) adını vereceğim. "BD %" sıfıra yakınsa, oynaklık en uç noktadadır. Ayrıca "BD %" 100'e yakınsa oynaklık çok düşüktür. Yüksek oynaklık, trend olan bir piyasa için büyük bir olasılık anlamı
Double top and bottom indicator is a pattern scanning indicator which scans the tops and bottoms using zig zag pattern. When it find price bouncing back from the same point twice after a long trend then it generate arrow signals whenever the last resistance points is broken for double bottom and last support price broken for double top. Unlike other top bottom scanner it does not give only 1 signal. it alerts user when ever the last support /resistance is broker from double top/bottom pattern un
FREE

OneShotFX is a scalping arrow signals type indicator, an all in one arrow system with money management and filtered signals. How to trade Buy : when up arrow prints on the chart open buy trade, set your tp and sl on colored tp and sl lines above and below the arrow signal candle. Sell: when up arrow prints on the chart open sell trade, set your tp and sl on colored tp and sl lines above and below the arrow signal candle. Why is it a good choice Plenty of signals : no need to wait for long per
FREE
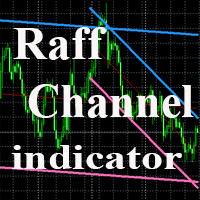
The indicator plots a trend channel using the technique by Gilbert Raff. The channel axis is a first-order regression. The upper and lower lines show the maximum distance the Close line had moved away from the axis line. Therefore, the upper and lower lines can be considered as resistance and support lines, respectively. A similar version of the indicator for the MT5 terminal
As a rule, most movements of the price occur within a channel, going beyond the support or resistance line only for a sh
FREE

Tipu Heikin-Ashi Panel is the modified version of the original Heiken Ashi indicator published by MetaQuotes here . A professional version of this indicator is available here .
Features An easy to use Panel that shows the Heiken Ashi trend of selected timeframe. Customizable Buy/Sell alerts, push alerts, email alerts, or visual on-screen alerts. Customizable Panel. The panel can be moved to any place on the chart or minimized to allow more space. Heikin means "the average", and Ashi means "foot
FREE
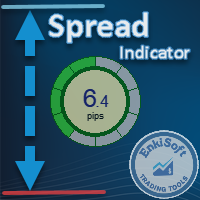
Custom Spread Indicator *Please write a review, thanks!
Also MT5 version is available
Spread Indicator show the current spread in pips with color codes. Handle 3 levels, Low, Medium, High. You can set levels and colors for each level (eg. Low: Green, Medium: Orange, High: Red), and can choose display position on the chart.
There is two spread calculation mode: -> Server spread value -> Ask - Bid value
Can set opacity, for better customization. When spread jump bigger, then display do not
FREE

At the very least, this indicator is able to entertain you. It builds a moving line based on interpolation by a polynomial of 1-4 powers and/or a function consisting of a sum of 1-5 sine curves. Various combinations are possible, for example, a sum of three sine curves about a second order parabola. The resulting line can be extrapolated by any of the specified functions and for various distances both as a single point at each indicator step (unchangeable line), and as a specified (re-painted) f

Introduction This indicator detects volume spread patterns for buy and sell opportunity. The patterns include demand and supply patterns. You might use each pattern for trading. However, these patterns are best used to detect the demand zone (=accumulation area) and supply zone (=distribution area). Demand pattern indicates generally potential buying opportunity. Supply pattern indicates generally potential selling opportunity. These are the underlying patterns rather than direct price action. T
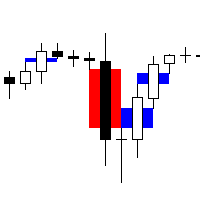
Fair Value Gap Scanner 4 is a sophisticated MetaTrader 5 indicator designed to detect fair value gaps (FVGs) in price action and display them as rectangles directly on the chart. This powerful tool empowers traders by providing visual representations of FVGs, enabling them to identify potential trading opportunities with ease and precision. With customizable parameters for color, width, and style, traders can tailor the indicator's appearance to suit their preferences and trading strategies. Key
FREE
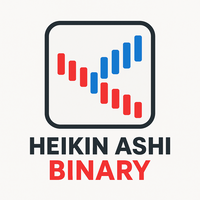
Heikin Ashi Binary – İkili Gösterimle Görsel Trend Destekleyici İndikatör Genel Bakış Heikin Ashi Binary, MetaTrader için geliştirilmiş ve Heikin Ashi trend bilgisini alt pencerede ikili (iki renkli bloklar) formatında gösteren bir indikatördür.
Klasik mum çubukları yerine, yükseliş (boğa) ve düşüş (ayı) dönemlerini basit renkli bloklarla temsil eder.
Bu sayede, trendin devamını veya olası dönüş noktalarını hızlıca tespit edebilirsiniz. İndikatör manuel işlemler, EA’lar (otomatik alım-satım) ve
FREE

as the name suggest Trend Maker Master is a trend scalping indicator that give long and short trading opportunity based on price action and ma style trend filter, the indicator Trend Period and Trend Extra Filter will change arrows signals quality and frequency, this leave a space for trader to come out with good combos for each pair. How to trade : Buy : when white buy arrow prints, set sl below recent swing low, and set tp to 1-1 Risk to reward ratio. Sell : when white Sell arrow prints, set
FREE

Description: The indicator measures, through the zigzag indicator, the levels of trend or correction. It shows in the chart the levels of each low or high detected. KEY LINKS: How to Install – Frequent Questions - All Products How is this indicator useful? This indicator determines, depending on Zigzag parameter if a trend is beginning, developing, or ending This indicator determines the direction of the trend Components Levels as positive or negative numbers, depending on the direction
FREE

Modified oscillator MACD. A classic indicator that combines a trend indicator with an oscillator to detect entry points. Has a multi-timeframe panel and 3 types of notifications
Benefits:
Works on all instruments and timeseries Trend indicator with oscillator for inputs Multi-period panel on all timeframes Pluggable arrows when signals appear Three types of notifications: push, email, alert
MT5 version -> HERE / Our news -> HERE
How the indicator works:
AW Classic MACD - Indicator of
FREE

The first currency based indicator to draw a distinction between map and strength. The map shows the currencies in terms of oversold/overbought levels and gives the direction of travel. The currency strength calculates and shows the strength of that move. Alerts are included for changes in currency direction on the map (confirmed over two bars) and also when the strength reached the appropriate level. The currency map is useful for finding currency pairs to trade and in which direction. Look fo

ADR Uyarı Gösterge Tablosu, normal ortalama günlük aralığa göre fiyatın şu anda nerede işlem gördüğünü bir bakışta size gösterir. Fiyat, ortalama aralığı ve seçtiğiniz seviyenin üzerindeki seviyeleri aştığında, açılır pencere, e-posta veya push yoluyla anında uyarılar alacaksınız, böylece hızlı bir şekilde geri çekilmelere ve geri dönüşlere atlayabilirsiniz. Çizgi, boş bir çizelgeye yerleştirilmek üzere tasarlanmıştır ve sadece arka planda oturun ve seviyelere ulaşıldığında sizi uyarır, böylece
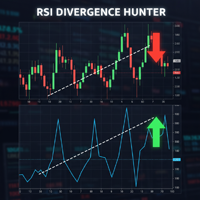
Powered by SVX Strategies Quant Team Divergences are among the most powerful signals in technical analysis, but spotting them in real-time is difficult and subjective. RSI Divergence Hunter automatically scans the market for these discrepancies between price and momentum. Eliminate Subjectivity, Automate Profit
Drawing lines manually leads to errors. If you prefer a fully automated, mathematical approach to trading, copy our official institutional algorithms: Copy "Friday Pulse" (Conservative/S
FREE

FullScalping , herhangi bir piyasada SÜREKLI scalping girişleri oluşturmak için özel olarak tasarlanmış yeniden çizim yapmayan, geriye doğru çizim yapmayan bir göstergedir. Kesintisiz aksiyon arayan agresif traderlar için mükemmel!
Özel bilgiler ve güncellemeler için kanala katılın: https://www.mql5.com/en/channels/forexnewadvisor
Neredeyse her mumda sinyal verdiğini fark edeceksiniz, ya trendi doğruluyor ya da önemli geri çekilmeleri işaret ediyor. Sürekli sizi yönlendiren bir radar gibi.
Na

Ürün Başlığı Smart Accumulation (MT4) – SmartView serisinin bir parçası Kısa Açıklama MetaTrader platformunda benzersiz bir kullanıcı deneyimi sunan Accumulation göstergesi. Daha önce mevcut olmayan gelişmiş özellikler sunar, çift tıklama ile ayarları açma, silmeden göstergeleri gizleme/gösterme ve gösterge penceresini tam grafik boyutunda görüntüleme gibi. SmartView Indicators serisinin geri kalanı ile sorunsuz çalışacak şekilde tasarlanmıştır. Genel Bakış SmartView serisi, yenilikçi özellikler
FREE

The MACD 2 Line Indicator is a powerful, upgraded version of the classic Moving Average Convergence Divergence (MACD) indicator.
This tool is the embodiment of versatility and functionality, capable of delivering comprehensive market insights to both beginner and advanced traders. The MACD 2 Line Indicator for MQL4 offers a dynamic perspective of market momentum and direction, through clear, visually compelling charts and real-time analysis. Metatrader5 Version | How-to Install Product | How-to
FREE

RSI Divergence Full +10 other divergence indicators
Contact me after payment to send you the User-Manual PDF File. Download the MT5 version here. Also you can download the >>> Hybrid Trading EA <<< that is designed and implemented based on RSI Divergence Indicator. RSI is a pretty useful indicator in itself but it's even more effective when you trade divergence patterns with that. Because the divergence signal of the RSI indicator is one of the most powerful signals among the indicators. Di
Scalpetronix Indicator — the signal core of the Scalpetronix robot. This indicator implements the algorithms and signals on which the Scalpetronix Expert Advisor operates. All entries of the robot are generated based on these calculations: a combination of exponential moving averages, trend filtering via ADX, volatility normalization through ATR, and bar structure analysis. Advantages of the indicator works on a multi-level EMA system (fast and slow) with a dynamic threshold; eliminates weak si
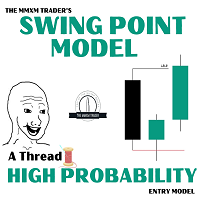
Introducing the Swing Point Model Indicator – A Professional Trading Tool The Swing Point Model Indicator is an innovative tool designed for traders who want to capture market structure and identify potential trading opportunities. With a logical and transparent approach, the Swing Point Model helps you gain deeper market insights and make precise trading decisions. This is multiple Timeframe indicator so you can choose Higher timeframe for detect Swing point model What Is the Swing Point Mo

Backtest with good trend detection results from January 2023
EURUSD Time frame: m15, m30, H1
AUDUSD Time frame: m15, m30 NASDAQ Time frame: m15 S&P 500 Time frame: m15, m30 XAUUSD Time frame: m30 BTCUSD Time frame: H4
These are just some of the assets tested (Please note that past results are no guarantee of future results). Note that this is not a complete strategy, you can use this indicator as an entry trigger after your analysis by setting stop loss and take profit values that you deem
FREE

Contact me after payment to send you the User-Manual PDF File. Divergence detection indicator with a special algorithm. Using divergences is very common in trading strategies. But finding opportunities for trading with the eyes is very difficult and sometimes we lose those opportunities. The indicator finds all the regular and hidden divergences. (RD & HD) It uses an advanced method to specify divergence. This indicator is very functional and can greatly improve the outcome of your trading. Thi
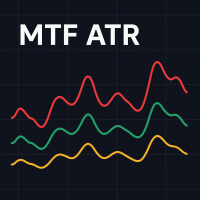
Multi-Timeframe ATR göstergesi, MetaTrader 4 için standart ATR göstergesinin geliştirilmiş bir versiyonudur; trader’ların istediği herhangi bir zaman dilimindeki volatiliteyi mevcut grafikte doğrudan görmesini sağlar. Standart ATR yalnızca aktif grafik zaman diliminin verilerini gösterirken, bu versiyon başka bir zaman dilimini seçme imkânı verir — örneğin M15 veya H1 grafiğinde Günlük ATR ’yi görüntülemek gibi. Nasıl çalışır:
Gösterge, seçtiğiniz zaman diliminden (örneğin H1, H4 veya D1)
FREE

GAP DETECTOR
FVG in trading refers to "Fair Value Gap", . It is a concept used in technical analysis to identify areas on a price chart where there is a discrepancy or gap between supply and demand. These gaps can occur due to rapid movements in price, usually as a result of important news or economic events, and are usually filled later as the market stabilizes. The GAP DETECTOR indicator is designed to identify fair value gaps (FVG) on the price chart and filter them using volatility to dete
FREE
Scalp Arrow Exit Signals (MT4 Indicator) All-in-One MT4 Signals: Precise Entries, Exits & Re-entries for Any Trading Style! The "Scalp Arrow Exit Signals" is a professional-grade trading indicator for MetaTrader 4 (MT4) , engineered to be your comprehensive guide for reliable entry, exit, re-entry, retracement entry, and pull-back entry signals . This powerful forex tool operates as a complete "black-box" system, providing clear, actionable buy and sell signals with robust alerts across any inst
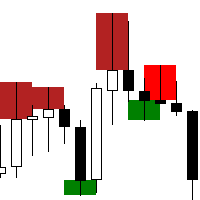
The "Rejection Block" MetaTrader 4 Indicator is a powerful tool designed to assist traders in identifying and visualizing rejection candlestick patterns, commonly referred to as rejection blocks. These patterns play a crucial role in market analysis as they often signify potential reversals or continuations in price movements. Key Features: Rejection Block Detection: The indicator meticulously scans price data to identify instances of rejection candlestick patterns. These patterns typically feat
FREE

Scalperler için VWAP
Hızlı, kesin scalp'ler için oturum farkında VWAP çizgileri. ️ Girdiler (MT4/MT5) Enable_Hourly_VWAP: Saatlik VWAP'ı etkinleştir. Enable_Asia_VWAP: Asya oturumu VWAP'ını etkinleştir. Enable_Europe_VWAP: Avrupa oturumu VWAP'ını etkinleştir. Enable_NA_VWAP: Kuzey Amerika oturumu VWAP'ını etkinleştir. Enable_Extended_VWAP: Genişletilmiş oturum VWAP'ını etkinleştir. Enable_Daily_VWAP: Günlük VWAP'ı etkinleştir. Asya Oturumu (GMT) Session_Asia_Start_Hour: Asya oturumu başlangıç
FREE

The " YK Find Support And Resistance " indicator is a technical analysis tool used to identify key support and resistance levels on a price chart. Its features and functions are as follows:
1. Displays support and resistance levels using arrow lines and colored bands, with resistance in red and support in green.
2. Can be adjusted to calculate and display results from a specified timeframe using the forced_tf variable. If set to 0, it will use the current timeframe of the chart.
3. Uses the
FREE
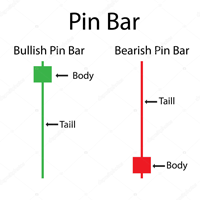
Pin bar pattern is characterized by a long upper or lower wick with a small body relative to the size of the wick with little to no lower or upper shadows. Pin bars are not to be traded in isolation , but need to be considered within the larger context of the chart analysis. A pin bar entry signal, in a trending market, can offer a very high-probability entry and a good risk to reward scenario.
Inputs MinimumTailPips- Minimum size of Tail in pips; TailBodyCandle- means how many times Tail grea
FREE
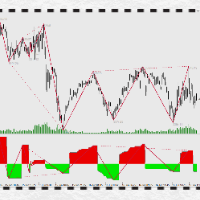
Introduction to PowerTrapezoid:
The application of market Power deviation system is not a secret, such as volume price deviation, MACD deviation, Chanlun deviation and so on. However, how to correctly understand and calculate, and accurately judge the increase or decrease of POWER is a threshold in application, which is difficult to cross with the conventional system. How to avoid reciting? How to implement multi level backflow parallel computing? How to intuitively show the range of backtrack
FREE
This is a combine that combines the ATR, Candle Timer, Watermark indicators and a tool for working with graphical objects, which allows you to reduce the time for marking charts. Functionality: Levels and proteins with price tags; drawing strictly horizontal levels; continuous zigzag manually; expansion / truncation of lines, wrinkles; quick change of colors and fonts and shapes; Filling/removing the filling of vessels, triangles, ellipses; dragging by 1 (first) point and auto alignment of the h
FREE

Gold TL MTF - this is a fine stock technical indicator. The indicator algorithm analyzes the movement of the asset price and reflects trend lines along the fractals of a specific timeframe (TF).
Benefits of the indicator: The indicator produces signals with high accuracy. The confirmed signal of the indicator does not disappear and is not redrawn. You can trade on the MetaTrader 4 trading platform of any broker. You can trade any assets (currencies, metals, cryptocurrencies, stocks, indices e
FREE

FX Correlation Matrix is a powerful multi-timeframe dashboard that helps traders analyze real-time currency correlations of up to 28 symbols at a glance. With customizable settings, sleek design, and manual symbol selection option, it enhances trade accuracy, reduces risk, and identifies profitable correlation-based opportunities. Setup & Guide: Download MT5 Version here. Exclusively for you: It's your chance to stay ahead of the market. Follow our MQL5 channel for daily market insights, char

** All Symbols x All Timeframes scan just by pressing scanner button ** *** Contact me to send you instruction and add you in "Wolfe Wave Scanner group" for sharing or seeing experiences with other users. Introduction: A Wolfe Wave is created with five-wave patterns in price. It shows supply and demand and a fight towards a balance price. T hese waves of price actions can help traders identify the boundaries of the trend . Also It helps forecast how the price will move in the near future
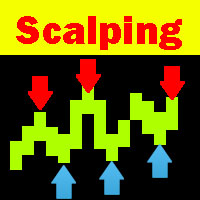
Scalping Explorer is a complete trading system. Our traders have tested and optimized its work for maximum effect. Trading with Scalping Explorer is easy. Open in Metatrader4 windows with currency pairs: EURUSD, GBPJPY, GBPUSD, AUDUSD, USDCHF. We include D1 timeframe on all currency pairs. Add the Scalping Explorer indicator to each window with a currency pair. In the indicator settings, we find the "Signal" parameter and set it to TRUE. Now, as soon as a signal appears on any of the currency p

This indicator can send alerts when a Heiken Ashi Smoothed color change occurs. Combined with your own rules and techniques, this indicator will allow you to create (or enhance) your own powerful system. Features Can send all types of alerts. Option to delay the alert one bar in order to confirm the color (trend) change. Input parameters Wait for candle close: 'true' or 'false'. Setting it to 'true' will delay the alert to the opening of the bar following the bar where the color change occurred.
FREE

Ürün Başlığı Smart RSI (MT4) – SmartView serisinin bir parçası Kısa Açıklama MetaTrader platformunda benzersiz bir kullanıcı deneyimi sunan RSI göstergesi. Daha önce mevcut olmayan gelişmiş özellikler sunar, çift tıklama ile ayarları açma, silmeden göstergeleri gizleme/gösterme ve gösterge penceresini tam grafik boyutunda görüntüleme gibi. SmartView Indicators serisinin geri kalanı ile sorunsuz çalışacak şekilde tasarlanmıştır. Genel Bakış SmartView serisi, yenilikçi özellikler aracılığıyla Meta
FREE

Dashboard uses Ichimoku Strategy to find best trades.
Get extra Indicators/Template: And read more about detailed Product Description and usage here: https://www.mql5.com/en/blogs/post/747457
Read more about Scanner Common features in detail here: https://www.mql5.com/en/blogs/post/747456
Features:
Price Kumo Breakout Tenkan-Kijun Cross Chikou/CLoud and Chikou/Price Support/Resistance (SR-SS or SR-NRTR) Stochastic OB/OS and back Awesome Oscillator Higher Timeframe Ichimoku Trend Align
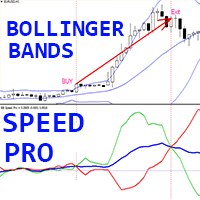
Benzersiz trend Crypto_Forex Göstergesi "Bollinger Bantları Hız Pro" MT4 için, Yeniden Boyama Yok.
- Bu göstergenin hesaplanması fizik denklemlerine dayanmaktadır. - Hız, standart Bollinger Bantlarının 1. türevidir. - Bollinger Bantları Hız Pro göstergesi, BB orta çizgisinin ve BB kenarlıklarının yönlerini ne kadar hızlı değiştirdiğini gösterir. - Varsayılan olarak: Mavi çizgi BB orta çizgisinin hızıdır, Kırmızı çizgi - alt kenarlığın hızı, Yeşil çizgi - üst kenarlığın hızıdır. - Trend stratej

Bu, Breakout ve FIBONACCI seviyelerine dayanan basit bir stratejidir.
Bir kopuşun ardından,
ya piyasa doğrudan 161, 261 ve 423 seviyelerine doğru ilerlemeye devam ediyor
veya %50 seviyesine geri döner (düzeltme olarak da adlandırılır) ve ardından büyük olasılıkla başlangıç yönünde 161, 261 ve 423 seviyelerine doğru harekete devam eder.
Sistemin anahtarı yeşil (YUKARI TREND) veya kırmızı (AŞAĞI TREND) dikdörtgen nesneyle gösterilen kırılma çubuğunun tespitidir.
Kırılma anında fibonacci hede

This indicator Super Channel Pro Pluss indicator.Indicator displays trend movement. Indicator calculates automatically line. Features
FiltPer - displays indicator channel period. deviation - displays indicator channel deviation. deviation2 - displays indicator channel deviation. deviation3 - displays indicator channel deviation. How to understand the status: If the arrow is up and line color Teal ;trend is up. If the arrow is down and line color Red; trend is down. If the arrow is Yellow close

Universal author's strategy, allows to determine the entry points for Buy and Sell both in the direction of the trend, on the reversals of trends and in the flat market. The indicator is equipped with a unique scanner which each tick analyzes the price chart, calculates optimal levels and patterns for finding entry points by one of the 3 strategies. Each of the strategies combines author formulas and algorithms, for optimal trading we recommend using 3 strategies simultaneously as they are compl

Indicator designed for both beginners and professionals. RECOMMEHDATION Trade with this indicator for 2-3 weeks and you will feel significant progress in your trading. This indicator is developed based on the use of HMA, Laguerre, CCI . The indicator is clear and does not require any setting. Does not redraw and works by opening bar. It works on timeframes M1-D1. I use timeframe M5 to enter the market.
FREE
MetaTrader mağazası - yatırımcılar için alım-satım robotları ve teknik göstergeler doğrudan işlem terminalinde mevcuttur.
MQL5.community ödeme sistemi, MetaTrader hizmetlerindeki işlemler için MQL5.com sitesinin tüm kayıtlı kullanıcıları tarafından kullanılabilir. WebMoney, PayPal veya banka kartı kullanarak para yatırabilir ve çekebilirsiniz.
Alım-satım fırsatlarını kaçırıyorsunuz:
- Ücretsiz alım-satım uygulamaları
- İşlem kopyalama için 8.000'den fazla sinyal
- Finansal piyasaları keşfetmek için ekonomik haberler
Kayıt
Giriş yap
Gizlilik ve Veri Koruma Politikasını ve MQL5.com Kullanım Şartlarını kabul edersiniz
Hesabınız yoksa, lütfen kaydolun
MQL5.com web sitesine giriş yapmak için çerezlerin kullanımına izin vermelisiniz.
Lütfen tarayıcınızda gerekli ayarı etkinleştirin, aksi takdirde giriş yapamazsınız.