Watch the Market tutorial videos on YouTube
How to buy а trading robot or an indicator
Run your EA on
virtual hosting
virtual hosting
Test аn indicator/trading robot before buying
Want to earn in the Market?
How to present a product for a sell-through
Technical Indicators for MetaTrader 4 - 15

Introduction Harmonic Patterns are best used to predict potential turning point. Traditionally, Harmonic Pattern was identified manually connecting peaks and troughs points in the chart. Manual harmonic pattern detection is painfully tedious and not suitable for everyone. You are often exposed under subjective pattern identification with manual pattern detection. To avoid these limitations, Harmonic Pattern Plus was designed to automate your harmonic pattern detection process. The functionality

CS ATR FIBO CHANNELS MULTI TIMEFRAME
Additional tool to trade with Cycle Sniper Indicator.
Cycle Sniper : https://www.mql5.com/en/market/product/51950 Indicator Draws Channels based on: - Cycle Sniper Price and Moving Averages - ATR Deviations - Fibonacci Retracement and Extensions
Features: - Multi TimeFrame - Full alert and Notification options. - Simple Settings - Finds the trend change or extreme reversals.
Inputs: - Arrow Mode: ATR Levels or Median Line If Median Line is selected ind

The ACB Trade Filter indicator provides a solution for filtering out the low probability trading setups in a trading strategy. The indicator uses a sophisticated filtration algorithm based on the market sentiment and trend.
Applications Works great with our indicator " ACB Breakout Arrows ". Filter out low probability signals from any indicator. Avoid overtrading and minimize the losses. Trade in the direction of market sentiment and trend. Avoid the choppiness in the market.
How to use Only L
- Real price is 80$ - 60% Discount (It is 30$ now) - It is enabled for 1 purchase. Contact me for extra bonus tool, instruction or any questions! - Non-repaint, No lag - I just sell my products in Elif Kaya Profile, any other websites are stolen old versions, So no any new updates or support. - Lifetime update free
Introduction Smart Money Concepts (SMC) strategy was initially popularized the Inner Circle Trading (ICT) method which is claimed to be the evolved version of the SMC. Essenti

Trend Lines Cross This indicator will alert you on any cross of a Trendline. You can draw up to two trend lines and form a channel, a pennant , a triangle or a simple trend and when the price crosses either trend line the indicator will provide you with alerts that you define plus an up or down arrow when the cross happened. How to: Draw the 1st trendline and name it tl1. Draw the 2nd trendline and name it tl2. Select which type of alerts you would like in the indicator properties and you a
FREE

See RSI values turned into colored candles
This indicator provides both colored candles and a colored moving average. 6 drawaing styles are provided to allow customization of the color coding.
Applying coding to the chart may help in conceptualizing price trend and impulse movements defined through RSI values.
Features - optional colored candles - optional colored ma - 6 draw styles; RSI slope RSI above/below overbought/oversold levels RSI above/below level 50 RSI above/below it's moving average
FREE

Smart Fibo Zones are powerful, auto-generated Fibonacci Retracements that are anchored to key market structure shifts . These zones serve as critical Supply and Demand levels, guiding you to identify potential price reactions and confirm market direction. Fibonacci calculations, widely used by professional traders, can be complex when it comes to identifying highs and lows. However, Smart Fibo Zones simplify this process by automatically highlighting order blocks and key zones, complete with St
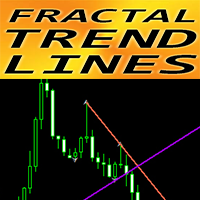
Crypto_Forex Indicator "Fractal Trend Lines" for MT4. This indicator is excellent for traders who use Graphical Analysis with breakouts!!! "Fractal Trend Lines" shows graphical Up Trend (violet) & Down Trend (red color) lines. Up Trend & Down Trend lines are built on 2 nearest corresponding fractals. Indicator has few parameters responsible for trend lines color and width. I ndicator has built-in Mobile and PC alert of breakout. Click here to see high quality Trading Robots and Indicators! T
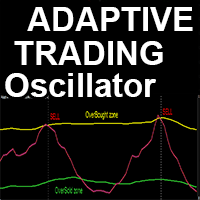
Advanced custom Crypto_Forex indicator "Adaptive Trading Oscillator" - efficient auxiliary Trading tool for MT4!
- This indicator is a New generation of Oscillators - see pictures to check how to use it. - "Adaptive Trading Oscillator" has adjustable adaptive Oversold/Overbought zones. - This oscillator is an auxiliary tool to find exact trade entry points on the Exits from dynamic OverSold/OverBought areas. - Oversold zone: below the Green line. - Overbought zone: above Yellow line . - This
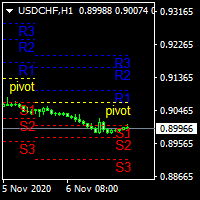
.................................if you need pivot point s levels............................... ............................this is a daily pivot point level creator........................... ...it is for daily pivots and show levels at times period H4 , H1 , M30 , M15 ,M 5... .................................also shows levels for 3 last days.............................. ................can use it with other indicators and see important levels...............
FREE

CustomMultiBarFractal Indicator Description
Overview The CustomMultiBarFractal indicator identifies and displays fractal patterns on price charts. Fractals represent significant price reversal points that can serve as signals for trading strategies.
Key Features - Detects fractals based on a user-defined analysis period - Displays upper and lower fractals with customizable colors - Allows offset adjustment from price extremes - Provides flexible visualization settings - Support
FREE
40% off. Original price: $50
Moving Average Trend Scanner is a multi symbol multi timeframe triple MA crossover dashboard that helps traders to monitor, and identify potential market trends from one chart. This panel scans 3 moving averages in up to 28 configurable instruments and 9 timeframes for triple moving average alignment and moving average crossover with a deep scan feature to scan all market watch symbols (up to 1000 instruments!).
Download Demo here (Scans only M1 and M5) Settings

Boost your trend-spotting capabilities with the Consecutive Candle Indicator MT4, a dynamic tool designed to identify streaks of bullish or bearish candles, delivering timely alerts for trend confirmations and potential reversals in forex, stocks, crypto, and commodities markets. Celebrated in trading communities like Forex Factory and Reddit’s r/Forex, as well as praised in discussions on Investopedia and TradingView for its ability to simplify momentum analysis, this indicator is a favorite a
FREE

The SPV Volatility indicator is one of the most effective filters. Volatility filter. Shows three volatility options. The so-called limit, real, and the last most effective filter for the filter is the percentage filter. Percentage display of folatility shows the ratio of limit to real volatility. And thus, if we trade in the middle of the channel, then it is necessary to set a condition that the percentage is less than a certain indicator value. If we trade on the channel breakout - following t
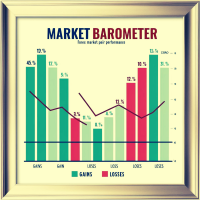
Market Barometer is a cheat code for trading, it acts as a "barometer" for market sentiment across various pairs, showcasing their changes. You can tell right away what to trade. You can trade trends or reversals. MT5 Version: https://www.mql5.com/en/market/product/127467 Market Barometer is a powerful tool designed to track and visualize the percentage changes across multiple currency pairs. By analyzing the price shifts of different forex pairs, it helps you understand how they are correlat

This indicator is designed to detect high probability reversal patterns: Double Tops/Bottoms with fake breakouts . Please read also the blog post " How To Yield Big Winners Consistently! " which explains the concepts behind the ULTIMATE Double Top/Bottom indicator and how you can use a top-down approach to get 15 - 20R winning trades on a regular basis . The provided video shows the maximum performance of the indicator. With maximum performance, I mean that this could have been the profit if you
ICT Template Indicator visualizes and automatically updates all important ICT elements for Scalpers, Day and Swing traders. It allows you too keep your chart clean and bring any elements by just one click to the side buttons. Thanks to mobile notifications on external liquidity levels, you will not miss any opportunity and you don't have to sit behind the screens whole day. Each element has fully customizable colours, width, line types, max timeframe to be shown etc... so you can really tweak y
The indicator finds the low, high, extreme volume based on the specified coefficients and paints them in the specified colors. This replaces the standard volume drawing function in the metatrader terminal. Bars can also be painted in the color of the volume. On bars with extreme volume, the maximum horizontal volume (cluster/POC) is determined. Depending on its location (pushing, neutral, stopping), the cluster also has its own color. If the cluster is in the shadow, and the bar has an extreme
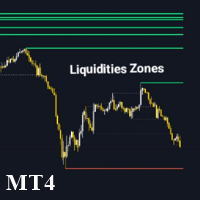
The Liquidity Zone Detector is an advanced technical indicator designed to identify and highlight key liquidity zones in the market using the ZigZag indicator. This tool pinpoints price levels where significant liquidity is likely present by drawing trendlines at the highs and lows detected by the ZigZag. The Liquidity Zone Detector assists traders in spotting potential reversal or trend continuation areas based on liquidity accumulation or release. Key Features: Automatic Liquidity Zone Identif
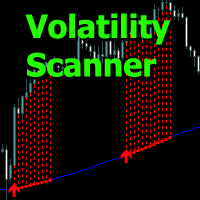
Volatility Scanner - the indicator analyzes the market condition and shows the zones of increasing volatility with histogram lines.
The indicator allows you to determine the moments for entering and holding positions, working in the trend direction or when to wait out the time without trading.
Input parameters allow you to independently configure the indicator for the desired trading instrument or time frame.
Any time frames for use from minute to daily.
There are several types of alerts.
All in

Introduction RSI divergence is a main technique used to determine trend reversing when it’s time to sell or buy because prices are likely to drop or pick in the charts. The RSI Divergence indicator can help you locate the top and bottom of the market. This indicator finds Regular divergence for pullback the market and also finds hidden RSI Divergence to show continuing trend. This indicator shows divergence on the RSI that is a strong hint for an excellent entry point and finds immediately with
FREE
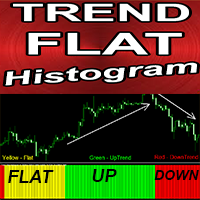
Crypto_Forex Indicator "Trend Flat Histogram" for MT4, No Repaint.
- Trend Flat Histogram indicator is very sensitive and much more efficient than any standard Moving Averages. - It is designed to show current market conditions: Flat, Uptrend, Downtrend. - Indicator has 3 colors: Yellow for Flat market conditions, Red for downtrend and Green for uptrend (colors can be changed in settings). - With Mobile and PC alerts. - It is great to combine this indicator with any other trading methods: Pri

本指标 基于 Zigzag 基础上... 增加了: 1.增加了箭头指示,使图表更鲜明 2.增加了价格显示,使大家更清楚的看清价格. 3.增加了报警等设置,可以支持邮件发送 原指标特性: 1.基本的波段指标构型. 2.最近的2个ZIGZAG点不具有稳定性,随着行情而改变,(就是网友所说的未来函数) 3.原指标适合分析历史拐点,波段特性,对于价格波动有一定的指导性.
Zigzag的使用方法一 丈量一段行情的起点和终点 (1)用ZigZag标注的折点作为起点和终点之后,行情的走势方向就被确立了(空头趋势); (2)根据道氏理论的逻辑,行情会按照波峰浪谷的锯齿形运行,行情确立之后会走回撤行情,回撤的过程中ZigZag会再次形成折点,就是回撤点; (3)在回撤点选择机会进场,等待行情再次启动,止损可以放到回撤的高点。 一套交易系统基本的框架就建立起来了。 Zigzag的使用方法二 作为画趋势线的连接点 趋势线是很常见的技术指标,在技术分析中被广泛地使用。 但一直以来趋势线在实战中都存在一个BUG,那就是难以保证划线的一致性。 在图表上有很多的高低点,到底该连接哪一个呢?不同的书上画趋势线的方法
FREE

The Average True Range ( ATR ) is a measure of market volatility over a specified number of days. You should not expect a big continuation move when the price has reached the end of the range. The market is considered to have run out of fuel. If the price has not reached the edge, it still has a range. The indicator formula allows you to calculate High-Low levels both in aggregate and individually. You can also use these levels as support/resistance and target.
Input parameters.
Start Day - f
FREE

Product Title Smart OsMA (MT4) – part of the SmartView series Short Description A OsMA indicator with a unique user experience on MetaTrader platform. Features advanced capabilities not previously available, such as opening settings with double-click, hiding and showing indicators without deleting them, and displaying indicator windows at full chart size. Designed to work seamlessly with the rest of the SmartView Indicators series. Overview The SmartView series offers a unique and distinctive us
FREE

Product Title Smart ATR (MT4) – part of the SmartView series Short Description A ATR indicator with a unique user experience on MetaTrader platform. Features advanced capabilities not previously available, such as opening settings with double-click, hiding and showing indicators without deleting them, and displaying indicator windows at full chart size. Designed to work seamlessly with the rest of the SmartView Indicators series. Overview The SmartView series offers a unique and distinctive user
FREE

This comprehensive technical indicator calculates and plots up to 3 moving averages with 3 different periods. By employing three moving averages of distinct lookback periods, the trader can confirm whether the market has indeed experienced a change in trend or whether it is merely pausing momentarily before resuming its prior state. SX Golden MA Pack for MT5 is available here . The shorter the moving average period, the more closely it tracks the price curve. When a security initiates an upt
FREE

Summer Sale: 50% OFF!!! Promotion is valid until 08 August 2025! This indicator is unstoppable when combined with our other indicator called Katana. After purchase, send us a message and you could get Katana for FREE as a BONUS After purchase, send us a private message for your instructions. The Trend Forecasting indicator is a very unique & easy tool that is able to make prediction about future price movement based on the signals generated by MACD . It helps you have an estimation on the are
Trend Reversal Master Unlock Your Trading Potential with Precision Are you tired of missing key market reversals? Do you struggle to find high-probability entry points? "Trend Reversal Master" is the smart MQL4 indicator designed to help you spot potential trend shifts with confidence and clarity. This powerful tool combines the best of two worlds: the dynamic Parabolic SAR (PSAR) and the robust 200-period Exponential Moving Average (EMA). By filtering PSAR signals through the long-term trend de
FREE
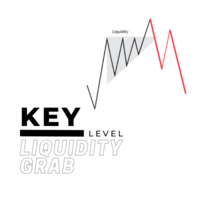
For a bullish move to occur for example, there should be alot of buying power. but you cannot buy if there is no sell on the other side, so the big players usually tend to manipulate the market in order to create available positions on the other side and be able to open their positions and one of the ways is by creating a fake breakout/ a liquidity grab. Before majority of big reversal moves and trends are formed, a liquidty grab would have occured in order to have enough orders to push for the
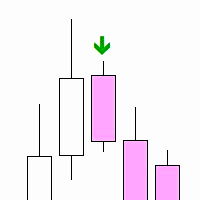
"Inside Bar PA" is a technical indicator designed to determine the inner bars on the chart. An internal bar is a bar or candle, the maximum and minimum of which are completely contained in the previous bar. This may signal a potential reversal or continuation of the trend, depending on the context.
Features: Automatic detection of internal bars. Visual marking of internal bars with arrows on the chart. The ability to adjust the distance of the mark from the bar. How to use: Attach the indicato
FREE

Scalping monster - ready trading system in the form of an indicator. Scalping monster is designed for the Metatrader4 platform. When placed on a forex chart, the indicator automatically analyzes the market using an adaptation algorithm and displays the signals to the trader in the form of red and blue dots. The indicator also shows in the upper right corner information about potential profit / loss.
Our other products at https://www.mql5.com/en/users/master-mql4/seller
How to trade using S
ALL MOVING AVERAGES: The Ultimate Custom Indicator for Diverse Strategies The ALL MOVING AVERAGES custom indicator is your essential tool for in-depth technical analysis, boasting an impressive collection of over 31 of the most popular moving averages . Designed for both seasoned traders and beginners, this indicator offers unparalleled flexibility, allowing you to perfectly tailor your moving averages to a wide array of trading strategies. With a comprehensive range of input parameters, includ
FREE
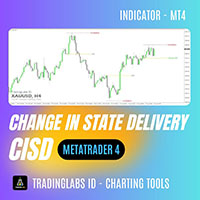
CISD (Change In State Delivery) Indicator TradingLabs ID – ICT Concept Tool The Change In State Delivery (CISD) Indicator is designed based on the ICT (Inner Circle Trader) concept, where price transitions from one delivery state to another often signal high-probability trade opportunities. This tool automatically detects and marks CISD levels on your MT4 charts, helping traders identify potential breakout and retest zones with great accuracy. It is especially useful for traders applying Smart

TRADING FLOW USING AUTO FIBO MUSANG + ALERT SIGNAL 1. Wait for Breakout Alert (Auto Signal) The Auto Fibo Musang system will automatically trigger an alert when a potential breakout is detected from previous price structure.
This serves as the early signal that the market may be ready to move. 2. Identify the Entry Zone (Auto Fibo Levels) The entry zones are auto-plotted based on Fibonacci Musang levels :
Buy Zone (blue levels), Sell Zone (red levels).
No need to draw manu
FREE
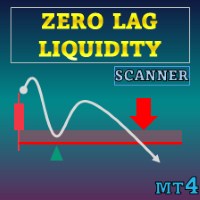
Special offer : ALL TOOLS , just $35 each! New tools will be $30 for the first week or the first 3 purchases ! Trading Tools Channel on MQL5 : Join my MQL5 channel to update the latest news from me Zero Lag Liquidity plots liquidity zones from lower-timeframe wick profiles and high-volume wicks. For each abnormal candle, the indicator builds an intra-wick volume histogram, finds a local Point of Control (POC), and renders that price as a level. Subsequent interactions can trigger l
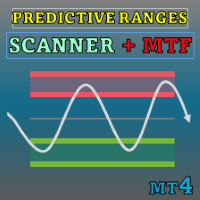
Special offer : ALL TOOLS , just $35 each! New tools will be $30 for the first week or the first 3 purchases ! Trading Tools Channel on MQL5 : Join my MQL5 channel to update the latest news from me In today's volatile financial trading landscape, accurately identifying support and resistance levels is crucial for traders to make informed decisions. Predictive Ranges Scanner Multi-TF is an advanced tool designed to assist traders in scanning and predicting future trading ranges acro
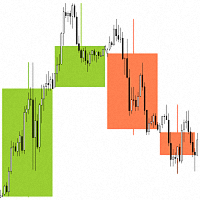
"Candlesticks MTF 4" is an information indicator that displays "Japanese Candlesticks" . The indicator analyzes and determines the opening and closing times of candles from higher time frames.
An algorithm has been developed for the "Candlesticks MTF 4" indicator that corrects the discrepancy between the opening and closing times of candles from higher time frames. For example, if the opening time of a candle on a weekly time frame is the 1st of the month, and on the smaller time frame this da
FREE

Automatically plots Fibo levels, based on the High & Low prices from the specified time frame Multiple bars may be united: e.g. you can get a Fibo based on the 10-days Highs and Lows My #1 Utility : 65+ features, including this indicator | Contact me for any questions | MT5 version Helps to see potential reversal levels; Patterns formed at the Fibo levels tend to be stronger; Significantly reduces the time spent on manual plotting ; Settings: Timeframe to calculate the base High & Low p

''A professional trader is a greedy trader: he buys at lows and sells at highs with minimal risks and high returns,,
Pips Slayer is developed exactly for such trading approach . It's a universal indicator for tracking reversals and uses price action patterns, discrepancy of custom indicators and a multi-layered formula for identifying reversal structures. The indicator is very easy to use; it only shows arrows where is recommended to buy or sell and recommended take-profit and stop-loss prices
FREE

The indicator defines a trading corridor, a flat market, and corrections.
Allows you to compare the significance of different flat and trend areas (by time of existence and by volatility). This makes it possible to assess the market cycle and its mood at a glance.
That is, how long does the flat last on average, and how long is the trend and what kind of volatility they have in points.
As a rule, the longer the flat lasts, the more likely it is to accumulate the potential for a strong movem

This indicator serves the purpose of visually representing the Donchian channel on your trading chart. The Donchian channel is a straightforward technical tool used to depict the range between the highest high and the lowest low over a specified period. This indicator enhances the visual analysis of price movements, offering insights into potential breakout and trend continuation points. The Donchian channel can be applied to both the current time frame and a higher time frame, should you choose
FREE
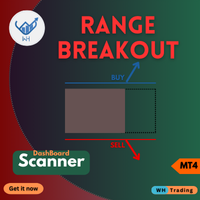
Unlock a new dimension of trading with our cutting-edge MQL4 indicator, Range BreakOut MT4
This powerful tool is designed to identify and capitalize on price movements as they break out of established ranges,
providing you with the precision and confidence needed to thrive in the dynamic world of financial markets.
MT5 Version : WH Range BreakOut MT5
Features:
Accurate Range Detection. Multi Symbols and multi TimeFrames (Scanner). Real-Time Breakout Signals. Customizable Parameters. Risk

The ICT Asian Range Indicator is a powerful tool designed to help traders identify key market structures and liquidity zones based on the ICT Asian Range Trading Strategy. It marks the highest and lowest price levels of the Asian session (7 PM to midnight New York time) and provides critical insights into market movements for the following trading sessions. This indicator enhances trade accuracy by highlighting liquidity sweeps, and Fair Value Gaps (FVGs), making it an essential tool for ICT tra

A classical MACD indicator where both the MACD line and the Signal line are displayed as lines. The difference between MACD and Signal line is displayed as a histogram. A user can change the color and thickness of histogram lines. So, histogram lines can be grouped into four different groups: positive ascending, positive descending, negative descending and negative ascending. Multi-currency Dashboard for the indicator is available https://www.mql5.com/en/market/product/72354
FREE

Round Numbers Levels indicator for MT4 Round Numbers indicator is a simple but useful indicator to draw 00 and 50 price levels in your chart.
These levels act as supports and resistances, and therefore should be taken into account when trading.
These levels can be used as profit targets or entry points.
Inputs of the indicator are:
TGridColor00: color to be used for xx00 levels GridStyle00: line style to be used for xx00 levels GridWidth00: line width to be used for xx00 levels GridColor50:
FREE
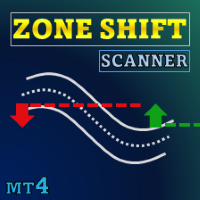
Special offer : ALL TOOLS , just $35 each! New tools will be $30 for the first week or the first 3 purchases ! Trading Tools Channel on MQL5 : Join my MQL5 channel to update the latest news from me Zone Shift is a trend identification tool that uses EMA/HMA-based bands to detect trend shifts and display key reaction levels. It shows trend direction via candle colors and marks important retests with visual cues to help users track momentum. See more MT5 version at: Zone Shift MT5 S

The indicator has combined 5 popular strategies. Draws an arrow after confirming a signal for the selected strategy. There are signal alerts. Doesn't redraw its values. I recommend watching my advisor - Night Zen EA
5 strategies. The main line crosses the signal line. The main line crosses the signal line in the oversold (for buy) / overbought (for sell) zones. The main line enters the oversold (for sell) / overbought (for buy) zones . The main line comes out of the oversold (for buy ) / over
FREE

VWAP and Moving Average A combination of Supertrend and Moving Average to create a converging trade setup Input parameters: signal mode: set it to true if you want to plug it into STAT (Signal Tester and Trader) arrow shift: distance between fast EMA line to arrow on chart turn on moving average signal for converging setup VWAP period MA period MA averaging method MA pricing method upper level limit ( VWAP ) lower level limit ( VWAP ) You can find the best setting for 4 hour EURUSD on this v
FREE

Scalping indicator. It takes into account volatility, price movement in the local interval and the direction of the current trend. Recommended timeframe - M5. Advantages: Low volatility when a signal appears ensures minimal movement against an open position. The indicator does not redraw its signals. There are alert signals. It is a great tool for day trading.
Settings: Name Description Period Indicator period Range of each bar in the period (pp.) The maximum size of each candle in the indicato
FREE
Stop missing powerful breakout opportunities! The Advanced Breakout Scanner Dashboard is a professional-grade trading tool that monitors up to 28 currency pairs in real-time, scanning for ten unique high-probability breakout strategies simultaneously. Attach it to a single chart to get a complete overview of the entire market, instantly identifying the best trading setups as they happen. This is not just a signal indicator; it's a complete trading dashboard designed for serious breakout traders.

Other profitable programs https://www.mql5.com/en/users/ifyjava/seller The Solarwind No Repaint is a technical oscillator that applies the Fisher Transform to normalized price data, creating a histogram-based indicator that identifies potential market turning points. This indicator converts price movements into a Gaussian normal distribution, making cyclical patterns and momentum shifts more visible to traders. How It Works The indicator processes price data through several computational step
FREE

The Supertrend Indicator is a popular technical analysis tool designed to assist traders in identifying market trends. The indicator combines the average true range (ATR) with a multiplier to calculate its value. This value is then added to or subtracted from the asset’s closing price to plot the supertrend line. The Supertrend Indicator can help identify trends, manage risk, and confirm market tendencies. The indicator is limited by its lagging nature, is not very flexible, and can send up fal
FREE
Introducing the Draw On Chart Indicator: Unleash Your Creativity on Charts! Are you tired of struggling to annotate your trading charts, trying to make sense of your analysis or communicate your ideas effectively? Look no further! We are thrilled to present the Draw On Chart Indicator, a groundbreaking tool that allows you to effortlessly draw and annotate directly on your charts with just a few clicks or strokes of your pen. Our innovative Draw On Chart Indicator is designed to enhance your cha
FREE

Buy Sell Magic AI – Dynamic Trend Line & Bollinger Bands for MT4 Buy Sell Magic AI is a professional indicator for MetaTrader 4 that combines the power of Bollinger Bands with a dynamic central midline that acts as a real-time trend line . It delivers clear entry signals, visual trend confirmation, and automatic Stop Loss placement—plus a built-in candle timer for precise trade timing. My indicators for free. I only ask that leave your feedback to help me improve them or as a thank you. Have
FREE

This is an indicator for Quasimodo or Over and Under pattern. It automatically finds the swing points and can even place virtual trades with stop loss and take profit. Press the "Optimize" button to automatically find the most effective settings. The pattern consists of four legs A,B,C,D as shown in the pictures. Open and close prices of the virtual trades are Bid price but the statistics in Display Panel take current spread into account. Its parameters are explained below. Buffer - Pips distanc
FREE
The Multi-Timeframe ATR is an enhanced version of the standard ATR indicator for MetaTrader 4 that allows traders to view volatility from any timeframe directly on their current chart. Unlike the default ATR, which only plots data from the active chart timeframe, this version lets you select a higher or lower timeframe (for example, display the Daily ATR while analysing a 15-minute chart ). How It Works The indicator retrieves ATR values from the timeframe you specify — such as H1, H4, or D1 —
FREE

This indicator lets you easily mark the daily open levels on a chart with several possibilities of customization. For many trading strategies, the daily open level is an important level to base trading decisions on. That is why I chose to create this indicator that is designed to assist you with trading these strategies, as well as further optimizing them and getting a general understanding of the markets movements. With this tools help, you can easily take a look at the previous price action ar
FREE

Looking for entry points along the local trend without repaint! Arrows indicate entry points. Based on classic indicators. The indicator is easy to use. Settings Наименование Описание Frequency factor Signal frequency. The less, the more often.
This affects the quality.
Recommendations Recommended for use on major currency pairs. Timeframe from m5, m15, m30 Subscribe to my telegram channel, where we discuss intraday trading, ideas, indicators, etc., a link in my profile contacts.
FREE

his indicator automatically identifies key support and resistance levels by analyzing volume patterns. Unlike traditional S/R tools that rely only on price, Volume S/R finds levels where the market truly reacted. DETECTION LOGIC: - High Volume Zones: Price levels where strong buying/selling occurred - Low Volume Zones: Areas of weak interest - potential breakout or reversal zones
SMART FILTERING: - Nearby levels are automatically merged to avoid chart clutter - Maximum levels limit keeps yo
FREE
This automated VOLUME SCALPING INDICATOR can be utilized to manage trades and identify potential areas of support and resistance for both buying and selling. It is designed to identify zones for Sell/Buy trades based on the volume analysis and can be effectively used in conjunction with other indicators, such as order block indicators, and more. Currently designed for MT4, it will later be adapted to function on MT5. We also offer the opportunity to customize the robot according to your trading
FREE

Overview:
The Coloured Parabolic SAR Indicator is a visually enhanced trading tool designed to make trend-following and trade identification easier. This customizable indicator provides clear visual cues with color-coded signals for bullish (buy) and bearish (sell) trends directly on your MT4 chart. Key Features: Color-Coded Signals : Lime green "o" symbol for Buy signals. Red "o" symbol for Sell signals. Customizable Inputs : Adjustable Step and Maximum parameters to fine-tune the Parabolic SA
FREE

Please check the " What's new " tab regularly for a complete and up-to-date list of all improvements + parameters. FREE indicator for my trading utility Take a Break . This indicator allows you to manage multiple other EAs with just one Take a Break EA instance. Simply specify the corresponding Chart Group in the indicator(s) and Take a Break EA settings and you are good to go.
Setup examples (Indicator + EA)
As a prerequisite, add the URL https://trading.custom-solutions.it to the list of al
FREE

Is This tools use able for free in Forex market ?
Accuracy Meter is useful and also free product, i made this product for free because i believe that any seller must have some good products for free not just release bad products as free tools.
What does Green koala logo mean :
Means Free Products , i ll release my free products by green koala logo, so when you see green koala, it means new free products is access able for you.
Accuracy Meter Introduction :
Accuracy Meter is powerful tool to
FREE
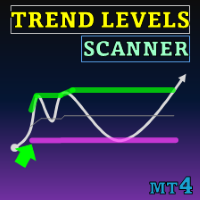
Special offer : ALL TOOLS , just $35 each! New tools will be $30 for the first week or the first 3 purchases ! Trading Tools Channel on MQL5 : Join my MQL5 channel to update the latest news from me The Trend Levels indicator is meticulously crafted to pinpoint critical trend levels—High, Mid, and Low—during market movements. With real-time calculations based on the highest, lowest, and mid-level values over a customizable lookback period, this tool provides traders with a structure
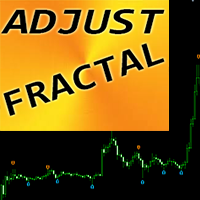
"Adjustable Fractals" - is an advanced version of fractal indicator, very useful trading tool! As we know Standard fractals mt4 indicator does not have settings at all - this is very inconvenient for traders. Adjustable Fractals has resolved that issue - it has all necessary settings: Adjustable period of indicator (recommended values - above 7). Adjustable distance from Highs/Lows of price. Adjustable design o f fractal arrows. Indicator has built-in Mobile and PC alerts.
Click here

[V 2.00] MTF NRPA 5 Moving Average RTD has been released! ( New sub buttons 2025 ) Non repaint arrow real time dashboard. If you are looking for the best moving average indicator then you are on the right page. Generally people will install two moving averages because the intersection of the two moving averages (the crossover) will determine the direction of the next price trend. If the fast moving average intersects with the slow moving average and fast > slow then the trend is up. Conversely,

The Pivot Point indicator automatically calculates and displays the pivot point line and support and resistance levels. Pivot can be calculated according to the Classic, Floor, Fibonacci, Woodie, Camarilla or DeMark formula. It is also possible to select the period for calculating the indicator. A trader can choose from daily, weekly, monthly, or user-defined periods.
Types of pivots Classic Floor Fibonacci Woodie Camarilla DeMark
Main features The indicator shows the current and historic
FREE

The indicator synchronizes eight types of markings on several charts of one trading instrument.
This indicator is convenient to use in conjunction with "Multichart Dashboard" or other similar assistant that allows you to work with several charts at the same time.
"Multichart Dashboard" can be found under the link on my youtube channel.
Settings:
enable vertical line synchronization
enable horizontal line synchronization
enable Trend Line synchronization
enabling Fibonacci Retracement synchron
FREE
Smart Liquidity Zones (SLZ) — Your All‑in‑One SMC/ICT Radar for MT4
Why SLZ? Tired of squinting at charts trying to spot liquidity grabs, break‑of‑structure candles and Fair Value Gaps before the smart‑money sharks do? SLZ turns your chart into a tactical map —drawing every high‑probability zone and screaming (politely) when price dives in. Core Edge Powered by a rule‑set distilled from Smart Money Concepts (SMC) and ICT mentorship material, SLZ auto‑marks: Component What it shows Why it
FREE
The MetaTrader Market offers a convenient and secure venue to buy applications for the MetaTrader platform. Download free demo versions of Expert Advisors and indicators right from your terminal for testing in the Strategy Tester.
Test applications in different modes to monitor the performance and make a payment for the product you want using the MQL5.community Payment System.
You are missing trading opportunities:
- Free trading apps
- Over 8,000 signals for copying
- Economic news for exploring financial markets
Registration
Log in
If you do not have an account, please register
Allow the use of cookies to log in to the MQL5.com website.
Please enable the necessary setting in your browser, otherwise you will not be able to log in.