Mini Charts
- Indicators
- Sergey Efimenko
- Version: 1.3
- Updated: 13 March 2021
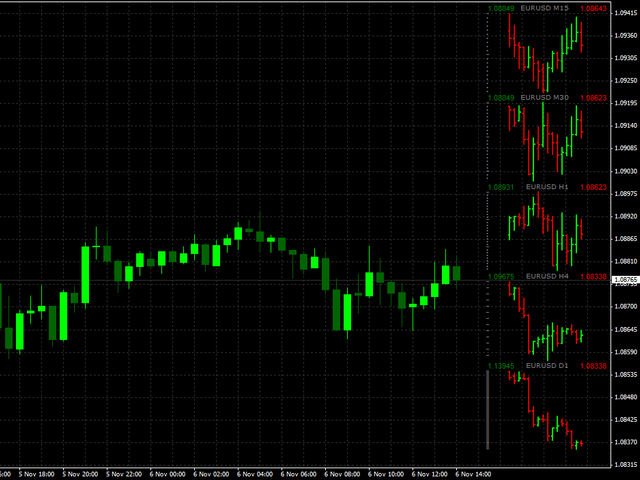
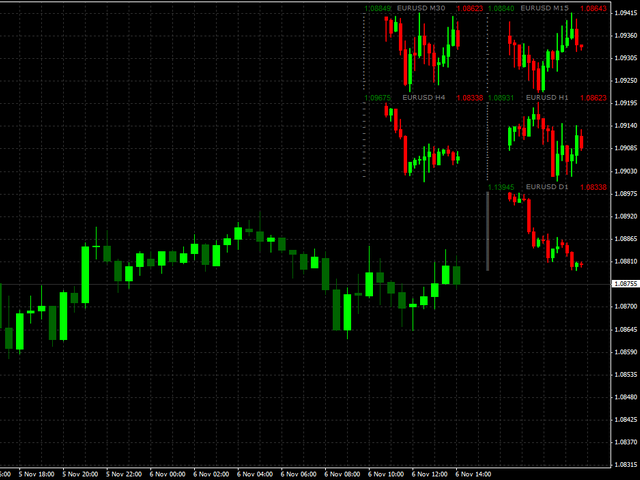
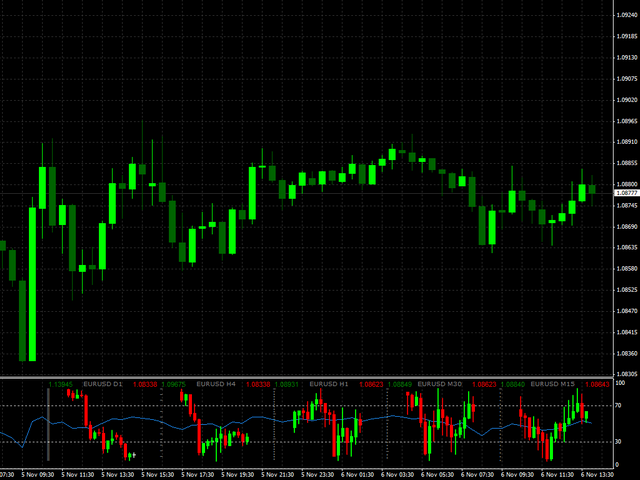
The indicator displays minimized charts of any symbol from any timeframe. The maximum number of displayed charts is 28. The charts can be located both in the main and bottom window. Two display modes: candles and bars. Amount of displayed data (bars and candles) and chart sizes are adjustable.
Parameters:- Corner - display start corner (selected from the list)
- CandleMode - display mode: true - candles, false - bars
- ShowLastBid - enable/disable the last price display
- LastBidShiftX - last price line shift by X axis (all shifts are used for more accurate display)
- LastBidShiftY - last price line shift by Y axis
- ColorLB - last price line color
- BarsToDisplay - amount of displayed bars/candles without the current one
- LineColor - line color (Doji candle)
- BullColor - bullish bar/candle color
- BearColor - bearish bar/candle color
- ScaleColor - scale color
- WindowNumber - number of a chart display window (0 - main window)
- CornerX - indent from a corner by X axis
- CornerY - indent from a corner by Y axis
- ChartWidth - width of each chart window
- ChartHeight - height of each chart window
- ShowPriceHL - enable/disable High/Low display
- PriceFontSizeHL - displayed High/Low font size
- PriceFontNameHL - displayed High/Low font name
- HiPriceLabelX - shift by X axis for High
- HiPriceLabelY - shift by Y axis for High
- HiPriceLabelClr - High price value color
- LoPriceLabelX - shift by X axis for Low
- LoPriceLabelY - shift by Y axis for Low
- LoPriceLabelClr - Low price value color
- ChartNameX - shift by X axis for symbol and timeframe value
- ChartNameY - shift by Y axis for symbol and timeframe value
- ChartNameFontName - symbol and timeframe value font name
- ChartNameFontSize - symbol and timeframe value font size
- ChartNameFontColor - symbol and timeframe value color
- ScaleStartY - shift by Y axis for the scale
- BarSpacingX - spacing between the charts
- Columns - amount of columns when placing charts in the window
- SpacingColumns - spacing between the columns
- SpacingRows - spacing between the rows
- Symbol01 - symbol name; leave blank to use the current one
- TimeFrame01 - display period, select "CURRENT" for an empty value. All charts with any value different from CURRENT are displayed


Advanced, overviewing the chart symbol I think is a must. Thank you!