MetaTrader 4용 기술 지표 - 12

The indicator builds a Renko chart in the sub window for the current symbol. The bars are formed from live data and the desired bar size can be set in the inputs tab. Most importantly, because the Renko chart only uses price to construct bars and ignores time, the indicator can be applied to any time frame and same results can be achieved. Recommended usage
As Renko charts are famous for eliminating noise so traders can use this tool to see clear picture of the trend to help their analysis, entr
FREE
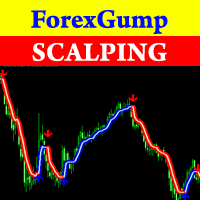
Attention! Friends, since there have been many scammers on the Internet recently selling indicators called ForexGump, we decided to warn you that only on our page is the LICENSE AUTHOR'S VERSION of the INDICATOR sold! We do not sell this indicator on other sites at a price lower than this! All indicators are sold cheaper - fakes! And even more often sold demo versions that stop working in a week! Therefore, in order not to risk your money, buy this indicator only on this site! Forex Gump Scalpin
HTF Power of Three (ICT) - MT4 Indicator - Version 1.1 Overview The HTF Power of Three indicator is a professional implementation of the Inner Circle Trader's (ICT) Power of Three concept, inspired by Larry Williams. This indicator visualizes higher timeframe (HTF) candle development in real-time on any lower timeframe chart, making it an essential tool for ICT traders who study institutional price movement patterns. What is Power of Three (PO3)? Power of Three represents a three-staged Sma
ALL MOVING AVERAGES: 다양한 전략을 위한 궁극의 사용자 정의 지표 ALL MOVING AVERAGES 사용자 정의 지표는 31가지가 넘는 가장 인기 있는 이동 평균 을 인상적으로 모아놓은 심층 기술 분석을 위한 필수 도구입니다. 숙련된 트레이더와 초보자 모두를 위해 설계된 이 지표는 비교할 수 없는 유연성을 제공하여 광범위한 거래 전략에 맞게 이동 평균을 완벽하게 조정할 수 있습니다. 기간 및 다양한 가격 계산 유형을 포함한 포괄적인 입력 매개변수 범위를 통해 거래 스타일과 분석 요구 사항에 맞게 지표를 쉽게 조정할 수 있습니다. 주요 기능 및 이점: 광범위한 이동 평균 라이브러리: 고전적인 단순 이동 평균(SMA)부터 Hull 이동 평균 및 제로-지연 지수 이동 평균과 같은 고급 옵션에 이르기까지 31가지가 넘는 방대한 이동 평균 중에서 선택하여 모든 도구를 마음껏 사용할 수 있습니다. 높은 사용자 정의 가능성: 기간을 조정하고 표준 종가, 시가, 고가, 저가 및
FREE

CIS is designed for trading a basket of correlating currencies, as well as single instruments: indicators
VSA indicator which draws arrows (does not redraw). Its signals indicate the price reversal on a calm market or decrease of the rise or fall rate during strong movements. Works fine in the flats. As the indicator uses volumes in its calculations, be careful during evenings and night times, when there are very small volumes. It is recommended to be used only on multiple currencies or at lea

This indicator allows to analyze a chart using the rule of supple and demand. You will see zones of sales and purchases and determine the most profitable points to open positions. The indicator is based on the principle of market fractality. Chart zones show places where a strong buyer or seller has made the price reverse and change its direction. The indicator has several types of zones calculation. Color and type of zones displaying are set as desired. The zone width can be displayed in pips.
FREE

The Heikin Ashi indicator is our version of the Heikin Ashi chart. Unlike competitor products, this indicator offers extensive options for calculating Heikin Ashi candles. In addition, it can be displayed as a classic or smoothed version.
The indicator can calculate Heikin Ashi with moving average by four methods: SMA - Simple Moving Average SMMA - Smoothed Moving Average EMA - Exponential Moving Average LWMA - Linear Weighted Moving Average
Main features The indicator shows Heikin As
FREE

Tipu Heikin-Ashi Panel is the modified version of the original Heiken Ashi indicator published by MetaQuotes here . A professional version of this indicator is available here .
Features An easy to use Panel that shows the Heiken Ashi trend of selected timeframe. Customizable Buy/Sell alerts, push alerts, email alerts, or visual on-screen alerts. Customizable Panel. The panel can be moved to any place on the chart or minimized to allow more space. Heikin means "the average", and Ashi means "foot
FREE
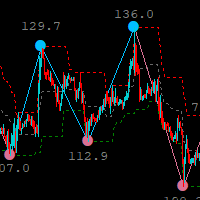
지그재그 표시기를 기반으로 하는 지그재그 고저 채널 표시기는 거래자에게 추세 변화를 알리는 도구이며 매우 유용합니다.
현재 추세의 변화에 대한 조기 경고를 제공하므로 지표에는 더 높거나 낮은 시간대를 거래할 수 있는 다중 시간대 옵션이 있습니다.
현재 시간대의 채널, 이 표시기는 시스템/전략에 추가되며 거래를 위해 독립형으로 사용할 수 있지만 사용을 권장합니다.
그것은 당신의 무기고에 추가됩니다.
=========================== =========================== =========================== ======================================== ===== =
FREE

Early Bird Breakout: Capture the Power of the London Open Are you tired of trading in choppy, unpredictable markets? The Early Bird Breakout is your essential tool for exploiting one of the most reliable and explosive patterns in Forex: the Asia Session Breakout . This smart indicator automatically identifies the crucial price levels set during the quiet Asian hours and alerts you the moment the major volume of the London/European session ignites a trend! Key Features and Market Edge Precision
FREE
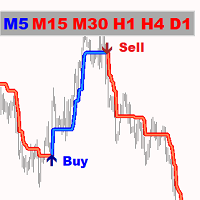
골드 포인터는 최고의 추세 지표입니다. 지표의 고유한 알고리즘은 기술적 및 수학적 분석 요소를 고려하여 자산 가격의 움직임을 분석하고 가장 수익성이 높은 진입 지점을 결정하고 매수 또는 매도 주문을 개시하라는 신호를 제공합니다.
최고의 보조지표 신호:
- 매도 = 빨간색 추세선 + 빨간색 TF 표시기 + 같은 방향의 노란색 신호 화살표. - 매수 = 파란색 추세선 + 파란색 TF 인디케이터 + 같은 방향의 아쿠아 신호 화살표.
인디케이터의 장점:
1. 표시기는 높은 정확도로 신호를 생성합니다. 2. 표시기의 확인 된 신호는 오디오 경고 (경고 및 메시지)로 신호 (화살표)를 확인한 후에도 사라지지 않고 다시 그려지지 않습니다. 3. 모든 브로커의 메타트레이더 4 거래 플랫폼에서 거래할 수 있습니다. 4. 모든 자산(통화, 금속, 암호화폐, 주식, 지수 등)을 거래할 수 있습니다. 5. 모든 차트주기(M5-M15 스캘핑 및 트레이딩/M30-N1 중기 트레이딩/H4-D1 장기
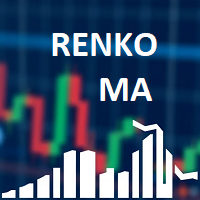
Renko Chart with Moving Average. Classic Renko charts idea. It is protted on main chart and Moving Average can be applied. Prices for bars are used from a lower timeframe. Parameters: BarsBack - how many bars of lower timeframe to use. If value is zero than it will use all available bars. LTF - lower timeframe. BrickSize - Renko bar in points. BullishColor - color for bull candle. BearishColor - color for bear candle. HideLineChart - if this value is true the line chart when be hidden when sele
FREE

Round Numbers Levels indicator for MT4 Round Numbers indicator is a simple but useful indicator to draw 00 and 50 price levels in your chart.
These levels act as supports and resistances, and therefore should be taken into account when trading.
These levels can be used as profit targets or entry points.
Inputs of the indicator are:
TGridColor00: color to be used for xx00 levels GridStyle00: line style to be used for xx00 levels GridWidth00: line width to be used for xx00 levels GridColor50:
FREE

Gold Channel is a volatility-based indicator, developed with a specific timing algorithm for the XAUUSD pair, which consists of finding possible corrections in the market.
This indicator shows two outer lines, an inner line (retracement line) and an arrow sign, where the theory of the channel is to help identify overbought and oversold conditions in the market.
The market price will generally fall between the boundaries of the channel. If prices touch or move outside the channel it is a tradi

The BB Reversal Arrows technical trading system has been developed to predict reverse points for making retail decisions.
The current market situation is analyzed by the indicator and structured for several criteria: the expectation of reversal moments, potential turning points, purchase and sale signals.
The indicator does not contain excess information, has a visual understandable interface, allowing traders to make reasonable decisions.
All arrows appear to close the candle, without redrawin
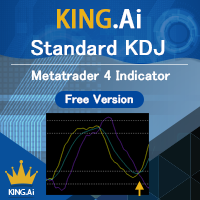
The standard KDJ indicator is presented by KING.Ai. This indicator were built base on the the theory of KDJ . KDJ is a very effective and useful strategy to trade especially in swing trading. Method to apply (please also refer to the graphic): 80/20 rule: Price from bottom to top 20 to 80. And price from top to bottom 80 to 20. Both is enter market signal. Indicator period: The indicator is made by period 9,3,3 KING.Ai Forex trader believe that such strategy must complement with other indicato
FREE
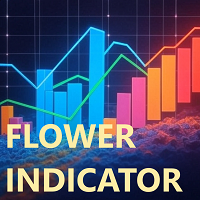
플라워 지표는 주로 추세를 파악하고 스캘핑 또는 일중 거래 전략을 지원하는 데 사용되는 기술 분석 도구입니다.
플라워 지표는 기술적 분석 및 가격 변동 분석을 기반으로 하는 신호 추세 지표입니다. 파란색 꽃은 상승 추세를, 빨간색 꽃은 하락 추세를 나타내는 등 다양한 색상의 꽃을 사용하여 추세를 시각적으로 보여줍니다.
각 레벨은 지지선과 저항선 역할을 할 수 있습니다(+/- 200 레벨과 차트에 나타나는 점을 주의 깊게 살펴보세요).
과매수/과매도 고정 레벨이나 그에 따른 밴드, 또는 둘 다, 또는 둘 중 하나를 돌파할 때 점이 나타나도록 설정할 수 있습니다.
이 지표는 시장의 잠재적 반전을 감지하고 매집/분산 구간을 파악합니다. 모든 상품 및 시간대와 호환되며, 매개변수는 필요에 따라 조정할 수 있습니다. 각 레벨은 지지선과 저항선 역할을 할 수 있습니다.
FREE

The MACD 2 Line Indicator is a powerful, upgraded version of the classic Moving Average Convergence Divergence (MACD) indicator.
This tool is the embodiment of versatility and functionality, capable of delivering comprehensive market insights to both beginner and advanced traders. The MACD 2 Line Indicator for MQL4 offers a dynamic perspective of market momentum and direction, through clear, visually compelling charts and real-time analysis. Metatrader5 Version | How-to Install Product | How-to
FREE

Bermaui Bands(BB)는 범위 및 추세 가격 움직임 사이를 필터링하는 데 도움이 되는 기술 분석 도구입니다. 이 지표의 이면에 있는 아이디어는 다음 단계에서 설명할 수 있습니다. 표준 편차를 0과 100 사이에서 이동하는 오실레이터로 계산합니다. 나는 그것을 Bermaui Deviation 퍼센트(BD %)라고 명명하겠습니다. "BD %"가 0에 가까우면 변동성이 극심합니다. 또한 "BD %"가 100에 가까우면 변동성이 매우 낮습니다. 높은 변동성은 추세 시장에 대한 큰 가능성을 의미하고 낮은 변동성은 횡보 또는 범위 시장을 의미합니다. 중간선은 표준편차가 SMA에 따라 계산되기 때문에 단순 이동 평균(SMA)입니다. Upper Bermaui Band를 얻으려면 계산에서 동일한 수의 막대를 사용하여 단순 이동 평균에 "BD %"를 추가하십시오. The Lower Bermaui Bands를 얻으려면 계산에서 동일한 수의 막대가 있는 단순 이동 평균에서 "BD %"를 빼십시오
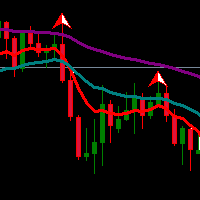
Exponential Moving Average (EMA) is an indicator that often be used by traders. Combination of two or three EMA indicators often applied to determine trend direction. Multiple EMA combined with fractals or oscillator indicator to detect overbought/oversold and divergence point also great to do in trading system.
If you like EMA indicator and want to get better indicator, highly recommended using EMA SuperTrend Strategy Indicator if you want to get better result in here:
https://www.mql5.com/en
FREE

The Turtle Trading Indicator implements the original Dennis Richards and Bill Eckhart trading system, commonly known as The Turtle Trader. This trend following system relies on breakouts of historical highs and lows to take and close trades: it is the complete opposite to the "buy low and sell high" approach. The main rule is "Trade an N-day breakout and take profits when an M-day high or low is breached (N must me above M)". [ Installation Guide | Update Guide | Troubleshooting | FAQ | All Prod
FREE

First RSI level indicator analyzes and displays the level, at which the first crossing of the standard RSI maximum or minimum value took place for the subsequent definition of strong trends. The indicator allows you to track the beginning of a trend that does not follow the signals of the standard RSI trading strategy, for example, when the price rushes downwards after reaching an oversold level instead of reversing. In this case, we have to conclude that a strong trend is underway and the next
FREE
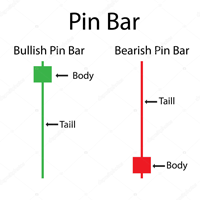
Pin bar pattern is characterized by a long upper or lower wick with a small body relative to the size of the wick with little to no lower or upper shadows. Pin bars are not to be traded in isolation , but need to be considered within the larger context of the chart analysis. A pin bar entry signal, in a trending market, can offer a very high-probability entry and a good risk to reward scenario.
Inputs MinimumTailPips- Minimum size of Tail in pips; TailBodyCandle- means how many times Tail grea
FREE
Keltner Signals Pro: Trade Smarter, Earn More! Boost your trading accuracy and eliminate false signals with Keltner Signals Pro – the advanced yet intuitive indicator designed for serious traders seeking consistent profits! Tired of misleading trading signals? Keltner Signals Pro masterfully combines the power of Keltner Channels for identifying crucial price breakouts with an unbeatable EMA200 Trend Filter . The result? More accurate, reliable, and actionable buy and sell signals that you can t
FREE

Grebenka MQL4 - помощник для разметки графика для платформы MetaTrader 4.
Функционал: 1. позволяет непрерывно рисовать линии ZigZag в ручном режиме, используя клики мышкой. 2. позволяет включать режим, при котором любая трендовая линия с которой в данный момент проводится манипуляция, выравнивается по горизонтали.
Горячие клавиши: [Z] - включение/выключение режима рисования линий ZigZag вручную [X] - включение/выключение режима горизонтальной трендовой линии [C] - быстрая смена цвета линий Z
FREE
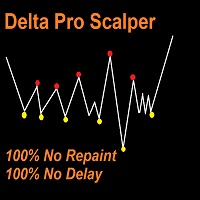
Delta Pro Scalper - Your Ultimate Trend Trading Solution, Delta Pro Scalper is a TREND indicator that automatically analyzes the market and provides information about the trend without redrawing or delay.
The indicator uses candlestick OHLC data and analyzing them to determine up trend or down trend, You MUST wait till closing candle, once the dot appear the next open candle you can open buy or sell position.
Red Dot = Bearish Trend (Open SELL)
Yellow Dot = Bullish Trend (Open BUY)
Here's the f

RSI indicator with signal lines, at the intersection of which a corresponding notification will be issued, which can be in the form of a normal alert, or in the form of a user sound file.
The indicator also has the function of sending push-notifications and email notifications at the intersection of these levels.
The values of the levels can be set independently in the indicator settings, and, if desired, they can be changed and configured directly in the indicator window. To check the oper

Pivot Flow Pro - Trend-structure market direction using pivot highs and lows to form a dynamic bull/bear band.
Non-repainting trend-structure indicator that identifies market direction using averaged pivot highs and lows to form a dynamic bull/bear band, with signals confirmed strictly on closed candles. When price closes above or below the adaptive pivot levels, the indicator shifts trend and prints a flip arrow, while continuation dots highlight valid breakout points in the direction of the c

Introduction This indicator detects volume spread patterns for buy and sell opportunity. The patterns include demand and supply patterns. You might use each pattern for trading. However, these patterns are best used to detect the demand zone (=accumulation area) and supply zone (=distribution area). Demand pattern indicates generally potential buying opportunity. Supply pattern indicates generally potential selling opportunity. These are the underlying patterns rather than direct price action. T
iPump 표시기는 세 가지 범주의 표시기의 장점을 결합한 다목적 표시기입니다.
여러 TF에서 동시 추세 감지 저항 및 지원 영역 정의 과매수 및 과매도 구역 결정 표시기 기능:
추세 정의 이 기능은 현재 시장 방향을 객관적으로 평가하고 주관성을 피하려는 모든 거래자에게 필요합니다. 순식간에 가장 중요한 시간대의 추세 방향을 비교할 수 있으며 이는 명확하고 직관적입니다.
지지 및 저항 수준 결정 iPump 표시기를 사용하여 몇 초 이내에 자산에 대한 잠재적인 가격 장벽을 평가할 수 있습니다.
또한 표시기는 앞에 있는 레벨 유형을 알려줍니다.
테스트 레벨(저항/지지) 반전 수준 약한 수준 테스트되지 않은 수준 과매수 및 과매도 구역 결정 이 작업의 경우 표시기에는 자산의 현재 상태를 표시하는 지연되지 않고 다시 그리지 않는 신호 발진기가 있으며 이 데이터를 기반으로 다음을 수행할 수 있습니다.
구매가 흥미로울 때 영역을 정확히 알고 있습니다. 자산을 판매하는 것이 흥미로울
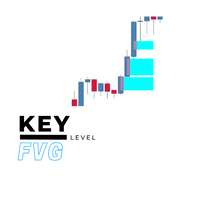
Key Level FVG Tired of manually scanning your charts for Fair Value Gaps (FVGs)? The Key Level FVG is a powerful and easy-to-use tool designed to automatically detect and display these critical price imbalances for you. Based on popular smart money concepts, this indicator highlights high-probability areas where the price is likely to return, providing you with clear and actionable trading zones. Whether you're a seasoned price action trader or just starting with FVG analysis, this indicator wi
FREE

The indicator of a Professional Trader is an arrow indicator for predicting the direction of price movement. I have been working on this indicator since 2014.
You can use this indicator as your main indicator, use its entry signals, and use it as your only indicator to find entry points.
About the product: Recommended TF [H4-D1-W1] . The indicator predicts the direction of the next candle. Fits a variety of tools; Flexibility in settings for different instruments and intervals through the MO
FREE

TG MTF MA MT5 is designed to display a multi-timeframe moving average (MA) on any chart timeframe while allowing users to specify and view the MA values from a particular timeframe across all timeframes. This functionality enables users to focus on the moving average of a specific timeframe without switching charts. By isolating the moving average values of a specific timeframe across all timeframes, users can gain insights into the trend dynamics and potential trading opp
FREE

Tipu Trend is a non-lag, non-repaint, smart indicator, that shows the trend of selected time frames.
Features Customizable Buy/Sell alerts, push alerts, email alerts, or visual on-screen alerts. As easy to trade indicator that smooths the noise in the price action. Highlights ranging markets. Add Tipu Panel (found here ) and unlock the following additional features. An easy to use Panel that shows the trend + signal of the selected time frames. Customizable Panel. The panel can be moved to any
FREE
이중 라인 신호, 3단계 시스템, 멀티 타임프레임 지원, 사용자 정의 가능한 시각적 신호 및 고도로 구성 가능한 알림 시스템을 갖춘 고급 스토캐스틱 오실레이터.
스토캐스틱 오실레이터란? 스토캐스틱 오실레이터는 특정 기간 동안 증권의 종가를 가격 범위와 비교하는 모멘텀 지표입니다. 이 지표는 두 개의 라인으로 구성됩니다: %K (메인 라인)와 %D (시그널 라인, %K의 이동 평균). 스토캐스틱은 0에서 100 사이에서 진동합니다. 높은 수치는 과매수 조건을 나타내고, 낮은 수치는 과매도 조건을 나타냅니다. %K와 %D 라인 간의 교차 및 레벨 경계를 통과하는 움직임은 일반적으로 거래 신호로 사용됩니다. 기능: 3단계 시스템(높음, 중간, 낮음)을 갖춘 이중 라인 스토캐스틱(%K 및 %D) 3개의 독립적인 구성 가능한 신호 버퍼가 있는 시각적 신호 마커(화살표, 수직선) 고급 신호 감지: 방향 변화, 라인 교차, 레벨 교차, 두 라인의 피크/밸리 시간 범위 필터링이 있는 구성 가능
FREE

Necessary for traders: tools and indicators Waves automatically calculate indicators, channel trend trading Perfect trend-wave automatic calculation channel calculation , MT4 Perfect trend-wave automatic calculation channel calculation , MT5 Local Trading copying Easy And Fast Copy , MT4 Easy And Fast Copy , MT5 Local Trading copying For DEMO Easy And Fast Copy , MT4 DEMO Easy And Fast Copy , MT5 DEMO "Cooperative QQ:556024" "Cooperation wechat:556024" "Cooperative email:556024@qq.com" Strong
FREE

After working during many months, with the help of Neural Networks, we have perfected the ultimate tool you are going to need for identifying key price levels (Supports and Resistances) and Supply and Demand zones. Perfectly suitable to trigger your trades, set up your future actions, decide your Take Profit and Stop Loss levels, and confirm the market direction. Price will always move between those levels, bouncing or breaking; from one zone to another, all the remaining movements are just mark

The first currency based indicator to draw a distinction between map and strength. The map shows the currencies in terms of oversold/overbought levels and gives the direction of travel. The currency strength calculates and shows the strength of that move. Alerts are included for changes in currency direction on the map (confirmed over two bars) and also when the strength reached the appropriate level. The currency map is useful for finding currency pairs to trade and in which direction. Look fo
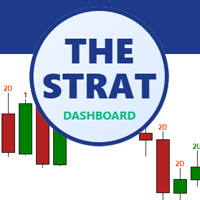
The Strat Dashboard - Rob Smith의 Strat 전략용 다중 심볼 패턴 스캐너 실시간 다중 심볼 Strat 분석으로 트레이딩을 혁신하세요 The Strat Dashboard는 Rob Smith의 유명한 “Strat” 트레이딩 방법론을 사용하는 트레이더를 위해 특별히 설계된 강력하고 전문적인 인디케이터입니다.
여러 종목을 여러 타임프레임에서 동시에 모니터링하고, 고확률 패턴을 즉시 식별하며, 중요한 매매 기회를 놓치지 마세요. MT5 Version :- https://www.mql5.com/en/market/product/153384/
“The Strat”이란 무엇인가? The Strat은 Rob Smith가 개발한 혁신적인 프라이스 액션 기반 트레이딩 전략으로, 캔들스틱 패턴과 타임프레임 간의 관계를 분석합니다.
각 캔들은 이전 캔들과의 관계에 따라 번호로 분류되어, 모든 시장, 모든 시간대 에 적용 가능한 보편적인 가격 해석 언어를 제공합니다.
This is a combine that combines the ATR, Candle Timer, Watermark indicators and a tool for working with graphical objects, which allows you to reduce the time for marking charts. Functionality: Levels and proteins with price tags; drawing strictly horizontal levels; continuous zigzag manually; expansion / truncation of lines, wrinkles; quick change of colors and fonts and shapes; Filling/removing the filling of vessels, triangles, ellipses; dragging by 1 (first) point and auto alignment of the h
FREE
How To Trade
Execute your trades in 3 Easy Steps!
Step 1: Trade Setup Entry Buy in Signal price and TP1 in price indicator, You can use trailing stop in TP1. Entry Sell in Signal price and TP1 in price indicator, You can use trailing stop in TP1. Success Rate ≥ 75% 100:25 Step 2: Set Stop Loss Stop loss BUY ----> You can set stop loss on Line Order SELL. Stop loss SELL ----> You can set stop loss on Line Order BUY. Step 3: Set Take Profit Option 1: Take profit on TP1. Option 2: Partial take pr
FREE
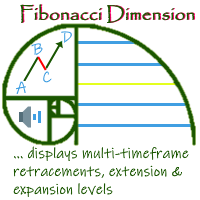
'Fibonacci Dimension' indicator allows display of preset or user-defined multi-timeframe Fibonacci levels. It automatically takes the previous high and low for two user-defined timeframes and calculates their Fibonacci retracement levels. It also considers the retraced level to draw the expansions on every change of price. A complete visual dimension in multiple timeframes allows deriving profitable strategies for execution. Enhanced functionality to view and customize the default Fibonacci Rang
FREE

Ziwox 월드맵 세션 인디케이터(MetaTrader 4용) 글로벌 시장 인식을 차트에 직접 가져오세요!
Ziwox 월드맵 세션 인디케이터는 실시간 세계 지도를 MT4 차트 배경으로 표시하며, 현재 거래 세션과 완벽하게 동기화됩니다. 주요 기능: 실시간 세션 동기화 : 현재 캔들이 세계 지도에서 정확히 어디에 위치하는지 확인할 수 있습니다. 동기화 모드 전환 : 실시간 동기화 모드와 고정 지도 모드 사이를 전환하여 거래 계획을 보다 효과적으로 세울 수 있습니다. 맞춤형 색상 : 지도 색상, 세션 마커 및 강조 표시를 선호에 맞게 조정 가능. 차트 내 시간 표시 : 차트에서 직접 세션 시간을 확인하여 더 나은 의사결정 가능. 시각적 거래 인식 : 거래 진입 시 세션 내 위치를 즉시 확인 가능. 데이 트레이더든 스윙 트레이더든, Ziwox 월드맵 세션 인디케이터를 사용하면 글로벌 시장의 리듬에 맞춰 거래할 수 있습니다.
MT4 글로벌 세션 맵 인디케이터 – 시장 타이밍 추적의 핵심 거
FREE

FullScalping 는 모든 시장에서 지속적인 스캘핑 진입 을 생성하도록 특별히 설계된 재그리기 없음, 역방향 그리기 없음 지표입니다. 끊임없는 액션을 찾는 공격적인 트레이더에게 완벽합니다!
독점 정보 및 업데이트를 받으려면 채널에 가입하세요: https://www.mql5.com/en/channels/forexnewadvisor
거의 모든 캔들 에서 신호를 제공하며, 트렌드를 확인하거나 주요 되돌림을 신호합니다. 지속적으로 당신을 안내하는 레이더와 같습니다.
작동 방식은? 매우 간단합니다: 빨간색 화살표 매도 거래에 진입. 파란색 화살표 매수 거래에 진입. 항상 일반적인 트렌드 방향으로 거래하고, 거래당 15-20핍 을 공격적으로 목표로 하며, 급격한 시장 반전 전에 빠르게 퇴장합니다.
신호는 지속적 이므로 거래 기회가 고갈되지 않습니다. 목표는 다음을 사용하여 집중적인 스캘핑 을 실행하는 것입니다: 높은 로트 낮은 스프레드(왼쪽 하단 모서리에 표시) 마지막 트렌
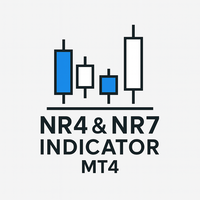
설명:
MetaTrader 4용 NR4 & NR7 Inside Bar Highlighter 는 NR4 또는 NR7 과 Inside Bar 의 조합에 기반한 가격 압축 패턴을 자동으로 감지하는 지표입니다. 작동 방식:
**NR4 (Narrow Range 4)**는 최근 4개 봉 중 범위가 가장 좁은 봉을 식별하고, NR7 은 최근 7개 봉을 고려합니다. 이러한 좁은 범위 조건이 Inside Bar (이전 봉 안에 완전히 포함된 봉)과 동시에 발생하면, 종종 강력한 브레이크아웃 이전의 저변동성 국면을 시사합니다. 이 패턴들은 브레이크아웃 전략에서 널리 활용됩니다. 강조된 신호:
지표는 차트 상에서 관련 봉들을 설정 가능한 색상으로 표시합니다: NR4 + Inside Bar: 흰색 NR7 + Inside Bar: 주황색 각 신호에는 시각적 식별을 위한 라벨도 함께 표시됩니다. 통합 및 알림:
이 시스템은 MetaTrader 4에서 시각적 알림 , 이메일 , 사운드 또는 맞춤형 트레
FREE

Time Session OPEN-HIGH-LOW-CLOSE This Indicator Will Draw Lines Of OHLC Levels Of Time Session Defined By User. It Will Plot Floating Lines On Current Day Chart. Time Session Can Of Current Day Or Previous Day. You Can Plot Multiple Session Lines By Giving Unique ID To Each Session. It Can Even Show Historical Levels Of Time Session Selected By User On Chart To Do Backdating Test. You Can Write Text To Describe The Lines.
FREE

This indicator is SO SIMPLE… when the green Rise Coming arrow appears, a price drop may be on the way! Plain and easy profits! As you receive more than one 'Rise Coming' text signal in a downtrend, it means momentum is building larger for a bull run. HOW TO USE 1. When the green "Rise Coming" text appears, a price jump may be on the way! This indicator Never Repaints! To get the best setting it's a matter of tweaking the indicator until it gives you the best results. Our recommendation, and what

Objective: To notify/alert traders if price touched or closed above/below the moving average. Features/Settings: Moving average method supported: Simple, Exponential, Smoothed and Linear Weighted Works on all currency pairs. Set the Moving Average Period/Shift value Timeframe supported: 1m, 5m 15m, 30m, 1H, 4H, 1D, 1WK, 1Mo Set the Applied Price: Close, Open, High, Low, Price, etc. Set the Candle Size Type: Full Length or Body Length Set the Candle Size to Trigger an Alert Alert type: Popup, Se

Contact me after payment to send you the User-Manual PDF File.
Triangle Pattern
Sometimes the price cannot make higher highs or lower lows and it moves in a converging price range and waves are shorter than before until the movement creates a geometric shape of a symmetrical triangle, which indicates It is maybe the end of the trend. The triangle pattern is a well-known in forex and the trading plan and strategy of many traders is based on it.
The Triangle Pattern Scanner Indicator It is usu
SEE THE TREND ON EVERY TIME FRAME. INTELLIGENT INDICATOR READS PRICE ACTION TO SPOT TRUE MARKET CYCLES AND TREND. This advanced multi-currency and multi-time frame indicator, reads trend in real-time so you always know the trends of the markets you want to trade.
Trend-Viewer Pro has been specifically designed to read the trend of every time frame and every market , simultaneously, making it much easier for you to find markets with time frame correlation , so you can focus on the best markets
Hurst Buy and Sell This innovative indicator, inspired by xAI Grok intelligence, uses the Hurst exponent to identify the nature of the market and generate buy/sell signals. The EA for this indicator (Hurst Razer PRO EA MT5) is now available, you can see it by clicking here! https://www.mql5.com/es/market/product/153441?source=Site+Profile+Seller If you want more signals from the indicator, change the minimum number of bars between consecutive signals. The lower the value, the more signals it
FREE
Introducing the Swing Point Model Indicator – A Professional Trading Tool The Swing Point Model Indicator is an innovative tool designed for traders who want to capture market structure and identify potential trading opportunities. With a logical and transparent approach, the Swing Point Model helps you gain deeper market insights and make precise trading decisions. This is multiple Timeframe indicator so you can choose Higher timeframe for detect Swing point model What Is the Swing Point Mo
Scalp Arrow Exit Signals (MT4 Indicator) All-in-One MT4 Signals: Precise Entries, Exits & Re-entries for Any Trading Style! The "Scalp Arrow Exit Signals" is a professional-grade trading indicator for MetaTrader 4 (MT4) , engineered to be your comprehensive guide for reliable entry, exit, re-entry, retracement entry, and pull-back entry signals . This powerful forex tool operates as a complete "black-box" system, providing clear, actionable buy and sell signals with robust alerts across any inst

Are you ready to become the Sherlock Holmes of forex trading? ️️ Introducing the ultimate trading toolkit: Lisek Levels and Channels Indicator !!! Forget juggling multiple indicators like a circus act. We've packed everything you need into one spectacular show: Price Levels? Check! Price Channels? You bet! Price VWAP? Oh yeah! Volume On Balance? It's all there! And the cherry on top? Alarms and Push Notifications that'll wake you up faster than a double espresso! ️ Your cha
FREE

CustomMultiBarFractal Indicator Description
Overview The CustomMultiBarFractal indicator identifies and displays fractal patterns on price charts. Fractals represent significant price reversal points that can serve as signals for trading strategies.
Key Features - Detects fractals based on a user-defined analysis period - Displays upper and lower fractals with customizable colors - Allows offset adjustment from price extremes - Provides flexible visualization settings - Support
FREE

Background : Forex swing trading is a short-to-medium-term strategy aiming to profit from price "swings" (short uptrends/downtrends) within larger market moves.
This is a simple system that trades the rejection of a previous swing high/low . The system is non repaint and easy to use.Please use with discretion , it gives a decent accuracy and would definitely improve your trades. You can use on any pair and timeframe
FREE

키 존 감지기 (Key Zone Detector)
공급 및 수요 존 감지기 (Key Level Supply & Demand Zone Detector) 개요 (Overview)
시장에서 중요한 활동이 발생하는 주요 가격 수준을 식별하고 평가하는 정교한 공급 및 수요 존 감지 지표입니다. 프랙탈 분석과 다중 검증 방법을 사용하여 거래 존을 감지하고 분류합니다. 주요 기능 (Key Features) 존 감지 (Zone Detection) 지지 및 저항 존 자동 감지 확인을 위한 이중 프랙탈 시스템(빠른/느린) 사용 ATR(평균 실제 범위) 기반 동적 존 두께 더 깔끔한 표시를 위해 중복 존 병합 존 분류 (Zone Classification) 검증된 존(Proven Zones): 4회 이상 테스트, 최고 신뢰성 확인된 존(Verified Zones): 1-3회 테스트, 양호한 신뢰성 미검증 존(Untested Zones): 첫 테스트 대기 중인 새 존 변절 존(Turncoat Zone

Stochastic RSI Indicator - Master the Art of Timing Elevate your trading game with the "Stochastic RSI Indicator." This powerful tool marries the Stochastic oscillator with the Relative Strength Index (RSI), offering precise insights into market dynamics. It's your key to mastering the art of timing in trading. About the Indicator : The Stochastic RSI Indicator combines two robust indicators - Stochastic and RSI - to provide traders with an exceptional tool for identifying entry and exit points
FREE

FX Correlation Matrix is a powerful multi-timeframe dashboard that helps traders analyze real-time currency correlations of up to 28 symbols at a glance. With customizable settings, sleek design, and manual symbol selection option, it enhances trade accuracy, reduces risk, and identifies profitable correlation-based opportunities. Setup & Guide: Download MT5 Version here. Follow our MQL5 channel for daily market insights, chart, indicator updates and offers! Join here.
Read the product des

** All Symbols x All Timeframes scan just by pressing scanner button ** *** Contact me to send you instruction and add you in "Wolfe Wave Scanner group" for sharing or seeing experiences with other users. Introduction: A Wolfe Wave is created with five-wave patterns in price. It shows supply and demand and a fight towards a balance price. T hese waves of price actions can help traders identify the boundaries of the trend . Also It helps forecast how the price will move in the near future

스마트 트렌드 채널 지표 설명:
스마트 트렌드 채널 지표는 시장의 주요 트렌드를 시각적으로 식별하기 위해 차트에 동적으로 지원선과 저항선을 그려주는 강력하고 유연한 도구입니다. 고급 프랙탈 계산을 사용하여 지표는 시장의 변동에 따라 자동으로 트렌드 라인을 조정하고, 트레이더가 돌파구나 반전 포인트를 식별하는 데 도움을 줍니다. 주요 기능: 채널 표시 제어: 트렌드 채널을 표시하거나 숨길 수 있는 옵션이 있습니다. 동적 프랙탈 계산: 시간 프레임과 프랙탈 파라미터를 기준으로 자동으로 트렌드 라인이 조정됩니다. 명확한 트렌드 시각화: 상한선, 하한선, 중간선의 3개 라인으로 시장 트렌드를 명확히 나타내어 거래 결정을 돕습니다. 사용자 정의 가능한 라인 색상: 라인의 색상을 개별적으로 설정하여 중요한 시장 레벨을 강조하고, 시각적 명확성을 높일 수 있습니다. 다양한 시간 프레임 지원: 1분 차트부터 1개월 차트까지 다양한 시간 프레임에 자동으로 적응합니다. 장점: 강한 시장 트렌드와 반
FREE

RSI divergence indicator is a multi-timeframe and multi-symbol indicator that help us find divergences between price chart and RSI indicator. Always use the divergence indicators with other technical assets like support resistance zones, candlestick patterns and price action to have a higher possibility to find trend reversals. This indicator will identify the peaks and troughs of both price and the RSI indicator. You can adjust the parameters to adjust the strength and weakness of these peaks a
FREE

인디케이터는 차트의 라운드 레벨을 보여줍니다. 심리적, 뱅킹 또는 주요 플레이어 레벨이라고도 합니다. 이 수준에서 황소와 곰 사이에 실제 싸움이 있고 많은 주문이 누적되어 변동성이 증가합니다. 표시기는 모든 악기와 기간에 따라 자동으로 조정됩니다. 80레벨을 돌파하고 테스트를 하면 구매합니다. 20레벨 돌파 후 테스트 하면 판매합니다. 목표는 00입니다. 주목. 강력한 지원 및 저항 수준으로 인해 가격이 00 수준을 약간 놓칠 수 있습니다.
입력 매개변수.
Bars Count - 라인 길이. Show 00 Levels - 00 레벨을 표시하거나 표시하지 않음. Show 10, 90 Levels. Show 20, 80 Levels. Show 30, 70 Levels. Show 40, 60 Levels. Show 50 Levels. N Lines - 차트의 레벨 수를 제한하는 매개변수. Distance 00 Levels - 레벨 사이의 거리(자동 또는 수동). Line Positi
FREE
추세 상관 강도 (TCS) 지표: 외환 추세 분석의 우위 추세 상관 강도 (TCS) 지표 는 추세 강도를 측정하는 방식을 재정의하는 최첨단 도구로, 평균 방향 지수(ADX)와 같은 기존 지표에 비해 상당한 이점을 제공합니다. 방향성 움직임에 의존하는 ADX와 달리, TCS는 종가와 선형 시계열 간의 상관 관계 를 계산하여 추세 강도를 독특하게 정량화합니다. 이 혁신적인 접근 방식은 외환 트레이더에게 강력한 추세를 식별하고 활용하기 위한 매우 정밀한 방법을 제공합니다. TCS를 선택하는 이유? 추세를 일찍 포착하고 핍을 극대화하세요: TCS는 단순히 반응하는 것이 아니라 예측합니다. 시간이 지남에 따라 가격이 얼마나 선형적으로 움직이는지 측정하여 놀라운 정확도로 새로운 추세를 식별하는 데 도움이 됩니다. 주간 차트에서 TCS 값이 45 이상으로 상승하는 것 은 중요한 시장 움직임이 진행 중이라는 강력한 신호입니다. 기존 전략에 TCS를 통합하여 더 일찍 거래에 진입하고 더 많은 핍을
FREE

YOU CAN NOW DOWNLOAD FREE VERSIONS OF OUR PAID INDICATORS . IT'S OUR WAY OF GIVING BACK TO THE COMMUNITY ! >>> GO HERE TO DOWNLOAD The system is a free open source pine script originally published on TradingView by everget . It was converted to Mt4 by Forex Robot Makers. This system is a popular trend indicator based on ATR ( Average True Range ) , Moving Averages and the Donchian channel .
System BackGround
ATR The average true range is an indicator of the price volatility of an asse
FREE

Dashboard uses Ichimoku Strategy to find best trades.
Get extra Indicators/Template: And read more about detailed Product Description and usage here: https://www.mql5.com/en/blogs/post/747457
Read more about Scanner Common features in detail here: https://www.mql5.com/en/blogs/post/747456
Features:
Price Kumo Breakout Tenkan-Kijun Cross Chikou/CLoud and Chikou/Price Support/Resistance (SR-SS or SR-NRTR) Stochastic OB/OS and back Awesome Oscillator Higher Timeframe Ichimoku Trend Align

---- Brand New Strategy. Three Month Rent is $30. ONE YEAR RENT ONLY $50. FREE EURUSD VERSION AVAILABLE UNDER << Forecast System Gift >>. NO NEED FOR BACKTEST! Link to the FREE version --> https://www.mql5.com/en/market/product/110085?source=Site --- This is a simple strategy based on BREAKOUT and FIBONACCI levels. After a breakout, either, the market: - continues the move directly to the 161, 261 and 423 levels, or - retraces to the 50% level (also called a correction) and thereafter continues

This indicator Super Channel Pro Pluss indicator.Indicator displays trend movement. Indicator calculates automatically line. Features
FiltPer - displays indicator channel period. deviation - displays indicator channel deviation. deviation2 - displays indicator channel deviation. deviation3 - displays indicator channel deviation. How to understand the status: If the arrow is up and line color Teal ;trend is up. If the arrow is down and line color Red; trend is down. If the arrow is Yellow close

This indicator provides the ability to recognize the SMC pattern, essentially a condensed version of the Wyckoff model. Once the pattern is confirmed by RTO, it represents a significant investment opportunity. There are numerous indicators related to SMC beyond the market, but this is the first indicator to leverage patterns to identify specific actions of BigBoy to navigate the market. Upgrade 2024-03-08: Add TP by RR feature. The SMC (Smart Money Concept) pattern is a market analysis m

Donchian Breakout Prime: The Ultimate Trend Signal Indicator Are you tired of missing major market moves or getting caught in choppy consolidation? It's time to equip your trading arsenal with Donchian Breakout Prime , the smart indicator designed to spot powerful trend reversals and continuations with unparalleled clarity. This is more than just an indicator—it's your market compass, engineered for traders who demand precision and confirmation before entering a trade. By intelligently combinin
FREE
MetaTrader 마켓은 MetaTrader 플랫폼용 애플리케이션을 구입할 수 있는 편리하고 안전한 환경을 제공합니다. Strategy Tester의 테스트를 위해 터미널에서 Expert Advisor 및 인디케이터의 무료 데모 버전을 다운로드하십시오.
MQL5.community 결제 시스템을 이용해 성능을 모니터링하고 원하는 제품에 대해 결제할 수 있도록 다양한 모드로 애플리케이션을 테스트할 수 있습니다.
트레이딩 기회를 놓치고 있어요:
- 무료 트레이딩 앱
- 복사용 8,000 이상의 시그널
- 금융 시장 개척을 위한 경제 뉴스
등록
로그인
계정이 없으시면, 가입하십시오
MQL5.com 웹사이트에 로그인을 하기 위해 쿠키를 허용하십시오.
브라우저에서 필요한 설정을 활성화하시지 않으면, 로그인할 수 없습니다.