Regardez les tutoriels vidéo de Market sur YouTube
Comment acheter un robot de trading ou un indicateur
Exécutez votre EA sur
hébergement virtuel
hébergement virtuel
Test un indicateur/robot de trading avant d'acheter
Vous voulez gagner de l'argent sur Market ?
Comment présenter un produit pour qu'il se vende bien
Indicateurs techniques pour MetaTrader 4 - 12

Price Action Sniper is designed to trade the Price Action on the desired chart time frame. - Trend Reversals. - Trend Continuation. - Brekaouts. - Good tool for Binary Options
Price action forms the basis for all technical analysis of a currency pair, commodity or other asset chart. Many short-term traders rely exclusively on price action and the formations and trends extrapolated from it to make trading decisions. Technical analysis as a practice is a derivative of price action since it uses p

At the very least, this indicator is able to entertain you. It builds a moving line based on interpolation by a polynomial of 1-4 powers and/or a function consisting of a sum of 1-5 sine curves. Various combinations are possible, for example, a sum of three sine curves about a second order parabola. The resulting line can be extrapolated by any of the specified functions and for various distances both as a single point at each indicator step (unchangeable line), and as a specified (re-painted) f

Profitez du prix actuel pendant que vous le pouvez — il peut être ajusté à tout moment. L'objectif de l'indicateur "Black Horse" est d'identifier les divergences entre l'action des prix et l'indicateur VWAP. Il utilise des filtres pour éliminer les divergences potentiellement fausses et générer des alertes de haute qualité et précises.
Les divergences baissières sont indiquées par des points rouges au-dessus de la bougie, tandis que les divergences haussières sont représentées par des points v
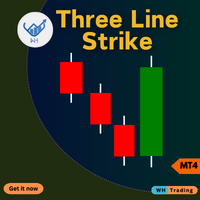
Indicateur de frappe à trois lignes pour MetaTrader 4 (MT4). Cet outil avancé est conçu pour vous aider à identifier les retournements de marché potentiels avec précision et facilité.
Que vous soyez un trader débutant ou expérimenté, cet indicateur peut améliorer vos décisions de trading et maximiser vos profits. Contact me after purchase for guidance Caractéristiques principales : Signaux d'inversion précis : détectez les inversions de tendance potentielles en fonction du modèle de grè
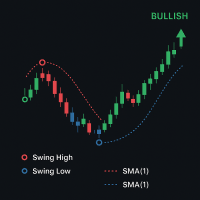
HighLow Swing — Indicateur de détection de tendances et de swings Description : HighLow Swing est un puissant indicateur de détection de tendances et de swings conçu pour aider les traders à identifier facilement les points de retournement et les directions clés du marché, quel que soit l'intervalle de temps. Il met en évidence les hauts et les bas significatifs, trace des cercles de tendance en fonction de la structure du swing et vous aide à anticiper la dynamique du marché grâce à des signau

An extremely convenient indicator that truly makes the process of making money on the exchange easy. It is based on the scientifically rigorous theory of the market developed by the author, the beginning of which is presented here . The full algorithm of this indicator operation is presented in the article . The indicator calculates the most probable price movement trajectory and displays it on the chart. Based on the predicted price movement trajectory

This indicator is a conventional analytical tool for tick volumes changes. It calculates tick volumes for buys and sells separately, and their delta on every bar, and displays volumes by price clusters (cells) within a specified bar (usually the latest one). The algorithm used internally is the same as in the indicator VolumeDelta , but results are shown as cumulative volume delta bars (candlesticks). Analogous indicator for MetaTrader 5 exists - VolumeDeltaBars . This is a limited substitution
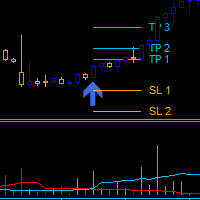
Dark Power is an Indicator for intraday trading. This Indicator is based on Trend Following strategy, also adopting the use of an histogram to determine the right power . We can enter in good price with this Indicator, in order to follow the strong trend on the current instrument. The histogram is calculated based on the size of the bars and two moving averages calculated on the histogram determine the direction of the signal
Key benefits
Easily visible take profit/stop loss lines Intui
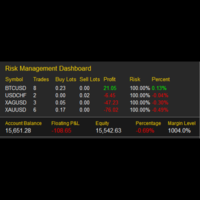
My Risk Management The Risk Management Dashboard is a visual tool designed to help traders monitor risk exposure in real time. With a clear and compact layout, it provides an instant overview of trading activity, enabling more disciplined and informed decision-making. Key Features Active Symbol Summary
Displays all traded symbols with the number of trades, total buy/sell lots, and current profit/loss. Per-Symbol Risk Analysis
Calculates and shows the risk percentage of each symbol relative to
FREE

Turbo Trend technical analysis indicator, which determines the direction and strength of the trend, and also signals a trend change. The indicator shows potential market reversal points. The indicator's intelligent algorithm accurately determines the trend. Uses only one parameter for settings. The indicator is built for simple and effective visual trend detection with an additional smoothing filter. The indicator does not redraw and does not lag. Take profit is 9-10 times larger than stop loss

The Extreme point indicator helps in determining the probable price reversal points on the chart. The indicator facilitates the search for points to enter the market with greater accuracy. The indicator displays certain impulses, after which there is a high probability of the price continuing its movement in the same direction. The indicator can be used in conjunction with other indicators for a more accurate detection of the position entry points. The indicator can also be used independently. F

The indicator has combined 5 popular strategies. Draws an arrow after confirming a signal for the selected strategy. There are signal alerts. Doesn't redraw its values. I recommend watching my advisor - Night Zen EA
5 strategies. The main line crosses the signal line. The main line crosses the signal line in the oversold (for buy) / overbought (for sell) zones. The main line enters the oversold (for sell) / overbought (for buy) zones . The main line comes out of the oversold (for buy ) / over
FREE
Renko Chart with Moving Average. Classic Renko charts idea. It is protted on main chart and Moving Average can be applied. Prices for bars are used from a lower timeframe. Parameters: BarsBack - how many bars of lower timeframe to use. If value is zero than it will use all available bars. LTF - lower timeframe. BrickSize - Renko bar in points. BullishColor - color for bull candle. BearishColor - color for bear candle. HideLineChart - if this value is true the line chart when be hidden when sele
FREE
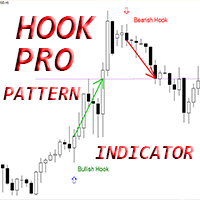
Indicateur Crypto_Forex « Hook Pro pattern » pour MT4, sans refonte, sans délai.
- L'indicateur « Hook Pro pattern » est très performant pour le trading Price Action. - L'indicateur détecte les hooks haussiers et baissiers sur le graphique : - Hook haussier : signal de flèche bleue sur le graphique (voir images). - Hook baissier : signal de flèche rouge sur le graphique (voir images). - Alertes PC, mobile et e-mail. - L'indicateur « Hook Pro pattern » est idéal pour combiner avec les niveaux d

The Renko_Bars_3in1 is designed for plotting 3 types of Offline Renko charts. Standard Renko Bar (the reversal bar is twice the size of the bar). Renko Range Bar (the size of all bars is the same). Renko Bars with the ability to adjust the size of the reversal bar. Attention : The demo version for review and testing can be downloaded here . Note . A chart with the M1 period is necessary to build an offline chart. When the indicator is attached to a chart, the offline chart is opened automaticall
This is a combine that combines the ATR, Candle Timer, Watermark indicators and a tool for working with graphical objects, which allows you to reduce the time for marking charts. Functionality: Levels and proteins with price tags; drawing strictly horizontal levels; continuous zigzag manually; expansion / truncation of lines, wrinkles; quick change of colors and fonts and shapes; Filling/removing the filling of vessels, triangles, ellipses; dragging by 1 (first) point and auto alignment of the h
FREE
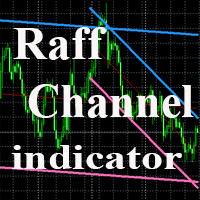
The indicator plots a trend channel using the technique by Gilbert Raff. The channel axis is a first-order regression. The upper and lower lines show the maximum distance the Close line had moved away from the axis line. Therefore, the upper and lower lines can be considered as resistance and support lines, respectively. A similar version of the indicator for the MT5 terminal
As a rule, most movements of the price occur within a channel, going beyond the support or resistance line only for a sh
FREE

Tendance volume UR
UR VolumeTrend est l'indicateur de volume le plus clair montrant la tendance en cours en termes de volume. Fonctionne parfaitement avec d'autres indicateurs, tout comme UR TrendExhaustion pour signaler les hauts et les bas locaux.
Limité à seulement 2 paramètres - plus les valeurs sont élevées, plus les tendances seront longues. Les extrêmes de gradient montrent des épuisements possibles du volume pour attraper un renversement potentiel. Deux lignes - La tendance du volum

This indicator represents a genuine momentum oscillator according to the true definition of "Momentum", and as realised by the techniques of digital filtering. ( Note : download a complete set of true momentum oscillators here ). A scholarly paper on the subject by the current developer can be found here , but in this description we shall borrow only the minimum of conceptual and mathematical framework needed. In the process, we expose some long-held myths about indicators supposedly measurin
FREE
Sniper Flip Zones – Système de signaux d'achat/vente précis
J'ai conçu Sniper Flip Zones pour générer des signaux d'ACHAT et de VENTE ultra-précis en identifiant les moments où le momentum change brusquement dans des marchés en tendance ou en range. Il fonctionne particulièrement bien sur XAUUSD en M1/M5, mais peut être appliqué à n'importe quelle paire ou unité de temps grâce à ses paramètres configurables.
Rejoignez le canal pour rester informé : https://www.mql5.com/en/channels/forexnewadvi
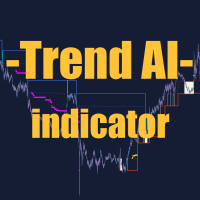
Trend AI Indicator Description:
Le Trend AI Indicator est un outil puissant d'analyse de marché qui utilise l'intelligence artificielle pour identifier les tendances et les niveaux clés. L'indicateur s'adapte automatiquement aux conditions changeantes du marché, fournissant des données précises pour la prise de décision. Fonctionnalités principales: Identification de la tendance: L'indicateur utilise des algorithmes d'apprentissage automatique pour déterminer avec précision la direction de la
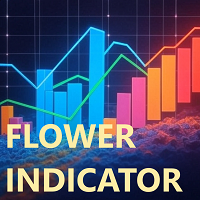
L'indicateur Flower est un outil d'analyse technique principalement utilisé pour identifier les tendances et faciliter les stratégies de scalping ou de trading intraday.
L'indicateur Flower est un indicateur de tendance basé sur l'analyse technique et la dynamique des prix. Il signale visuellement les tendances grâce à des fleurs colorées : les bleues indiquent une tendance haussière, les rouges une tendance baissière.
Chaque niveau peut agir comme support et résistance (attention aux niveaux
FREE

YOU CAN NOW DOWNLOAD FREE VERSIONS OF OUR PAID INDICATORS . IT'S OUR WAY OF GIVING BACK TO THE COMMUNITY ! >>> GO HERE TO DOWNLOAD Most of the time, market reversals / pull backs usually follow volume and price spikes thus these spikes could be the first indication of an exhaustion and possible reversal/pullback. High volume Turns is an indicator that scans the market for price and volume spikes around over-bought/over-sold market conditions. These spikes when spotted serves as the first indi
FREE
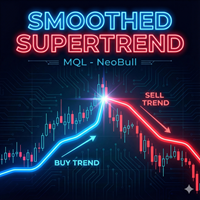
Indicateur Smoothed Supertrend - Indicateur de Tendance Basé sur la Volatilité avec Fonction de Lissage L'Indicateur Smoothed Supertrend est une variante améliorée de l'indicateur Supertrend classique pour MetaTrader 4 . En intégrant une fonction de lissage supplémentaire, le bruit du marché est réduit et la qualité des signaux de tendance est améliorée. Description Technique: L'indicateur est basé sur l'Average True Range (ATR) pour mesurer la volatilité du marché et le combine avec un lissage
FREE

Surfez sur la tendance – Un signal clair pour suivre la vague Sur les marchés financiers, les opportunités les plus stables de gains se trouvent généralement lors de phases de tendance bien établies. Pourtant, même pour les traders expérimentés, il n’est pas toujours facile de capter ces mouvements. Ride the Trend Signal est un indicateur de signal conçu pour repérer les « pullbacks » dans les tendances haussières ou baissières. Plutôt que d’entrer dès le début de la tendance, il attend une conf
FREE
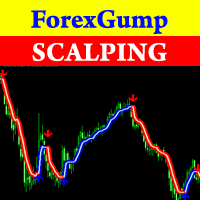
Attention! Friends, since there have been many scammers on the Internet recently selling indicators called ForexGump, we decided to warn you that only on our page is the LICENSE AUTHOR'S VERSION of the INDICATOR sold! We do not sell this indicator on other sites at a price lower than this! All indicators are sold cheaper - fakes! And even more often sold demo versions that stop working in a week! Therefore, in order not to risk your money, buy this indicator only on this site! Forex Gump Scalpin

The indicator draws the time scale on the chart. You can specify the time offset, adjust the size and font to display on the chart (it is displaying your local time on your chart instead of MT time). You can also select the desired format for displaying the date and time. While holding down the middle mouse button, and moving the cursor, a slider will appear on the scale. You may be interested in my other product , which contains a more advanced version of the Time Scale.
You can also find my o
FREE
CIS is designed for trading a basket of correlating currencies, as well as single instruments: indicators
VSA indicator which draws arrows (does not redraw). Its signals indicate the price reversal on a calm market or decrease of the rise or fall rate during strong movements. Works fine in the flats. As the indicator uses volumes in its calculations, be careful during evenings and night times, when there are very small volumes. It is recommended to be used only on multiple currencies or at lea

"TRADE SAFELY! TRADE LIKE A PROFESSIONAL!" Bonus: You get the Forex Trend Commander Indicator absolutely free!
A secret system built as an automatic indicator based on unique knowledge inspired by famous traders. The system uses the unique smart adaptable algorithm to overcome the difficulties of analysis and trading. All trade is protected by a stop loss to minimize possible drawdowns. Using the indicator with a professional money management system allows you to control capital and take advant
This indicator is the mql version of the Linear Regression Candles indicator. Find out more here: https://www.mql5.com/en/users/rashedsamir/seller There are many linear regression indicators out there, most of them draw lines or channels, but this one actually draws a chart.This script includes features such as linear regression for open, high, low, and close prices, signal smoothing with simple or exponential moving averages. I welcome your suggestion for improving the indicator.
To incre
FREE

L'indicateur affiche les signaux basés sur l'oscillateur RSI terminal sur le graphique. Il est possible de filtrer les signaux répétés.
Ici, l'oscillateur est utilisé pour rechercher un signal inverse. Il est recommandé comme point d'entrée dans les stratégies swing et le trading à partir de niveaux.
Un tableau de bord multidevises est disponible. Avec lui, vous pouvez facilement basculer entre les graphiques. Dans les discussions sur les produits, vous pouvez suggérer un algorithme dans lequ
FREE
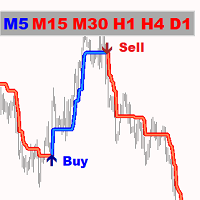
Gold Pointer est le meilleur indicateur de tendance. L'algorithme unique de l'indicateur analyse le mouvement du prix de l'actif, en prenant en compte les facteurs de l'analyse technique et mathématique, détermine les points d'entrée les plus rentables et donne un signal pour ouvrir un ordre d'ACHAT ou de VENTE.
Les meilleurs signaux de l'indicateur:
- Pour la VENTE = ligne de tendance rouge + indicateur TF rouge + flèche de signalisation jaune dans la même direction. - Pour l'ACHAT = ligne

US30 Revolt a Technical indicator that is 100% non-repaint and appears on the current candlestick works on all timeframes (recommended M15,M30,H1) The indicator is made for US30 but it can be used on other pairs as well When a blue arrow appears look for buying opportunities When a orange arrow appears look for selling opportunities Please watch the YouTube video on how to properly set up and use the indicator
FREE
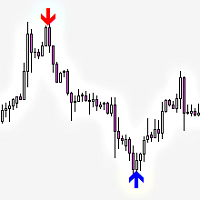
Railway Tracks Pattern — Reversal Pattern Indicator Railway Tracks Pattern is an indicator that automatically detects a powerful two-candle reversal pattern on the chart. It looks for two candles with opposite directions (bullish and bearish), similar in size, and with minimal wicks — a clear sign of momentum shift. How it works: The first candle is strong and directional. The second candle moves in the opposite direction and is of similar size. Both candles have small shadows (wicks). The
FREE

Nous vous présentons un indicateur qui non seulement améliore l'aspect visuel du graphique, mais lui confère également un caractère vivant et dynamique. Notre indicateur est une combinaison d'un ou plusieurs indicateurs de moyenne mobile (MA), qui changent constamment de couleur, créant ainsi un aspect intéressant et coloré.
Ce produit est une solution graphique, il est donc difficile de décrire ce qu'il fait dans un texte, il est plus facile de le voir en le téléchargeant, de plus le produit
FREE

QualifiedEngulfing est la version gratuite de l'indicateur ProEngulfing . ProEngulfing est la version payante de l'indicateur Advance Engulf. Téléchargez-le ici. Quelle est la différence entre la version gratuite et la version payante de ProEngulfing ? La version gratuite a une limitation d'un signal par jour. Présentation de QualifiedEngulfing - Votre indicateur de motif Engulf professionnel pour MT4 Libérez la puissance de la précision avec QualifiedEngulfing, un indicateur de pointe conçu p
FREE

Forex Breath System est un système de trading basé sur les tendances qui peut être utilisé sur n'importe quel marché. Vous pouvez utiliser ce système avec des devises, des métaux, des matières premières, des indices, des cryptomonnaies et même des actions. Il peut également être utilisé à tout moment. Le système est universel. Il montre la tendance et fournit des signaux fléchés avec la tendance. L'indicateur peut également vous fournir un type spécial d'alertes lorsque les signaux apparaissent

Le système de négociation technique des flèches de renversement de BB a été développé pour prédire les points inversés pour prendre des décisions de vente au détail.
La situation actuelle du marché est analysée par l'indicateur et structurée pour plusieurs critères: l'attente des moments d'inversion, des tournants potentiels, des signaux d'achat et de vente.
L'indicateur ne contient pas d'informations excédentaires, a une interface visuelle compréhensible, permettant aux commerçants de prendre

This indicators automatically draws the Support and resistances levels for you once you've dropped it on a chart. It reduces the hustle of drawing and redrawing these levels every time you analysis prices on a chart. With it, all you have to do is dropped it on a chart, adjust the settings to your liking and let the indicator do the rest. But wait, it gets better; the indicator is absolutely free! Get the new and improved version here: https://youtu.be/rTxbPOBu3nY Parameters Time-frame -> T
FREE

CyberZingFx Trend Reversal Indicator - your go-to solution for accurate and reliable trend reversal signals. With its unique trading strategy, the indicator offers you Buy and Sell Arrow signals that do not repaint, making it a reliable tool for catching Swing Highs and Swing Lows.
SCROLL DOWN TO VIEW SCREENSHOTS AND WATCH VIDEO ________________________________________________________________ Trading using CyberZingFx Trend Reversal is Simple Using the CyberZingFx Trend Reversal Indicator is ea
FREE
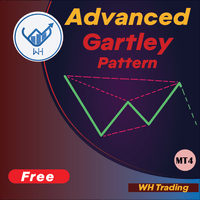
Bienvenue dans l'indicateur de reconnaissance avancée du motif Gartley Cet indicateur détecte le modèle de Gartley basé sur HH et LL de la structure des prix et des niveaux de Fibonacci, et lorsque certains niveaux de fib sont atteints, l'indicateur affichera le modèle sur le graphique. Version MT5 : WH Advanced Gartley Pattern MT5
**Cet indicateur fait partie du combo WH Ultimate Harmonic Patterns MT4 , qui inclut toute la reconnaissance de formes.** Caractéristiques : Algorithme ava
FREE

The indicator of a Professional Trader is an arrow indicator for predicting the direction of price movement. I have been working on this indicator since 2014.
You can use this indicator as your main indicator, use its entry signals, and use it as your only indicator to find entry points.
About the product: Recommended TF [H4-D1-W1] . The indicator predicts the direction of the next candle. Fits a variety of tools; Flexibility in settings for different instruments and intervals through the MO
FREE
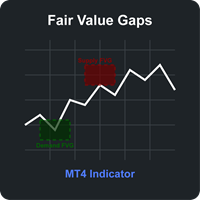
Fair Value Gaps (FVG) Indicator for MT4 The Fair Value Gaps (FVG) Indicator is a powerful technical analysis tool designed to identify and visualize significant price imbalances in the market. These gaps, created when price makes a strong directional move, represent areas where price has moved so quickly that no trading activity occurred, potentially indicating institutional interest and strong market momentum. Key Features: Dual Gap Detection : Automatically identifies both Supply FVGs (bearish
FREE
Key Features of the Indicator: Buy & Sell Signals: The indicator generates buy and sell signals based on specific conditions. It uses the crossover of the Fast Moving Average (Fast MA) and Slow Moving Average (Slow MA) to determine market entries. The RSI (Relative Strength Index) is used to identify buy signals when RSI is above 50 and below 75. It also considers support and resistance levels for additional confirmation of signals. Trend Filter: The market trend is identified using a Trend Movi
FREE

Discover Your Edge with Golden Trend Finder Are you tired of second-guessing your trades? Golden Trend Finder is the all-in-one indicator designed to give you a decisive advantage in the market. It's not just another tool; it's a powerful signal generator that combines multiple advanced indicators to provide you with clear, confirmed trading opportunities. Imagine having a smart system that tells you exactly when to enter and exit a trade, filtered to avoid false signals. Golden Trend Finder doe
FREE

This indicator displays buy or sell signals according to Bill Williams' definition of the Trading Zone. [ Installation Guide | Update Guide | Troubleshooting | FAQ | All Products ] Easy to use and understand Avoid trading flat markets Deterministic indicator with clear rules The indicator is non-repainting It implements alerts of all kinds It has straightforward trading implications. A blue arrow is a buy signal A red arrow is a sell signal According to Bill Williams trading in the zone helps to
FREE

Introduction This indicator detects volume spread patterns for buy and sell opportunity. The patterns include demand and supply patterns. You might use each pattern for trading. However, these patterns are best used to detect the demand zone (=accumulation area) and supply zone (=distribution area). Demand pattern indicates generally potential buying opportunity. Supply pattern indicates generally potential selling opportunity. These are the underlying patterns rather than direct price action. T

L'indicateur affiche le volume horizontal maximal sur la période sélectionnée. Basé sur l'indicateur UPD1 volume Box . Les lignes peuvent être connectées ou séparées. Dans les paramètres, vous pouvez activer l'alerte tactile intelligente. Un tel indicateur sera utile à ceux qui négocient en utilisant le profil du marché et le concept de Smart Money.
Conditions d'entrée.
Paramètres de base. Bars Count - spécifie le nombre de barres sur lesquelles TF POC sera dessiné. Data Source - délai à part
FREE

Tired of plotting trendlines? The PZ TrendLines indicator applies a mechanical approach to the construction of trend lines for you! [ Installation Guide | Update Guide | Troubleshooting | FAQ | All Products ] It can draw up to 18 trendlines Trendlines can be optionally based on fractals Each line represents a breakout level Each trendline can be broken or rejected Configurable amount of lines Configurable colors
Author Arturo López Pérez, private investor and speculator, software engineer and
FREE

Pullback Power: Catch the Trend, Maximize Your Profit! Tired of chasing trades and getting caught in market noise? The Pullback Power indicator is your essential tool for finding high-probability entries in a trending market. It's not about guessing; it's about trading with confidence, knowing you have a system designed to confirm genuine trend continuation after a brief pullback . This smart indicator combines the reliability of EMA Crosses for established trend direction with the dynamic conf
FREE

L'indicateur affiche des graphiques minimisés de n'importe quel symbole de n'importe quelle période. Le nombre maximum de graphiques affichés est de 28. Les graphiques peuvent être situés à la fois dans la fenêtre principale et dans la fenêtre inférieure. Deux modes d'affichage : bougies et barres. La quantité de données affichées (barres et bougies) et la taille des graphiques sont réglables. Paramètres: Corner - afficher le coin de départ (sélectionné dans la liste) CandleMode - mode d'afficha
FREE

The first currency based indicator to draw a distinction between map and strength. The map shows the currencies in terms of oversold/overbought levels and gives the direction of travel. The currency strength calculates and shows the strength of that move. Alerts are included for changes in currency direction on the map (confirmed over two bars) and also when the strength reached the appropriate level. The currency map is useful for finding currency pairs to trade and in which direction. Look fo

Le tableau de bord d'alerte ADR vous montre en un coup d'œil où se négocie actuellement le prix par rapport à sa fourchette quotidienne moyenne normale. Vous recevrez des alertes instantanées par pop-up, e-mail ou push lorsque le prix dépasse sa fourchette moyenne et les niveaux supérieurs de votre choix afin que vous puissiez sauter rapidement dans les reculs et les inversions. Le tableau de bord est conçu pour être placé sur un tableau vierge et s'asseoir simplement en arrière-plan et vous al

FullScalping est un indicateur qui ne redessine pas et ne dessine pas rétroactivement , spécialement conçu pour générer des entrées de scalping CONSTANTES sur n'importe quel marché. Parfait pour les traders agressifs qui recherchent une action ininterrompue !
Rejoignez la chaîne pour rester informé des informations exclusives et des mises à jour : https://www.mql5.com/en/channels/forexnewadvisor
Vous remarquerez qu'il donne des signaux sur presque chaque bougie , soit en confirmant la tendance
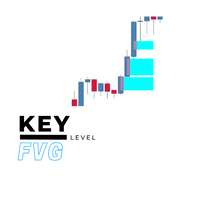
Key Level FVG Tired of manually scanning your charts for Fair Value Gaps (FVGs)? The Key Level FVG is a powerful and easy-to-use tool designed to automatically detect and display these critical price imbalances for you. Based on popular smart money concepts, this indicator highlights high-probability areas where the price is likely to return, providing you with clear and actionable trading zones. Whether you're a seasoned price action trader or just starting with FVG analysis, this indicator wi
FREE

RSI Divergence Full +10 other divergence indicators
Contact me after payment to send you the User-Manual PDF File. Download the MT5 version here. Also you can download the >>> Hybrid Trading EA <<< that is designed and implemented based on RSI Divergence Indicator. RSI is a pretty useful indicator in itself but it's even more effective when you trade divergence patterns with that. Because the divergence signal of the RSI indicator is one of the most powerful signals among the indicators. Di
** All Symbols x All Time frames scan just by pressing scanner button ** After 18 years of experience in the markets and programming, Winner indicator is ready. I would like to share with you! *** Contact me to send you " Trend Finder indicator " free, instruction and add you in "M1 Signal Scanner group" for sharing or seeing experiences with other users. Introduction: M1 Signal Scanner is the indicator designed scalping M1 time frame to detect Small trend switching in the direction

Scalpetronix Indicator — le noyau de signaux du robot Scalpetronix Cet indicateur implémente les algorithmes et signaux sur lesquels repose l’Expert Advisor Scalpetronix. Toutes les entrées du robot sont générées à partir de ces calculs : combinaison de moyennes mobiles exponentielles (EMA), filtrage de tendance via l’ADX, normalisation de la volatilité à l’aide de l’ATR et analyse de la structure des bougies. Avantages de l’indicateur fonctionne avec un système EMA multiniveaux (rapide et lent
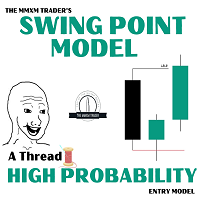
Introducing the Swing Point Model Indicator – A Professional Trading Tool The Swing Point Model Indicator is an innovative tool designed for traders who want to capture market structure and identify potential trading opportunities. With a logical and transparent approach, the Swing Point Model helps you gain deeper market insights and make precise trading decisions. This is multiple Timeframe indicator so you can choose Higher timeframe for detect Swing point model What Is the Swing Point Mo

The " YK Find Support And Resistance " indicator is a technical analysis tool used to identify key support and resistance levels on a price chart. Its features and functions are as follows:
1. Displays support and resistance levels using arrow lines and colored bands, with resistance in red and support in green.
2. Can be adjusted to calculate and display results from a specified timeframe using the forced_tf variable. If set to 0, it will use the current timeframe of the chart.
3. Uses the
FREE

Contact me after payment to send you the User-Manual PDF File. Divergence detection indicator with a special algorithm. Using divergences is very common in trading strategies. But finding opportunities for trading with the eyes is very difficult and sometimes we lose those opportunities. The indicator finds all the regular and hidden divergences. (RD & HD) It uses an advanced method to specify divergence. This indicator is very functional and can greatly improve the outcome of your trading. Thi

L'Average True Range ( ATR ) est une mesure de la volatilité du marché sur un certain nombre de jours. Il ne faut pas s'attendre à un mouvement de continuation important lorsque le prix a atteint la fin de la fourchette. On considère alors que le marché est à court de carburant. Si le cours n'a pas atteint la limite, il dispose encore d'une marge de mouvement. La formule de l'indicateur vous permet de calculer les niveaux High-Low à la fois globalement et individuellement. Vous pouvez également
FREE
Scalp Arrow Exit Signals (MT4 Indicator) All-in-One MT4 Signals: Precise Entries, Exits & Re-entries for Any Trading Style! The "Scalp Arrow Exit Signals" is a professional-grade trading indicator for MetaTrader 4 (MT4) , engineered to be your comprehensive guide for reliable entry, exit, re-entry, retracement entry, and pull-back entry signals . This powerful forex tool operates as a complete "black-box" system, providing clear, actionable buy and sell signals with robust alerts across any inst

MQLTA Support Resistance Lines is an indicator that calculates the historical levels of Support and Resistance and display them as Lines on chart. It will also Alert you if the price is in a Safe or Dangerous zone to trade and show you the distance to the next level. The indicator is ideal to be used in other Expert Advisor through the iCustom function. This indicator can be tested LIVE on AUDNZD with the following DEMO https://www.mql5.com/en/market/product/26572
How does it work? The indicato
FREE
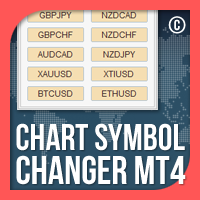
Chart Symbol Changer pour MT4 est un indicateur/utilitaire qui vous offre la possibilité de changer le symbole graphique actuel qui est attaché en cliquant sur un bouton de symbole sur son panneau. Chart Symbol Changer pour MT4 vous donne la possibilité de configurer les 32 boutons de symboles selon vos préférences personnelles, en ajoutant les paires que vous souhaitez surveiller et échanger le plus. De cette façon, vous ne manquerez jamais une opportunité, car vous pouvez avoir une vue plus r
FREE

as the name suggest Trend Maker Master is a trend scalping indicator that give long and short trading opportunity based on price action and ma style trend filter, the indicator Trend Period and Trend Extra Filter will change arrows signals quality and frequency, this leave a space for trader to come out with good combos for each pair. How to trade : Buy : when white buy arrow prints, set sl below recent swing low, and set tp to 1-1 Risk to reward ratio. Sell : when white Sell arrow prints, set
FREE
OneShotFX is a scalping arrow signals type indicator, an all in one arrow system with money management and filtered signals. How to trade Buy : when up arrow prints on the chart open buy trade, set your tp and sl on colored tp and sl lines above and below the arrow signal candle. Sell: when up arrow prints on the chart open sell trade, set your tp and sl on colored tp and sl lines above and below the arrow signal candle. Why is it a good choice Plenty of signals : no need to wait for long per
FREE

Unlock Smarter Trading with Trend-Sensing Pro Are you tired of confusing charts and late signals? Trend-Sensing Pro is a powerful yet simple indicator designed to help you see market trends with crystal clarity. It combines the smoothness of an EMA (Exponential Moving Average) with a unique candle visualization, giving you a clean, noise-free view of the market's direction. Why You'll Love Trend-Sensing Pro See the True Trend : Trend-Sensing Pro cuts through market noise, making it easy to ident
FREE

Il s'agit d'un produit gratuit que vous êtes libre d'utiliser pour vos besoins !
J'apprécie également beaucoup vos commentaires positifs ! Merci beaucoup !
Cliquez ici pour découvrir des robots de trading et des indicateurs de haute qualité !
Affichage du spread de l'indicateur Forex pour MT4, excellent outil de trading auxiliaire.
- L'indicateur Spread Display affiche le spread actuel de la paire de devises à laquelle il est attaché. - Il est possible de localiser la valeur d'affichage du
FREE
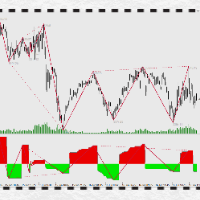
Introduction to PowerTrapezoid:
The application of market Power deviation system is not a secret, such as volume price deviation, MACD deviation, Chanlun deviation and so on. However, how to correctly understand and calculate, and accurately judge the increase or decrease of POWER is a threshold in application, which is difficult to cross with the conventional system. How to avoid reciting? How to implement multi level backflow parallel computing? How to intuitively show the range of backtrack
FREE
Le MetaTrader Market est la seule boutique où vous pouvez télécharger un robot de trading de démonstration gratuit pour le tester et l'optimiser à l'aide de données historiques.
Lisez l’aperçu de l'application et les avis d'autres clients, téléchargez-la directement sur votre terminal et testez un robot de trading avant de l'acheter. Seul MetaTrader Market vous permet de tester gratuitement une application.
Vous manquez des opportunités de trading :
- Applications de trading gratuites
- Plus de 8 000 signaux à copier
- Actualités économiques pour explorer les marchés financiers
Inscription
Se connecter
Si vous n'avez pas de compte, veuillez vous inscrire
Autorisez l'utilisation de cookies pour vous connecter au site Web MQL5.com.
Veuillez activer les paramètres nécessaires dans votre navigateur, sinon vous ne pourrez pas vous connecter.