Watch the Market tutorial videos on YouTube
How to buy а trading robot or an indicator
Run your EA on
virtual hosting
virtual hosting
Test аn indicator/trading robot before buying
Want to earn in the Market?
How to present a product for a sell-through
Technical Indicators for MetaTrader 4 - 18
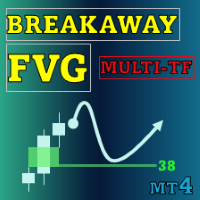
Special offer : ALL TOOLS , just $35 each! New tools will be $30 for the first week or the first 3 purchases ! Trading Tools Channel on MQL5 : Join my MQL5 channel to update the latest news from me The Breakaway Fair Value Gaps (FVG) tool is a cutting-edge solution designed for traders to identify areas where price has broken away from balance, providing in-depth insights into mitigation probabilities. This tool not only highlights critical signals but also includes advanced functi

Boom and Crash Spike Detector indicator is coded based on an advanced strategy primarily for detecting the Boom and Crash in the prices. Complex algorithms were implanted to detect high probability Booms and Crashs in the prices . It alerts on potential Boom or crash phases.
Key Features
Sends push notifications to mobile phone Pop up and sound alerts on computer or laptop Displays non repaint arrows (up arrows for Potential Boom and down arrows for Potential Crash) Working with all pairs.
Rec
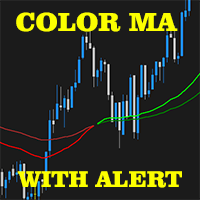
2 EMA Color Alerts Indicator is a powerful tool for any trader looking to stay on top of market movements. By using exponential moving averages (EMAs), this indicator can provide early warning signals for potential market reversals and trend changes. One of the key features of the 2 EMA Color Alerts Indicator is its customizable alerts. With this feature, traders can set their own parameters for receiving alerts, such as the EMA periods and the type of alert (e.g. sound, pop-up, email). This al
FREE

Some short but nice algo giving signals and some ideas for stops. Five moving averages are used to find cross overs and create a zone. All periods and methods are adjustable but default values are optimized already. If you have lags on long history you can reduce MaxBars to make it work faster. Please comment if need to explain the parameters. Also any improvement ideas are welcome.
FREE

Relative Volume or RVOL is an indicator that averages the volume of X amount of days, making it easy to compare sessions volumes.
The histogram only has 3 colors:
Green - Above average volume
Yellow - Average volume
Red - Below average volume
The default setting is 20 days, which corresponds more or less to a month of trading.
With the data obtained from this indicator you can better gauge the commitment behind a move. For example, you will be better equipped to judge if a breakout of a r
FREE

Volume Delta is a very powerful indicator that reads the supply on the Market. It calculates the Delta from movement of the price and the difference of BUY and SELL Tick volumes. Its special structure allows you to get all timeframe values available on the MT4 platform. A good observation of this instrument can suggest great entry points and possible reversal. We are confident that this tool will help you to improve your trading timing. See also for MT5: https://www.mql5.com/en/market/product/5

Lot Size Calculator – Position Sizing Tool This indicator calculates lot size based on the selected risk percentage and stop loss distance. It is designed for Forex & Gold and cryptocurrency trading.
Main Features Position sizing based on account balance / available equity and chosen risk percentage Market order and pending order modes Visual trade levels: entry, stop loss, and take profit lines on chart Risk-to-reward ratio display Automatic lot adjustment depending on stop loss distance Prof
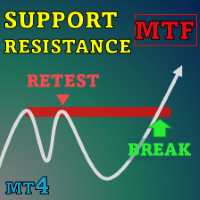
Special offer : ALL TOOLS , just $35 each! New tools will be $30 for the first week or the first 3 purchases ! Trading Tools Channel on MQL5 : Join my MQL5 channel to update the latest news from me In the ever-changing landscape of financial trading, accurately identifying and analyzing support and resistance levels is essential for making informed investment decisions. SnR Retest and Break Multi-Timeframe is a support and resistance indicator designed to enhance your trading analy

RoundNumbers indicator is a simple and powerful psychological price levels. Trader usually use these levels as a Support and Resistance (SnR). Indicator Input: Levels - Numbers of levels drawn on chart. Default 30 levels. BoxSize - Box size drawn on each levels, indicate buffers around levels. Default value 1pips (10point) above and below each levels. ZoneSize - Distance between each levels, default value 10pips (100point). Style & Colours - User inputs customization.
For MT5 version, please re
FREE
XAU Scalper MT4 MT5 Version An analytical tool for observing short-term price movements in gold pairs. The XAU Scalper Indicator provides buy and sell signals based on candle stability, RSI, and short-term momentum. It is designed to help traders identify potential entry points during brief market movements in XAU pairs. Features Candle Stability Index: Measures the proportion between candle body and wicks to assess price action reliability. RSI Index: Tracks relative strength to indicate pote

The indicator includes two parts. Part I: Color Candles Show the Major Trend Color candles is to identify the market state by color candlesticks. As shown in the screenshots, if the color is Aqua, the market is in a state when you should place long orders or exit short orders. If the color is Tomato, it is the time to place short orders or exit long orders. If the color is changing, it is better to wait for its completion (until the current bar is closed). Part II: Draw bands The inner bands is

The intention of the dashboard is to provide a quick overview of the daily, weekly and monthly range of configured assets. In "single asset mode" the dashboard shows you possible reversal points directly in the chart, thus making statistics directly tradable. If a configured threshold is exceeded, the dashboard can send a screen alert, a notification (to the mobile MT4) or an email. There are various ways of using this information. One approach is that an asset that has completed nearly 100% of

This indicator allow you to measure Profit/Loss of current, closed or future trade in account currency and estimate margin level at the trade close point. Profit/Loss indicator is based on MT4 native Crosshair instrument and has following inputs: Trade Direction = Buy/Sell Lot size = 0.1 Font size = 8 Font color = DeepSkyBlue Offset horizontal Offset vertical
FREE
Classic ZigZag formula. But no lags and repaints. You can see on screenshots that it shows values between peaks and it is useful to test strategies based on indicator. Because sometimes people find a good idea about it but don't understand that repainting indicators have some things to keep in mind. The parameters are the same as original ZigZag indicator: Depth, Deviation and Backstep.
FREE

A forex pivot point strategy could very well be a trader’s best friend as far as identifying levels to develop a bias, place stops and identify potential profit targets for a trade. Pivot points have been a go-to for traders for decades. The basis of pivot points is such that price will often move relative to a previous limit, and unless an outside force causes the price to do so, price should stop near a prior extreme. Pivot point trading strategies vary which makes it a versatile tool for
FREE

* All Symbols x All Timeframes scan just by pressing scanner button ** *** Contact me to send you instructions and add you in "Candle Scanner group" for sharing or seeing experiences with other users. Introduction: Candles tell their story. When looking at a candle, it’s best viewed as a contest between buyers and sellers. Candlestick patterns are used to predict the future direction of price movement. Candlesticks are an easy way to understand the price action. You can use candlesticks to decid
FREE
Introducing the Awesome Oscillator Alert , a powerful technical indicator that provides traders with valuable insights into market dynamics and trading opportunities. With its comprehensive features and user friendly interface, this indicator is an essential tool for traders looking to gain an edge in the market.
One of the standout features of the Awesome Oscillator Alert is its compatibility with all currency pairs and timeframes. Whether you're trading major pairs or exotic currencies, this

The Simple ICT Concepts Indicator is a powerful tool designed to help traders apply the principles of the Inner Circle Trader (ICT) methodology. This indicator focuses on identifying key zones such as liquidity levels, support and resistance, and market structure, making it an invaluable asset for price action and smart money concept traders. Key Features Market Structure : Market structure labels are constructed from price breaking a prior swing point. This allows a user to determine t

. Simple Trading System Update !!! Follow this link to see our Strategy !!! (With auto trade indicator)
Description This is an indicator Free Version and showing only history signals, Not real time. Binary Deal Trading Indicator is an indicator on MT4 for Binary Option Trading. It forecasts the overbought / oversold level, Reversal and Fractal point. This indicator will help you to decide a reversal price on any time frame (Recommend M1, M5 and M15). The expiry time is 5-15 minutes after rec
FREE
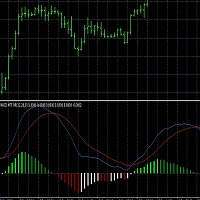
This script generates a MACD with 6 color-coded histogram bars based on the position (above or below zero) and direction (rising or falling) of the histogram. It provides multi-time frame support , allowing users to view the MACD from different time frames on a single chart. The indicator uses customizable settings for MACD periods, histogram width, and vertical scaling. This script could be useful for traders who want a visually enhanced MACD with clearer trend and momentum representation acro
FREE

This indicator displays pivot points in the chart, including historical vales, and supports many calculation modes for Pivot Points and S/R levels. [ Installation Guide | Update Guide | Troubleshooting | FAQ | All Products ] It plots historical levels for backtesting purposes
It allows you to select the reference timeframe It implements different Pivot Point calculation modes It implements different SR calculation modes
It implements customizable colors and sizes
Calculation Modes The indicator
FREE

The Silent Edge of Smart Money
"It's not about how much you do, but how much love you put into what you do that counts." – Mother Teresa
They say the real money in trading is made in the shadows—where inefficiencies hide and only the most perceptive capitalize. That’s exactly where the Arbitrage Thief Index (ATI) thrives. For years, this tool has been my personal advantage , silently identifying low-risk, high-reward trades before the crowd even notices. It’s the kind of edge top fund managers

It would be good to always be aware of the "struggle" between buyers and sellers. Then it would be much easier to determine the best direction to go in order not to lose out. This indicator offers an original solution to this problem: the supply and demand values are compared with the High and Low prices for the selected period, thus trying to determine the market movement towards the stronger side without ignoring the strength of the opposite side. All this is displayed in a separate window usi

Mahdad Candle Timer MT4 — Real‑Time Candle Countdown Mahdad Candle Timer is a lightweight and precise MetaTrader 4 indicator that displays the remaining time until the current candle closes, shown directly beside the latest bar. It is designed for traders who rely on accurate timing — whether scalping, day trading, or waiting for candle confirmation in swing setups. Key Features Accurate Countdown – Remaining time in HH:MM:SS (optional milliseconds) Dynamic Placement – Always aligned with th
FREE

Indicator. Zones of support and resistance levels The most reliable tool in the hands of any technical analyst is support and resistance levels.It is these levels that magically work in the market, because the price then bounces off them, on the contrary, gaining maximum acceleration, punching them and striving for a new price point.However, in practice, many beginners face enormous difficulties in building them.This is due to the fact that the price may react quite differently to them, and ofte
FREE

FREE TopClock Indicator: This indicator is an Analog Clock That Shows: Local Time Of Pc or Time Of Broker Server or sessions(Sydney -Tokyo London -NewYork)Time or custom Time( with GMT -Base) this can shows Candle Time Remainer with Spread live. You can run this indicator several times for different times and move it to different places on the chart. If you would like, this indicator can be customized for brokers and their IB based on customer needs. For more information contact us if you
FREE

The purpose of this new version of the MT4 standard indicator provided in your platform is to display in a sub-window multiple timeframes of the same indicator. See the example shown in the picture below. But the display isn’t like a simple MTF indicator. This is the real display of the indicator on its timeframe. Here's the options available in the FFx indicator: Select the timeframes to be displayed (M1 to Monthly) Define the width (number of bars) for each timeframe box Alert pop up/sound/ema
FREE

Range Filter - BreakOut EA
What is the Range Filter? The Range Filter is an innovative tool designed to smooth out market noise and highlight meaningful price movements. Rather than focusing on every small fluctuation, the Range Filter eliminates insignificant activity, allowing traders to see trends more clearly. The idea comes from the QQE’s volatility filter, but instead of applying it to RSI, this approach is applied directly to price action. Here’s how it works: A smoothed average of t
FREE

Institutional Liquidity Compression Indicator This indicator measures real-time liquidity tightening using the normalized width of Bollinger Bands, trading volume, and average spread to identify compression phases preceding price breakouts. Display:
Professional-style separate window with a histogram showing the “Compression Score” and a threshold line. Key Features Early Detection: Identifies contraction zones before major price impulses. Multi-Factor Measurement: Combines normalized Bollinger

TG MTF MA MT5 is designed to display a multi-timeframe moving average (MA) on any chart timeframe while allowing users to specify and view the MA values from a particular timeframe across all timeframes. This functionality enables users to focus on the moving average of a specific timeframe without switching charts. By isolating the moving average values of a specific timeframe across all timeframes, users can gain insights into the trend dynamics and potential trading opp
FREE

Levels indicator based on the previous day. Mathematical formula determines entry and exit levels.
Trading recommendations. Levels are traded at the beginning of the European session when volatility appears. In case of insufficient volatility use half of take profit to exit. If the price reversed at half take profit, then on the reversal look for a target also at the level of half take profit. If the price bounced from the entry level, then in the opposite direction the price can reach the se
FREE
Signal Mastery: Your Edge in the Market Tired of lagging indicators and missed opportunities? Meet Signal Mastery (EMA20-MACD System) —the powerful, non-repainting indicator designed to deliver high-probability trading signals right when you need them. This isn't just another MACD or EMA tool. It's a professional-grade system that intelligently combines EMA 20 and MACD Crossover logic to pinpoint optimal entry and exit points. Best of all, it includes an optional EMA 200 filter to ensure you on
FREE
XE Forex Strengh Indicator MT4 displays visual information about direction and strength of a signal for current pair and chosen timeframes (M5, M15, M30 and H1). Calculations are based on multiple factors and results are shown as a colored panel with scale bar, numerical values and arrows. There are also displayed values of current price and spread on the pair. There can be activated an alert (as a mail or pop-up window with sound) for each available timeframes which send a message when the dir
FREE

Magnetic Price Finder indicator, the average price to which the price tends to return. Optimized for XAUUSD H1. It has 3 lines, the central one being the price to focus on. Based on historical data, the success rate of returning to the average price was over 92% with default settings; in other cases, the stop loss, which is set by default, was triggered. The entry point and entry time are approximately at the beginning of the day, and for convenience, the first candle of the new day is marked wi
FREE

The Colored MACD indicator is a versatile and powerful tool designed to enhance your technical analysis by providing an intuitive visualization of market momentum and trend changes. Built on the foundation of the popular Moving Average Convergence Divergence (MACD) indicator, this version introduces color-coded histograms to easily distinguish between bullish and bearish momentum. Key Features: Color-Coded Visualization : The indicator features a lime-colored histogram when the MACD is above the
FREE
Identify trending and flat markets effortlessly
This indicator calculates how much has a symbol moved in relative terms to find trending or flat markets. It displays what percentage of the latest price range is directional. It can be used to avoid trading in flat markets, or to find flat markets to execute range-bound trading strategies. [ Installation Guide | Update Guide | Troubleshooting | FAQ | All Products ] A value of zero means the market is absolutely flat A value of 100 means the marke
FREE

Market Time Watch A clean, lightweight and essential time-tracking tool for every trader Market Time Watch is a professional on-chart time display designed for traders who need an accurate real-time clock and precise candle timing while analyzing the markets. This tool helps you instantly see current local time , server time , and candle countdown directly on your chart without any clutter or heavy UI components. Whether you scalp fast markets, swing-trade sessions, or simply need a clean time r
FREE

Limited time offer! For the launch of NextBot Scalper EA , the price of this indicator will drop to FREE !
Introducing a pragmatic and innovative tool for MetaTrader 4 (MT4) traders: the Linear Regression Next channel indicator, enhanced with the determination coefficient R 2 . This indicator serves as a foundational tool for traders seeking to understand market trends through the lens of statistical analysis, specifically linear regression.
The essence of this indicator lies in its ability t
FREE

Trend Alchemist: Turn Market Chaos into Trading Gold! Are you tired of conflicting signals and getting caught on the wrong side of the trend? The Trend Alchemist indicator cuts through the noise to give you clear, high-probability entry and exit points. This powerful system combines the reliable trend filtering of Multiple Exponential Moving Averages (EMAs) with the precise timing of the Stochastic Oscillator . It doesn't just show you the trend; it confirms the market alignment and pinpoints t
FREE

I recommend you to read the product's blog (manual) from start to end so that it is clear from the beginning what the indicator offers. This multi oscillator, multi time frame and multi symbol indicator identifies when a divergence occurs between price and an oscillator/indicator. It identifies both regular/classical (trend reversal) and hidden (trend continuation) divergences. It has moving average, RSI/Bollinger, ADX, pin bar and engulfing filter options which makes it possible to filter

The Trade by levels indicator is designed to automatically determine the formation of a model for entering the market on the chart of the selected instrument.
Definitions: ⦁ BFl is the bar that formed the level. ⦁ BCL1 and BCL2 bars, confirming the level.
The graphical model: ⦁ levels high\low the bars BFL and BCL1 must match the accuracy to the point ⦁ there can be any number of bars between BFL and BCL1. ⦁ between BCL1 and BCL2 intermediate bars
FREE
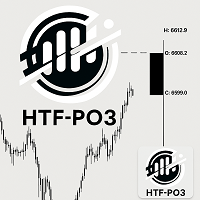
HTF Power of Three (ICT) - MT4 Indicator Overview The HTF Power of Three indicator is a professional implementation of the Inner Circle Trader's (ICT) Power of Three concept, inspired by Larry Williams. This indicator visualizes higher timeframe (HTF) candle development in real-time on any lower timeframe chart, making it an essential tool for ICT traders who study institutional price movement patterns. What is Power of Three (PO3)? Power of Three represents a three-staged Smart Money campa
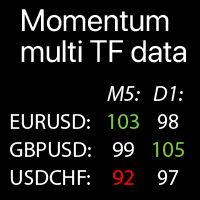
Multi-timeframe Momentum values on the selected Symbols: compare the current market trends The indicator displays Momentum indicator values from all selected timeframes and Symbols in a single table , which allows you to quickly analyze current market price trends .
Multifunctional trade manager : 66+ features | Contact me for any questions | MT5 version Each Symbol can be customized: removed / replaced. You can add up to 40 Symbols. Panel can be moved to any place of the chart (drag
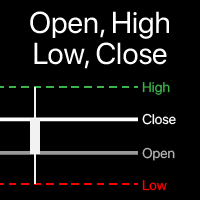
Visualization of Open, High, Low, Close levels on the chart You can choose any timeframe , not just the current one. The offset of the calculated bar can be adjusted : the current (floating) bar , or a set number of bars back . Multifunctional utility : includes 66+ functions | Contact me if you have any questions | MT5 version In the settings of the indicator, you can configure: Calculation method: Dynamic bar, based on the

The indicator displays the probable ( Support and resistance ) levels. The indicator draws horizontal and trend levels of support and resistance. The indicator settings: Trends - the mode for displaying trend lines or horizontal lines of support and resistance Yes - display trend lines only No - display horizontal lines only UseResource - use the resources built into the indicator. Yes - use the ZigZag indicator from the resources of the product. No - use a custom ZigZag indicator. HistoryBar -
FREE

Bull and Bear Strength Indicator Overview:
The Bull and Bear Strength Indicator is a versatile and intuitive tool designed to give traders a decisive edge. It captures the balance of power between bulls and bears, providing actionable insights into market sentiment and momentum for any timeframe or instrument. The Bull and bears strength indicator allows you to see the areas where momentum and volume has peaked. It highlights areas of strength within a range. A truly simple indicator with p

"Capture the sleeping and waking alligator." Detect trend entrance/exit conditions - this indicator can also be tuned according to your trading style. You can adjust a confidence parameter to reduce false positives (but capture less of the trend). This is based on a modification of the Alligator indicator by Bill Williams, an early pioneer of market psychology. 2 main strategies: either the " conservative" approach to more frequently make profitable trades (at a lower profit), or the " high r
FREE

What is the ADX_DI Indicator? ADX_DI is an advanced technical analysis indicator developed for MetaTrader platform. It combines Average Directional Index and Directional Indicator components to analyze market trend strength and direction. What Does It Do? Measures Trend Strength : ADX line shows the strength of market trends Determines Direction : DI+ (green) and DI- (red) lines identify trend direction Detects Trend Changes : DI+ and DI- crossovers provide trend reversal signals Automatic Alert
FREE
Highly configurable Macd indicator.
Features: Highly customizable alert functions (at levels, crosses, direction changes via email, push, sound, popup) Multi timeframe ability Color customization (at levels, crosses, direction changes) Linear interpolation and histogram mode options Works on strategy tester in multi timeframe mode (at weekend without ticks also) Adjustable Levels Parameters:
Stochastic RSI Timeframe: You can set the lower/higher timeframes for Stochastic RSI. Stochastic RSI
FREE

This automated DOJI BAR FINDER INDICATOR can be utilized to manage trades and identify potential areas of support and resistance for both buying and selling. It is designed to identify zones for Sell/Buy trades and can be effectively used in conjunction with other indicators, such as order block indicators, and more. Currently designed for MT4, it will later be adapted to function on MT5. We also offer the opportunity to customize the robot according to your trading strategy.
FREE
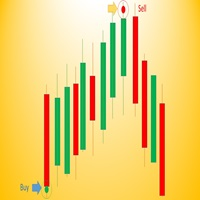
Wave Entry Alerts In Gold is a custom indicator developed by Azad Gorgis for MetaTrader 4. This indicator is designed to provide alerts based on ZigZag patterns, specifically tailored for trading on the Gold (XAU/USD) symbol.
Key Features: - Chart Window Indicator: The indicator is designed to be displayed on the main chart window. - Arrow Signals: The indicator generates arrow signals on the chart, indicating potential reversal points based on ZigZag patterns. - Customizable Parameters: Trade
FREE

The indicator draws price channels. It can be customized so that only buy or sell channels are displayed. Also, trend lines can be displayed instead of channels. This indicator is easy to use, but nevertheless, there are many trading strategies based on channel trading. Advisor based on this indicator: https://www.mql5.com/en/market/product/37952 Parameters History - maximum number of bars to build channels; Distance - minimum distance from one High (or Low) to another when constructing a chann
FREE
Advanced UT BOT ALERTS for MT4 Professional Multi-Filter Trend Detection System | Enhanced UT BOT Engine We only provide high-quality indicators. Advanced UT BOT is built for professional use, featuring a stable signal logic and secure calculation process that prevents any delays or false updates.
It does not repaint, redraw, remove, or modify past signals in any way.
All BUY and SELL signals are generated only after the candle has closed , ensuring consistent accuracy and reliability.
There is
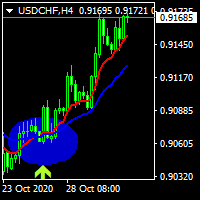
hi dear today i write an indicator of crossing 2 moving averages and show a label for the signals of it . .......................you can select the period of movings and the method of moving............... ......................and also method of apply price and see the movings and signals.................. ................also you can turn off showing movings to see just signal labels.......................... ................................................wish the best for you................
FREE
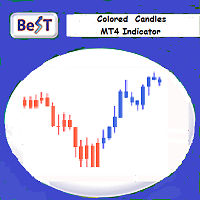
BeST_Colored Candles is an MT4 FREE indicator that can change the color of the Candlesticks based on the MACD, SAR or RSI values and levels. It is a Composite indicator that by selection uses the values each one of these 3 indicators and their critical levels in order to create numerical relationships that when satisfied cause their corresponding candlesticks coloration.
Input parameters
== Basic Settings
-- Please Select Indicator - for selecting which one of the above 3 indicators
FREE

Pivot Classic, Woodie, Camarilla, Fibonacci and Demark
Floor/Classic Pivot points, or simply pivots, are useful for identifying potential support/resistance levels, trading ranges, trend reversals, and market sentiment by examining an asset's high, low, and closing values. The Floor/Classic Pivot Points can be calculated as follows. Pivot Point (P) = (High + Low + Close)/3 S1 = P * 2 - High S2 = P - (High - Low) S3 = Low – 2*(High - P) R1 = P * 2 - Low R2 = P + (High - Low) R3 = High + 2*(P - L
FREE

Easy Scalp System Pro: Never Miss an Entry Again! Are you tired of complex trading setups that leave you guessing? Introducing the Easy Scalp System Pro —your ultimate, high-accuracy tool for capturing fast profits in any market! This powerful indicator combines the best of trend confirmation (Multiple EMAs) and momentum timing (MACD) into clear, non-repainting Buy and Sell arrows right on your chart. It's designed for scalpers and day traders who demand speed and precision. Why Choose Easy Sca
FREE

Stochastic with Trend Filter: Precision Signals This is a powerful and easy-to-use indicator designed for traders who want more reliable signals from the classic Stochastic oscillator. How It Works: This indicator improves on the standard Stochastic by adding a powerful trend filter. It uses an Exponential Moving Average (EMA) to determine the overall direction of the market. The indicator will only generate a "buy" signal when both the Stochastic crossover is bullish and the price is above the
FREE
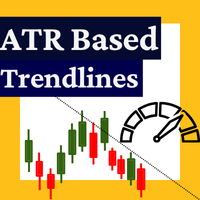
This indicator is the converted Metatrader 4 version of the TradingView indicator "ATR Based Trendlines - JD" by Duyck. This indicator works by automatically and continuously drawing trendlines not based exclusively on price, but also based on the volatility perceived by the ATR. So, the angle of the trendlines is determined by (a percentage of) the ATR. The angle of the trendlines follows the change in price, dictated by the ATR at the moment where the pivot point is detected. The ATR percentag
FREE

Are you tired of wasting time trying to figure out the total value of your TP and SL lines on Metatrader charts? Look no further, because we have a solution for you. Introducing our free MT4 indicator that allows you to easily track the total SL and TP of your positions on any corner of your screen. With customizable X-Y parameters and color options, you can personalize your screen to fit your trading style. Say goodbye to the hassle and confusion of monitoring your positions, and make smarter
FREE
Этот индикатор является уникальным в своём роде, больше всего подходит для скальпинга на XAUUSD а также для торговли на более старших таймфреймах!
Уведомление сообщит самые важные точки входа, поэтому следует торговать по тренду. Идеален для скальпинга! The Best Trend Signals - трендовый мультивалютный индикатор, может использоваться на любых финансовых инструментах валюта, криптовалюта, металлы, акции, индексы. Рекомендуемый тайм-фрейм M15, M30, H1, H4, D1.
Как торговать с помощью индикатора
FREE

Forex Vitals Market Hours (MT4) — Session Range Boxes + Live Session Dashboard (FREE) Forex trading is very different depending on when you trade. This indicator makes that visible by plotting the High/Low range boxes for the 4 major sessions — Sydney, Tokyo, London, New York — directly on your chart, so you can instantly see where each session’s range formed and how price behaved during overlaps. What you get Color-coded session range boxes (High/Low for each session) Optional filled boxes or c
FREE

Price Channels are also known as Donchian Channels being named after Richard Donchian. They use the highest and lowest price of a set number of periods to create an upper and lower channel or envelope around the price. The upper channel shows the high of the number of periods chosen. The lower channel shows the low of the number of periods chosen. For example, the screenshot shows the Price Channels using 320 periods. The upper channel in the screenshot shows the highest high of the previous 3
FREE

Unleash Your Trading Edge with TrendSight Pro! Tired of lagging indicators and confusing charts? TrendSight Pro: Signal Paint Engine is the solution you need. This smart indicator cuts through the market noise, giving you clear, high-probability trade signals right on your chart. It's designed to make your trading simpler, faster, and more profitable by combining quick momentum analysis with a powerful long-term trend filter. Key Advantages and Features Crystal-Clear Trade Signals: Forget compl
FREE

Symmetrical Triangle Pattern Indicator - Mastering Trend Recognition in MetaTrader Unlock the power of trend recognition with the "Symmetrical Triangle Pattern" indicator for MetaTrader. This innovative tool simplifies the identification of symmetrical triangle patterns, providing traders with clear signals for potential trend continuation or reversal. Elevate your trading strategies with this MQL offering. Key Features : Accurate Pattern Recognition : The Symmetrical Triangle Pattern Indicator
FREE
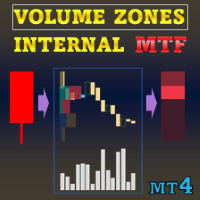
Special offer : ALL TOOLS , just $35 each! New tools will be $30 for the first week or the first 3 purchases ! Trading Tools Channel on MQL5 : Join my MQL5 channel to update the latest news from me Volume Zones Internal Visualizer Multi-Timeframe – The ultimate solution for gaining a detailed view of lower timeframe volume activity while trading on a higher timeframe chart. If you’re looking for a powerful and intuitive volume analysis tool that supports multi-timeframe functionali

www tradepositive .lat
ALGO Smart Flow Structure Indicator The institutional standard for market structure. Designed for serious SMC (Smart Money Concepts) and Price Action traders, this indicator eliminates the noise of conventional fractals. Forget about repainting signals and ambiguity; get a crystal-clear view of the real market structure , validated by strict algorithmic rules. The Bias Dashboard Make informed decisions by monitoring 3 critical variables across 8 simultaneous timefr
FREE

With this system you can spot high-probability trades in direction of strong trends. You can profit from stop hunt moves initiated by the smart money!
Important Information How you can maximize the potential of the scanner, please read here: www.mql5.com/en/blogs/post/718109 Please read also the blog about the usage of the indicator: Professional Trading With Strong Momentum This FREE Version of the indicator works only on EURUSD and GBPUSD. The full version of the indicator can be found here:
FREE

Blahtech Moving Average indicator is a multitimeframe version of the standard Moving Average indicator. It is also enhanced with customisable alerts, period breaks and other configuration options. The 50 day and 200 day moving averages are widely followed by investors and traders, with breaks above and below the MA lines considered to be signals of interest. Links [ Install | Update | Training | All Products ]
Feature Highlights Up to three timeframes Configurable calculation variabl
FREE

Product Title Smart Accelerator (MT4) – part of the SmartView series Short Description A Accelerator indicator with a unique user experience on MetaTrader platform. Features advanced capabilities not previously available, such as opening settings with double-click, hiding and showing indicators without deleting them, and displaying indicator windows at full chart size. Designed to work seamlessly with the rest of the SmartView Indicators series. Overview The SmartView series offers a unique and
FREE
The MetaTrader Market is the only store where you can download a free demo trading robot for testing and optimization using historical data.
Read the application overview and reviews from other customers, download it right to your terminal and test a trading robot before you buy. Only on the MetaTrader Market you can test an application absolutely free of charge.
You are missing trading opportunities:
- Free trading apps
- Over 8,000 signals for copying
- Economic news for exploring financial markets
Registration
Log in
If you do not have an account, please register
Allow the use of cookies to log in to the MQL5.com website.
Please enable the necessary setting in your browser, otherwise you will not be able to log in.